Try out vector search for yourself using this self-paced hands-on learning for Search AI. You can start a free cloud trial or try Elastic on your local machine now.
Elasticsearch simdvec delivers up to 50x faster vector distance computation than serial code. Getting there required solving four successive hardware bottlenecks, each fix revealing the next. This post walks through cascade unrolling, batch prefetching, dim-axis unrolling and a structural refactor that turned out to be the biggest win of all, together producing up to 2x throughput improvement. It's a companion to How we built Elasticsearch simdvec to make vector search one of the fastest in the world.
Every vector search query in Elasticsearch, whether Hierarchical Navigable Small World (HNSW) traversal, inverted file (IVF) scan, or reranking pass, reduces to the same problem: computing distances between vectors, millions of times per query.
Elasticsearch simdvec is the engine behind every vector distance computation in Elasticsearch. Computing distances between vectors is an easy operation in terms of instructions to perform; for example, a dot product is simply a combination of additions and multiplications. But making those fast, really fast, requires diving deep into how modern CPUs work, what different Instruction Set Architectures (ISAs) offer, and their similarities and peculiarities.
In this post, we dive deep into how simdvec optimizes for memory access. Hand-tuned Single Instruction, Multiple Data (SIMD) kernels for x86 and ARM perform vector distance computations in just a few CPU cycles; it’s not unusual for a SIMD kernel to be limited not by the number of operations it can perform but by the amount of data it can fetch and consume for every CPU cycle.
For example, a 1024-dimensional float32 embedding requires 1024 multiply-add operations for a single dot product. An AVX-512 processor packs 16 floats into each 512-bit register and can issue two fused multiply-add operations every cycle. At a sustained rate, that’s a throughput of one dot product in just 32 cycles, 8 nanoseconds per vector on a 4GHz CPU. Searching 1 million candidate vectors means executing that kernel 1 million times, streaming roughly 4 GB of vector data through the CPU. The silicon can crunch the math in 8 milliseconds, total; the problem is actually delivering those 4 GB in time! It’s an impossible quest, but how close can we get?
The rest of this post is about how we pushed as many vectors as we could through the silicon. It was a tightrope walk: Every step that got us closer to peak throughput tightened the constraints on the next step. The four optimizations, in the order we applied them:
- Cascade unrolling - maximize FMA port utilization with independent accumulator chains
- Batch processing and prefetching - hide memory latency by prefetching data ahead of time
- Dim-axis unrolling - sidestep L1d cache aliasing on power-of-2 dimensions
- Query load hoisting - eliminate redundant per-document query operations
Ports, pipes, latency, throughput…oh my! How modern CPUs execute SIMD vector operations
Modern CPUs can issue multiple operations per cycle because they have several execution units implemented in their silicon; operations are dispatched via interfaces called ports on x86 (execution pipelines, or pipes for short, on ARM). Ports handle different kinds of work in parallel: some memory loads and stores, some integer arithmetic, some floating-point math.
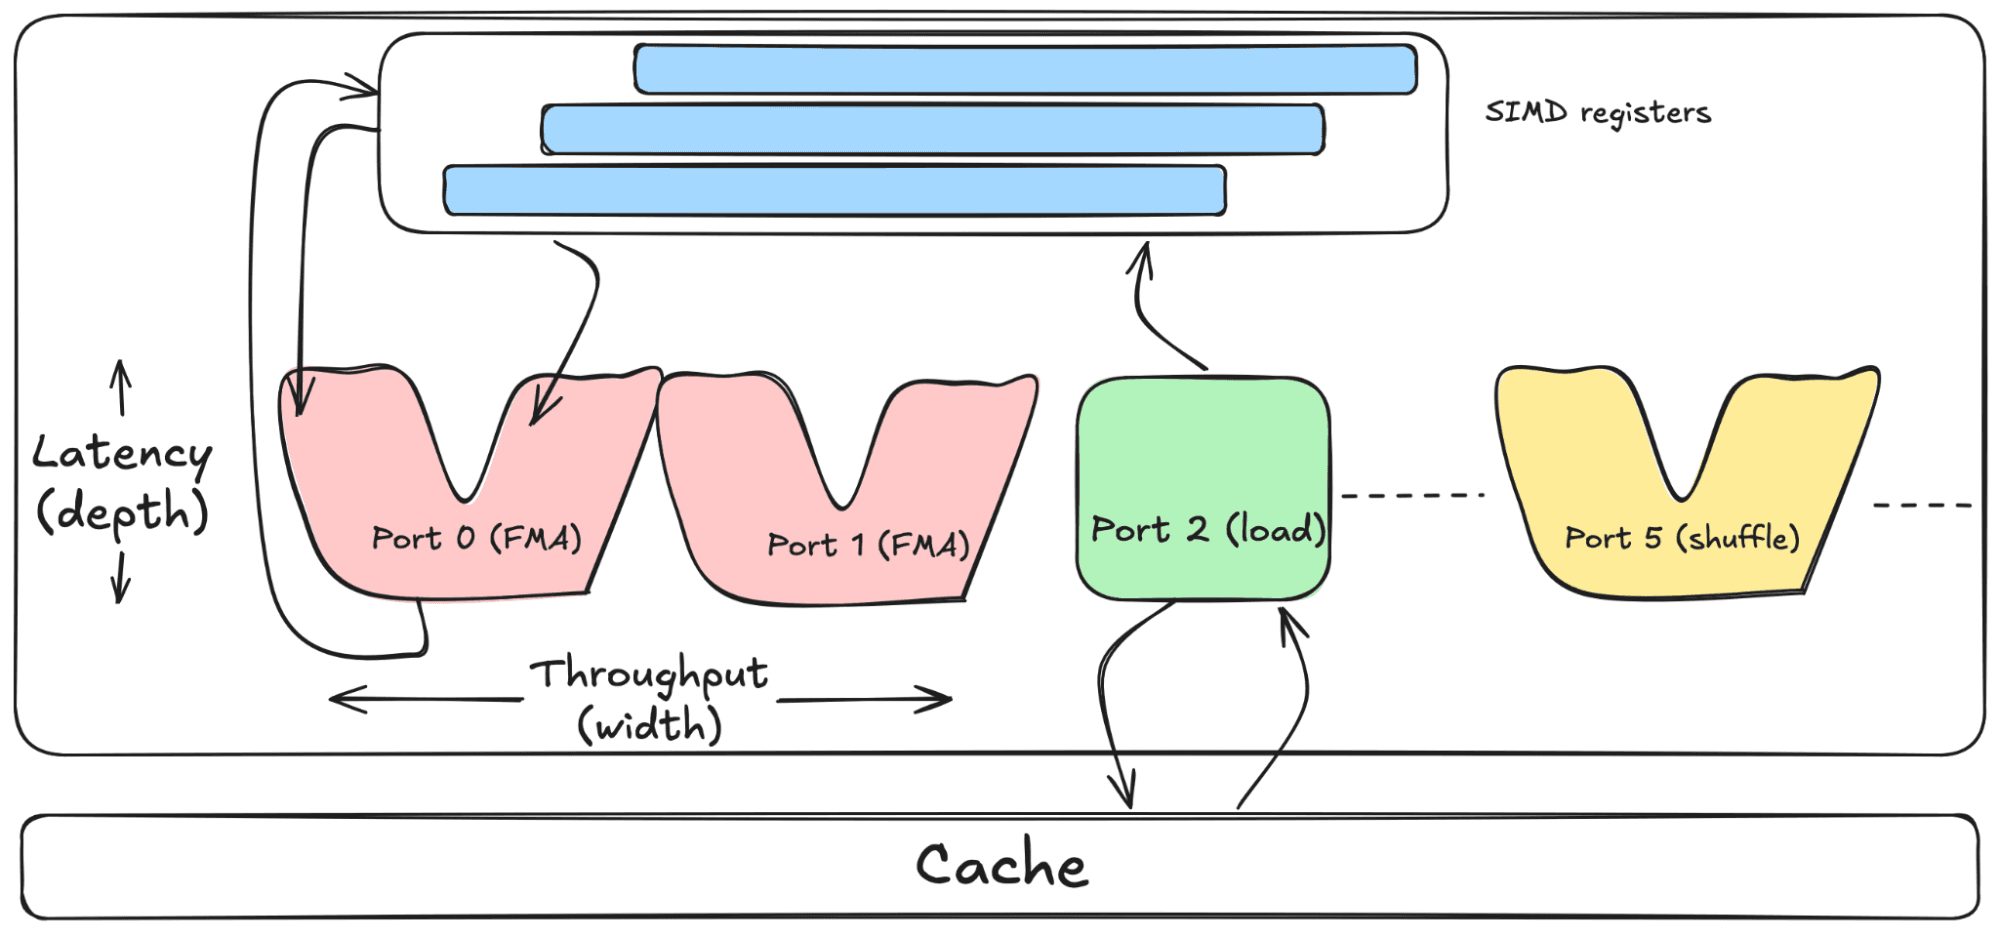
Two important properties of any operation a port can handle are latency and throughput. Latency is how many CPU cycles a single operation takes to produce its result; throughput is how many such operations can be started per cycle. Throughput is closely related to the number of ports available for a given operation: If a CPU has two ports that can execute FMAs, it can issue up to two independent new FMAs every cycle, for a peak throughput of two per cycle under ideal conditions.
Let’s take AVX-512 as an example. Most FMA instructions on modern Intel CPUs have a typical latency of ~four cycles and can execute on either of two FMA-capable ports. Starting from cold, the first result lands four cycles later, but once the pipeline is full, two new FMAs can start every cycle, as long as they don't depend on each other.
Our first steps aim at maximizing the number of ports used, balancing port usage and taking latency into account.
Cascade unrolling: maximizing FMA port utilization
Following the previous example, if an FMA instruction has a latency of four and a throughput of two, the CPU can keep ~eight FMAs in flight (issued, but not yet completed) at any moment. Of course, this can happen only if there are eight independent operations available.
If we chain them, each FMA waits for the previous one's result, and the CPU runs at latency (one FMA every four cycles) instead of throughput (two per cycle), up to 8x slower than the hardware can deliver.
It's easy to end up with a chain by accident; for example, a naive vector dot product implementation would look like foreach (i) { acc = acc + x[i]*y[i] }. With a single accumulator, each iteration depends on the previous one's result. A natural reaction is to think about unrolling the loop: If we need to keep N instructions in flight, we issue the same instruction N times. Compilers even have specific directives for that; for example, #pragma unroll.
Loop unrolling is used throughout simdvec code to exploit the inner parallelism of modern CPUs; the issue with #pragma unroll is that it’s a hint to the compiler, not a directive. Furthermore, its efficacy depends on compilation flags and compiler heuristics, so the compiler can decide not to unroll or can perform a nonperfect unrolling. For example, when we looked at the assembly the compiler produced for this loop, we saw it was unrolled but the dependency chain was still there. Manual unrolling is still needed for precise control or portability, but it’s difficult to read and impossible to maintain.
C++ templates and meta-programming
C++ templates let you write generic code with placeholder types or values that the compiler fills in at compile time. Write the function template once, and the compiler emits a specialized copy for every set of arguments you use it with. The placeholder can be a type (for example, float versus int, or register types, like __m512i or uint8x16_t), a function, a compile-time integer, … This last form is what we use most heavily: A template parameterized by an integer N lets us generate N parallel accumulators or N copies of an inner-loop body. Metaprogramming is essentially code that writes code: It uses the compiler to perform computations at compile time, with no runtime cost.
Our main tool is apply_indexed<N>, a compile-time function that emits N statements as it’s unfolded:
The if constexpr is a compile-time branch, making apply_indexed compile-time recursive; the compiler will resolve the constexpr and instantiate the next iteration of the template. Everything is handled by the compiler; no runtime branch is emitted.
We used apply_indexed<N> to implement cascade unrolling:
We unroll into a cascade: First N=4 independent accumulator chains, dropping to 2 for any half-size tail, and then 1 for the final scalar tail. This gave us a +11–13% speedup across kernels and CPUs over #pragma unroll (all details and complete numbers can be found in the PR linked above). The compiler could only get us so far; generic programming via C++ template instantiation is how we keep this extremely efficient yet compact and tractable across kernels and ISAs.
Batch processing and prefetching: hiding memory latency
Unrolling addresses instruction-level parallelism within a single vector computation but doesn’t exploit the advantages of processing in bulk.
Elasticsearch doesn't score one vector against one query; HNSW traversal alone scores hundreds of neighbors per query. Bulk scoring (one query matched against many documents) gives us both a new problem and the tools to solve it.
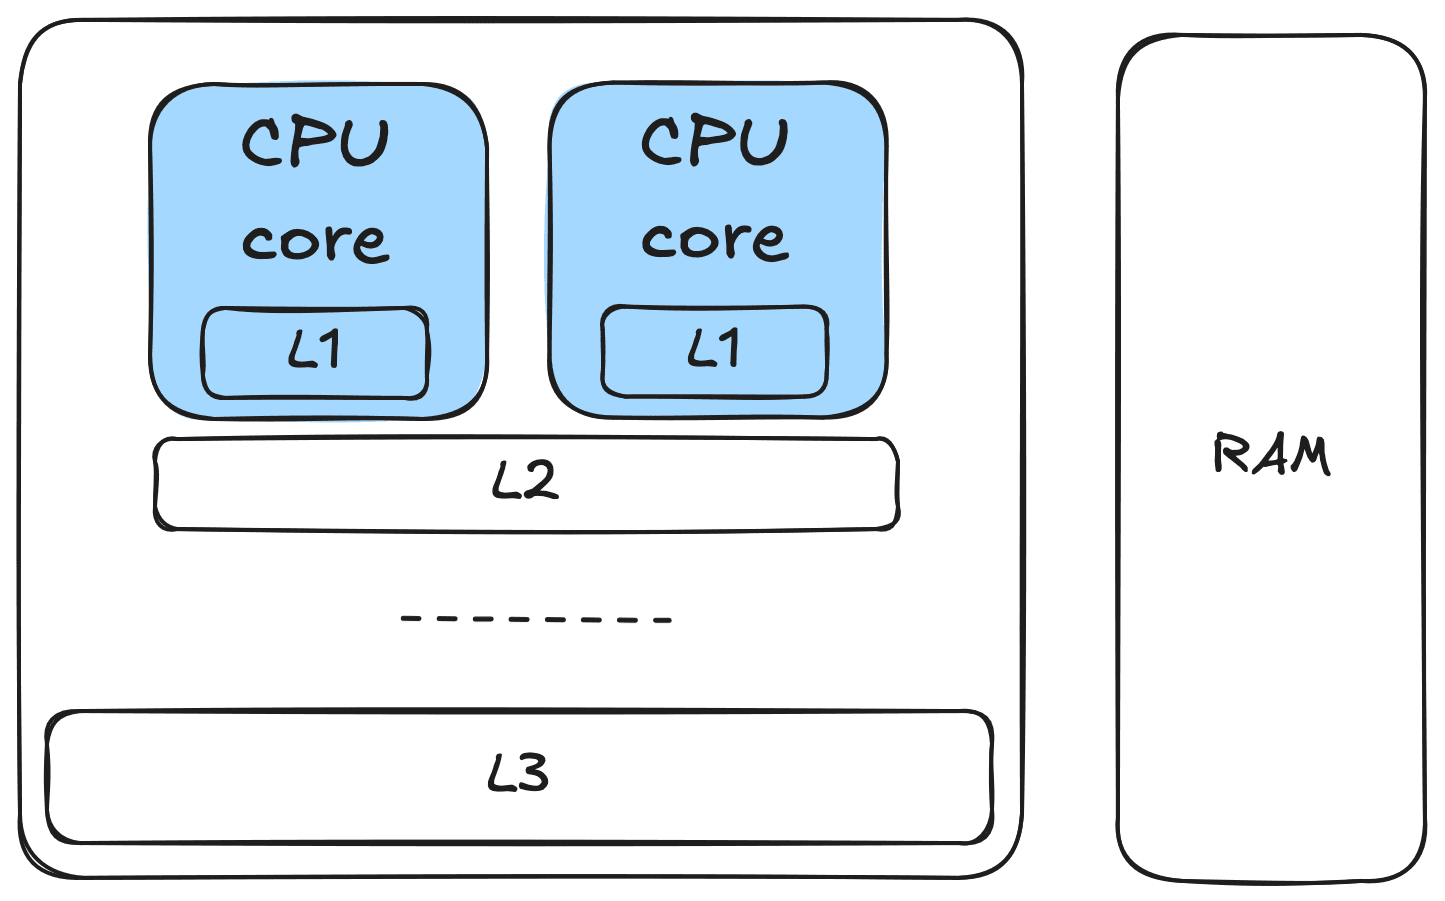
The vectors we score are often scattered across memory, producing irregular access patterns that are difficult for the CPU caches and hardware prefetchers to predict. This increases the likelihood that the data the CPU needs is not in the fast L1d cache and has to be fetched from further away (cache miss). The typical cost ranges from ~five cycles for an L1d hit to ~200+ cycles when the data must come from RAM.
It doesn’t matter if we maximized load port occupancy; if those ports stall waiting for data, the compute ports sit idle. The FMA throughput we saturated via cascade unrolling goes to waste. Retrieving data from memory to the L1d cache is time-consuming, especially if we need to traverse the whole memory hierarchy to RAM. Fortunately, as we know that we’re going to score multiple vectors, we can prime the CPU cache with the next vector (or vectors), effectively reducing or hiding the memory access latency.
Batching also helps with instruction latency, for the same reason cascade unrolling does: N independent vector streams give the CPU N independent accumulator chains to interleave, hiding the FMA pipeline latency we discussed earlier.
This is why we added batches to bulk scoring (starting with int7, later extended to all data types); the same mechanism as cascade unrolling but applied inter-vector. We process not one, but N vectors at the same time, and while we do that, we preload (prefetch) data for the next N vectors. That should help with prefetching and instruction latency, and it does in many cases: for example, for int7 we immediately saw a +20–50% improvement over non-unrolled bulk (all details and JMH benchmarks can be found in the linked PR). But as we tried to apply it to all our bulk functions, we noticed it introduced new problems/constraints.
Too much of a good thing: why burst prefetching overflows the line-fill buffer
Prefetching only helps if the line lands in L1d before the inner loop needs it. Our first attempt issued every prefetch for the next batch at the batch boundary, a burst of ~28–100 software prefetches back to back, depending on the kernel.
Processors have a limited per-core line-fill buffer (LFB); this maps directly to the maximum number of outstanding cache misses the core can track at once. As an example, Sapphire Rapids has an LFB of just 16 entries. A burst that big overflows the LFB, and the excess prefetches are silently dropped. The inner loop ends up waiting on cache misses for lines we thought were already on the way.
The fix is to spread the prefetches across the inner loop. At the batch boundary, we issue only a small head burst, enough to cover the first cache lines the inner loop will consume, and then spread the rest across iterations, each iteration pulling in the lines for the next. The total number of prefetches is unchanged, but the LFB peak occupancy drops by an order of magnitude. Lines arrive ~one outer iteration before they are demand-loaded, hiding the L2 to L1 transfer latency, and the L2 stream prefetcher coordinates better with a steady stride than with the boundary burst. Head + spread landed first for int8 and then was extended to int7 and the rest of the kernels, with a performance boost of up to +30%.
Stomping on our own feet: why did batching hurt performance on power-of-2 dimensions?
The right amount of prefetching should have given us high throughput, hiding most of the memory latency. And it did… most of the time. When vector data is effectively accessed in a sparse, random way, it works really well. But when we tried to parallelize bulk processing of sequential, contiguous documents across a batch of four, on power-of-2 dims, performance fell off a cliff.
How N-way associative cache causes power-of-2 conflicts
CPU caches are organized into cache lines and sets. A cache line is the unit of data transferred through the memory hierarchy; on both ARM and x86, it’s 64 bytes long. Each cache line maps to exactly one cache set, and each set can hold a fixed number of lines. This is known as an N-way associative cache.
A useful analogy is a hash table where every bucket has exactly N slots. Multiple memory addresses may map to the same bucket (set), but once all N slots are occupied, inserting a new entry forces an existing one to be evicted.
Let’s take a concrete example. Sapphire Rapids L1d cache is 48 KiB and 12-way associative. At 64 bytes per cache line, that gives us 768 cache lines organized into 64 sets. A cache line's set index (the “hashtable key”) is determined by bits [11:6] of the address (or, in other words, by (address / 64) % 64).
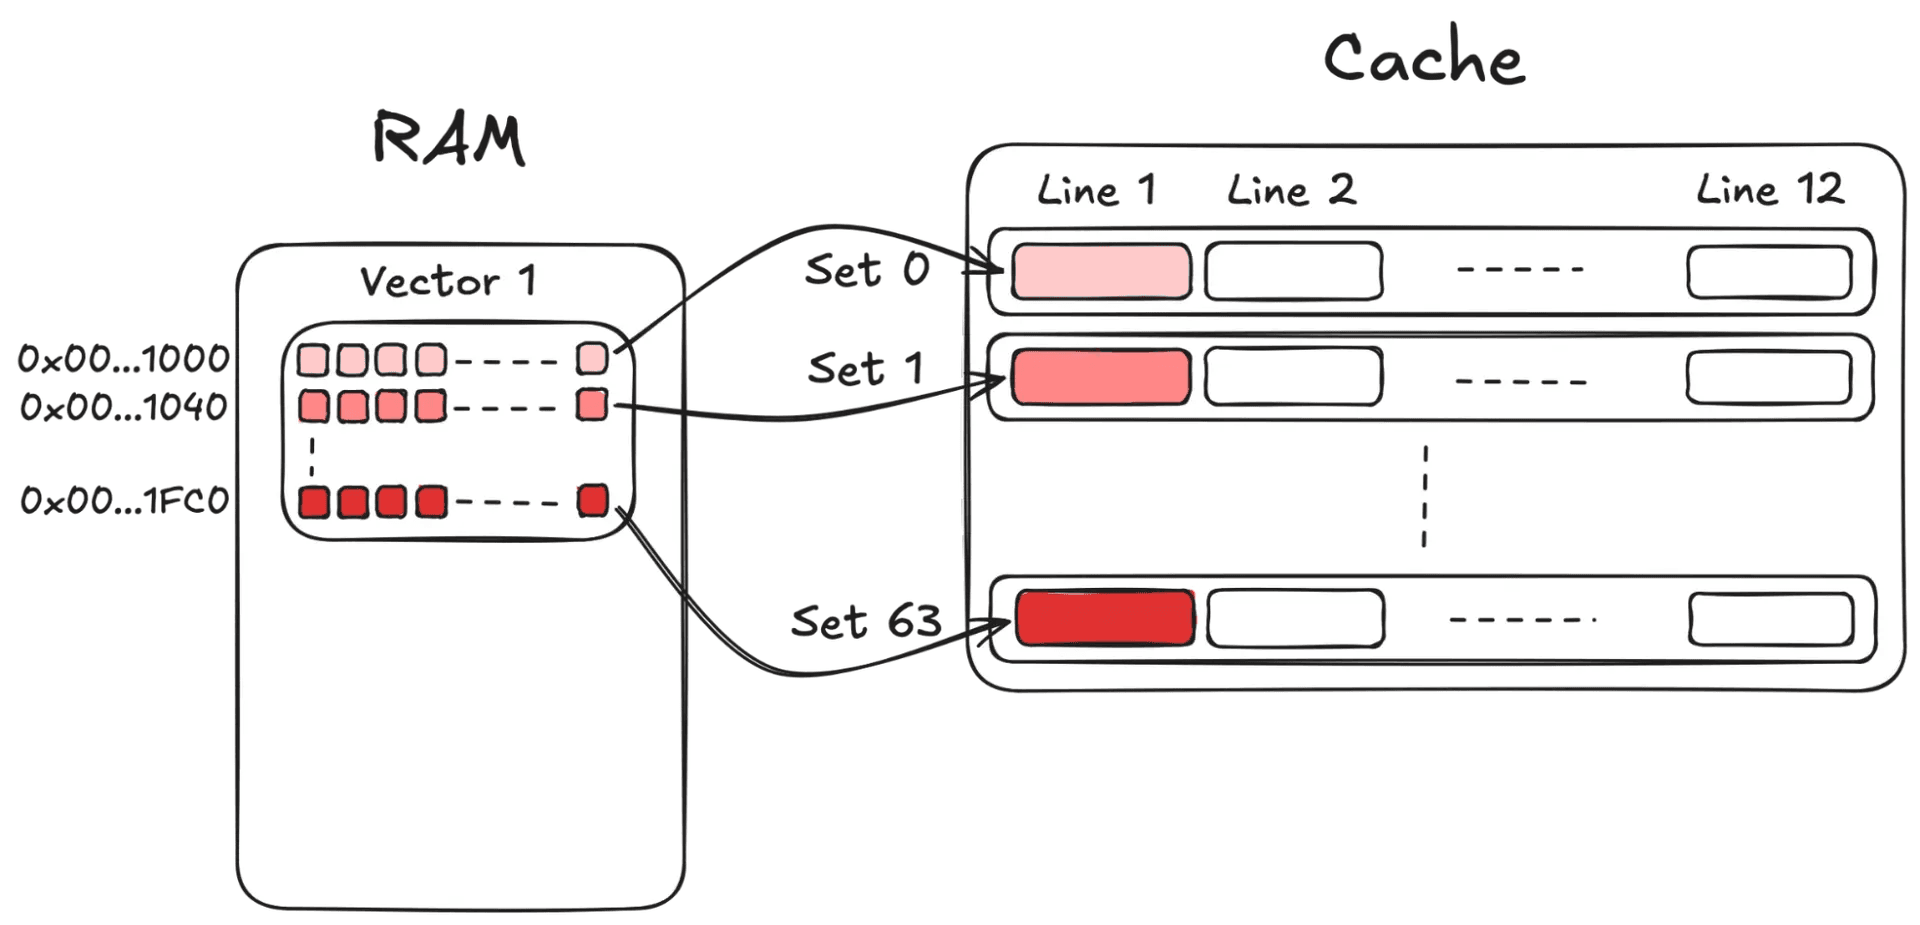
Suppose we have a float32 embedding with 1024 dimensions, stored contiguously in memory. Each vector occupies dims * sizeof(float32)= 4096 bytes, or exactly 64 cache lines. The stride between consecutive vectors is therefore 4096 bytes. Since 4096 is exactly one full wrap around the 64-set index space, the set index wraps perfectly: The i-th cache line of every vector maps to the exact same cache set.
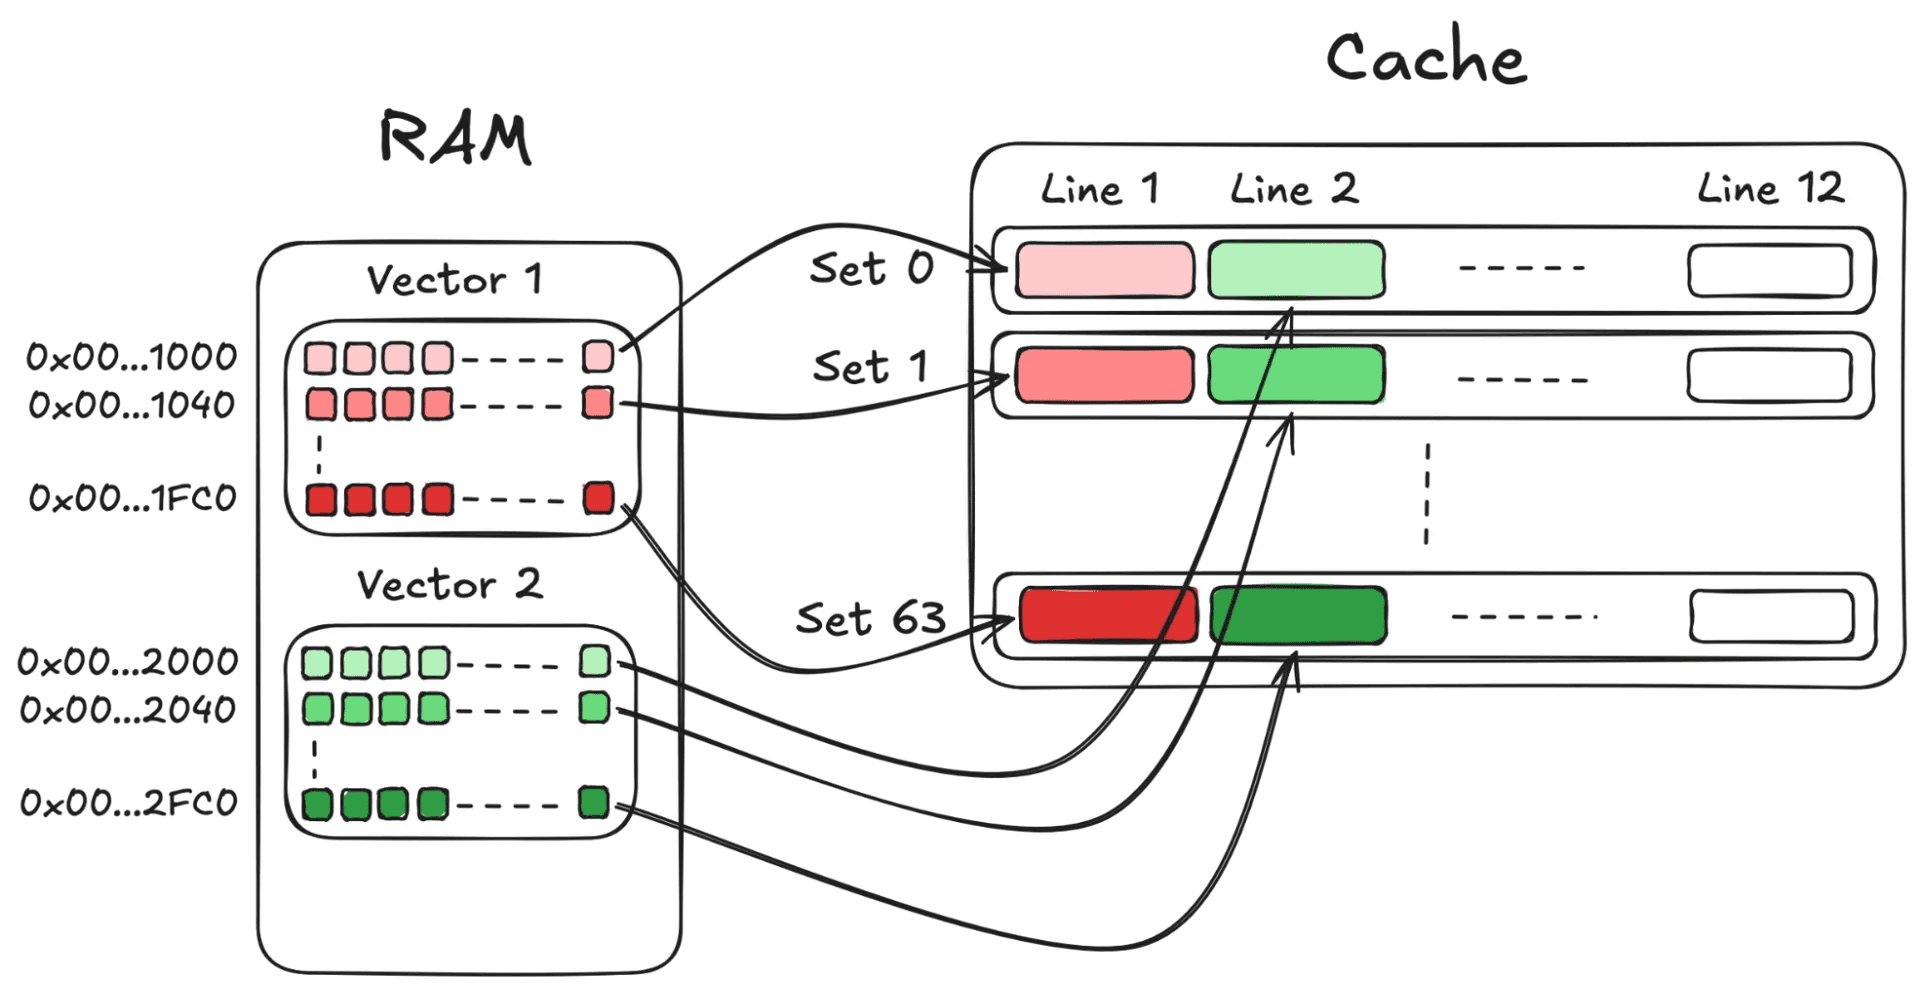
Common power-of-2 vector sizes produce a stride that's a power-of-2 in bytes, which divides 64 sets evenly, so they interact pathologically with the cache in exactly this way. Processing together a batch of N documents with such dimensions exacerbates the situation: As they fall into the same L1d sets, they cause conflicts and cache thrashing.
Fixing cache aliasing by reducing batch parallelism
We first examined in depth this effect while working on kernels for the bf16 data type. As we tried different implementations and batches values for the new kernels, we conducted extensive benchmarking, which confirmed the hypothesis that with power-of-2 dimension sizes, contiguous vectors have strides that map to the same cache sets, and interleaving multiple load streams causes evictions. Therefore our immediate fix was simple: Set batches=1 on functions with sequential access (*_bulk) to avoid L1d cache set aliasing.
However, we knew this to be a Band-Aid; bulk and wider parallelism would help with, for example, latency, so we wanted them if we could get them without reintroducing the cache conflicts.
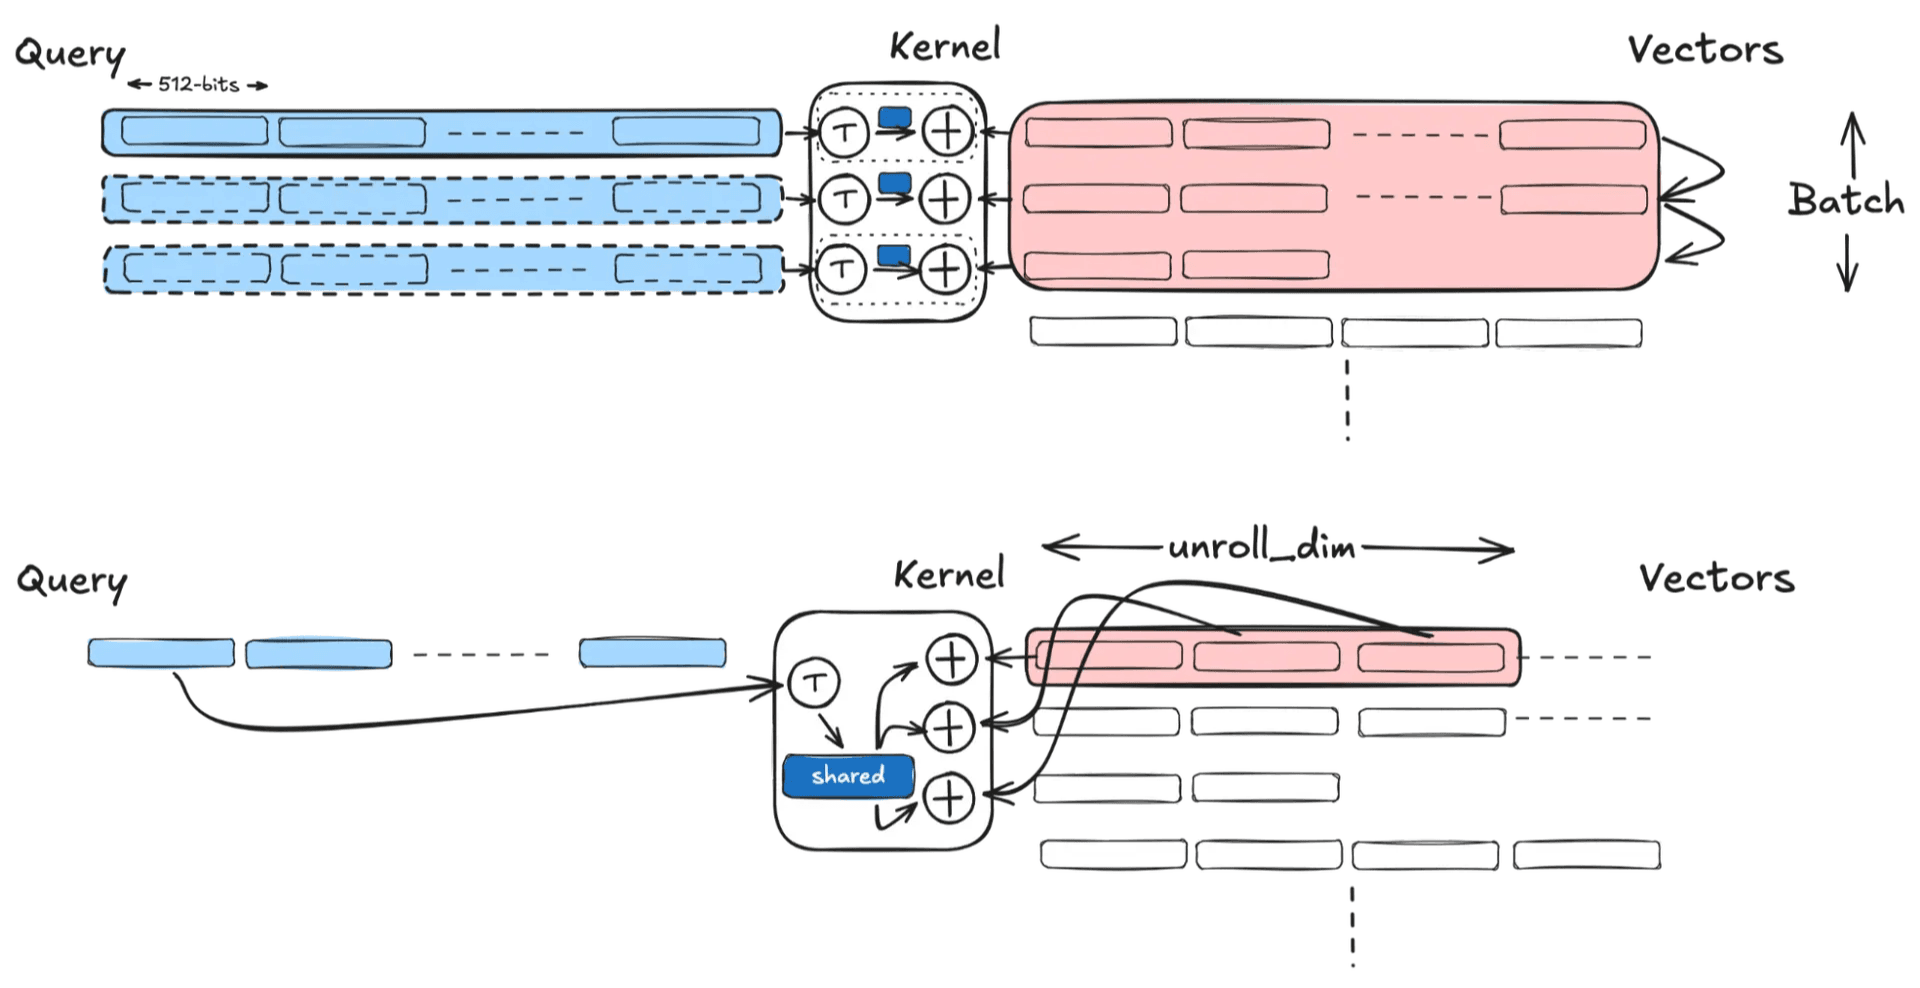
Unrolling along a different axis: saturating FMA pipelines without aliasing
batches parallelizes across documents, but that’s not the only axis available to us. We can unroll along the vector dimension axis instead. Rather than processing multiple vectors in parallel, we process multiple independent chunks of the same vector pair in parallel.
So we introduced unroll_dim. Crucially, by keeping batches=1, we sidestep the cache‑set aliasing trap altogether, and unroll_dim keeps the FMA pipeline saturated without needing the extra parallel doc loads that triggered the aliasing in the first place.
It works extremely well in some cases (+35–65% for dot product, as you’ll see from the aforementioned PR), but in other cases, the gain was more modest than we expected (~+10% for Euclidean distance). As in the other cases, all details and JMH benchmarks can be found in the linked PR.
Don’t repeat yourself: hoisting query loads to eliminate redundant port pressure
The modest gains from unroll_dim on Euclidean distance suggested another bottleneck was still hiding in the bulk loop. What we found was a structural inefficiency hiding in the bulk function template: The existing bulk scorer called the single-pair scorer for each document, reloading the query elements N (4) times per outer step.
For some functions, we were also unnecessarily repeating operations associated with the query elements multiple times. For example, the int8 Euclidean distance kernel (sqri8) was calling the vpmovsxbw sign-extension instruction four times per outer step.
Hoisting query loads and operations out of the per-document loop cut L1D bandwidth for the query elements 4x; for sqri8, it removed three of the four vpmovsxbw sign-extension instructions per outer step. Recall that throughput depends on port availability: vpmovsxbw can only execute on a single port (port 5 on Sapphire Rapids), so issuing four copies per step saturated that port entirely; the sign extensions alone were the bottleneck.
Even when there’s no query-specific operation to hoist, the change matters. For doti8, vpdpbusd executes on two ports (0 and 5 on Sapphire Rapids) with a latency of five cycles, so we need ~10 independent operations in flight to reach peak throughput. With the query load hoisted, the inner loop becomes dependency-bound on a single accumulator chain per batch element. The redundant work now gone, unroll_dim=2 can fill the latency window by adding independent chains along the dim axis.
This structural refactoring gave us a good speedup: +19–22% on dot product, +44–51% on Euclidean distance (all details and complete numbers can be found in the linked PR).
One step back for the perfect landing
Not every optimization survives. After all the work to introduce unroll_dim, benchmarking showed that it didn’t help uniformly: For some kernels and access patterns, the extra register pressure and code complexity brought nothing measurable. We could have left it in place with unroll_dim=1 (functionally a no-op), but dead scaffolding is technical debt that makes the next change harder to reason about. So we removed it where it didn’t pay for itself, keeping the code clean.
On a tightrope, sometimes the right move is a step back.
Key takeaways: optimizing vector search low-level memory access
Every optimization in this post followed the same pattern: Solve one bottleneck, reveal the next. Cascade unrolling saturated the FMA ports, which exposed memory latency. Batching and prefetch hid that latency, which uncovered L1d set aliasing. Dim-axis unrolling sidestepped the aliasing, which uncovered redundant query work. And removing that redundancy finally let the whole pipeline breathe.
There’s no single optimization that makes simdvec kernels fast. Each improvement changes the bottleneck rather than eliminating it, and each step can expose new unanticipated constraints. At this level, memory abstractions are an illusion: Performance depends on understanding what the CPU is actually doing, not just what the model suggests. The only way forward is to measure, understand, and rebalance.
| Optimization | Gain |
|---|---|
| Cascade unrolling (vs. #pragma unroll) | +11-13% |
| Batching / prefetching (int7) | +20-50% |
| Head + spread prefetch | Up to +30% |
| Dim-axis unrolling (dot product) | +35-65% |
| Query load hoisting (dot product) | +19-22% |
| Query load hoisting (Euclidean distance) | +44-51% |
This is the first in a series of deep dives into Elasticsearch simdvec. Next time, we’ll look at how algebraic rewrites let us sidestep CPU limitations entirely.
Pour aller plus loin
16 juillet 2026
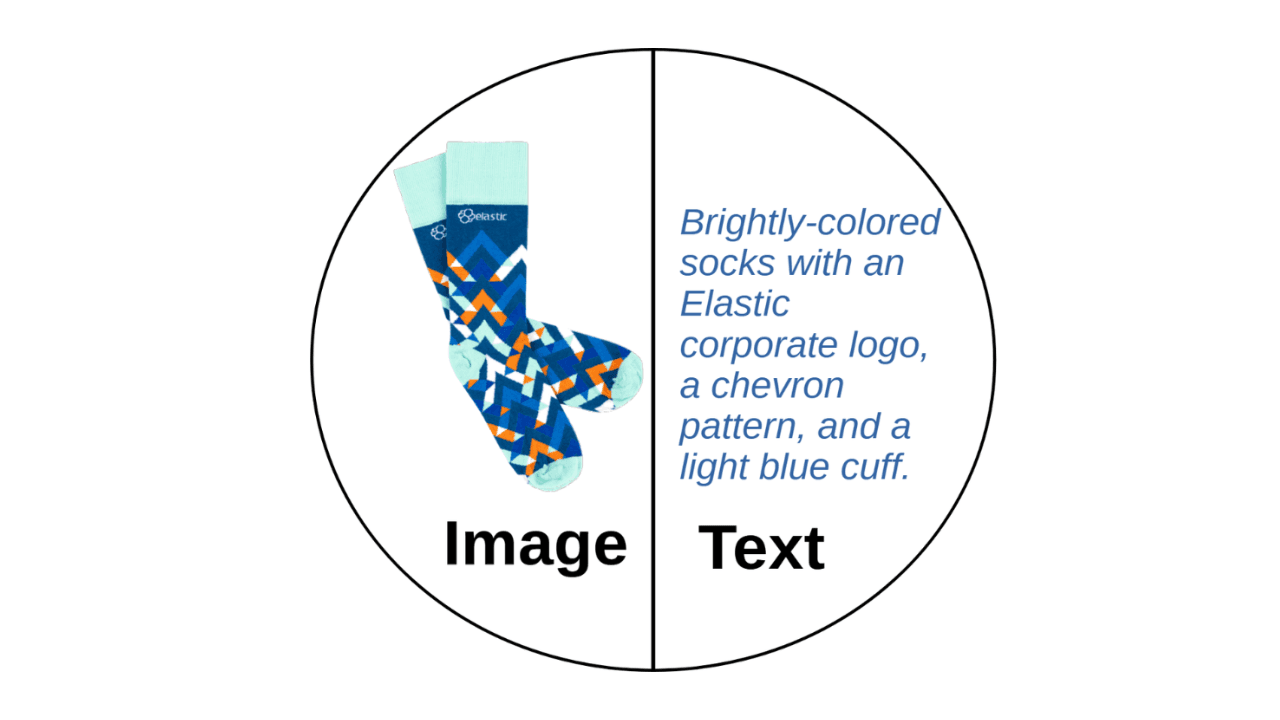
A picture is worth 1.5x the words: What we learned benchmarking product search embeddings
We benchmarked two embedding models on 5,000 real products and found that combining image and text beats either alone by up to 50%. Here's the data and the model that won.

13 juillet 2026
The disk that never woke up: what actually decided our Qdrant vector search benchmark rematch
On the same hardware, Elasticsearch and Qdrant land in the same range at 56 QPS. The io_uring disk scorer and memory claims turned out to be the two things that mattered least.
10 juillet 2026
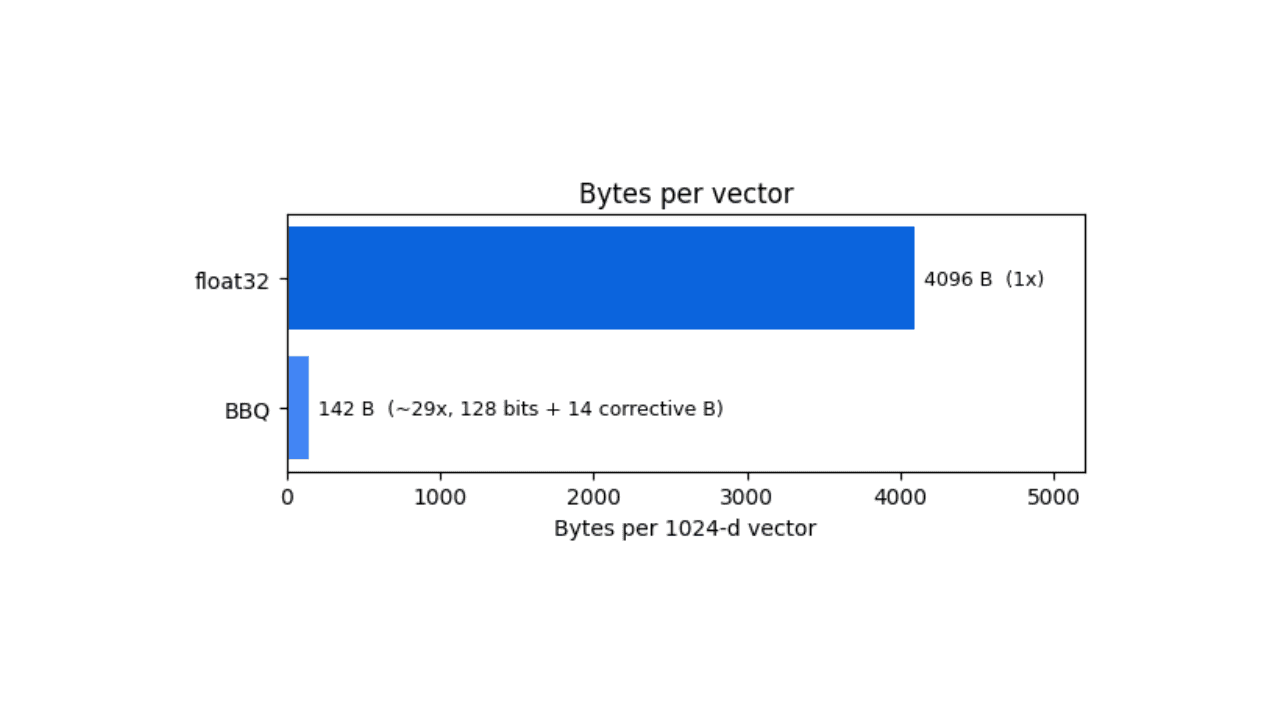
How BBQ shrinks Jina v5 embeddings by 29x without losing recall in Elasticsearch
A hands-on test comparing BBQ and float32 vector indices in Elasticsearch, measuring memory, disk and recall@10 across five languages.

9 juillet 2026
Why Elasticsearch is becoming a columnar database
Elasticsearch is becoming a first-class columnar database. Columnar Mode ships in 9.5, storing data once alongside the existing modes and cutting storage footprints while speeding up analytical queries.
7 juillet 2026
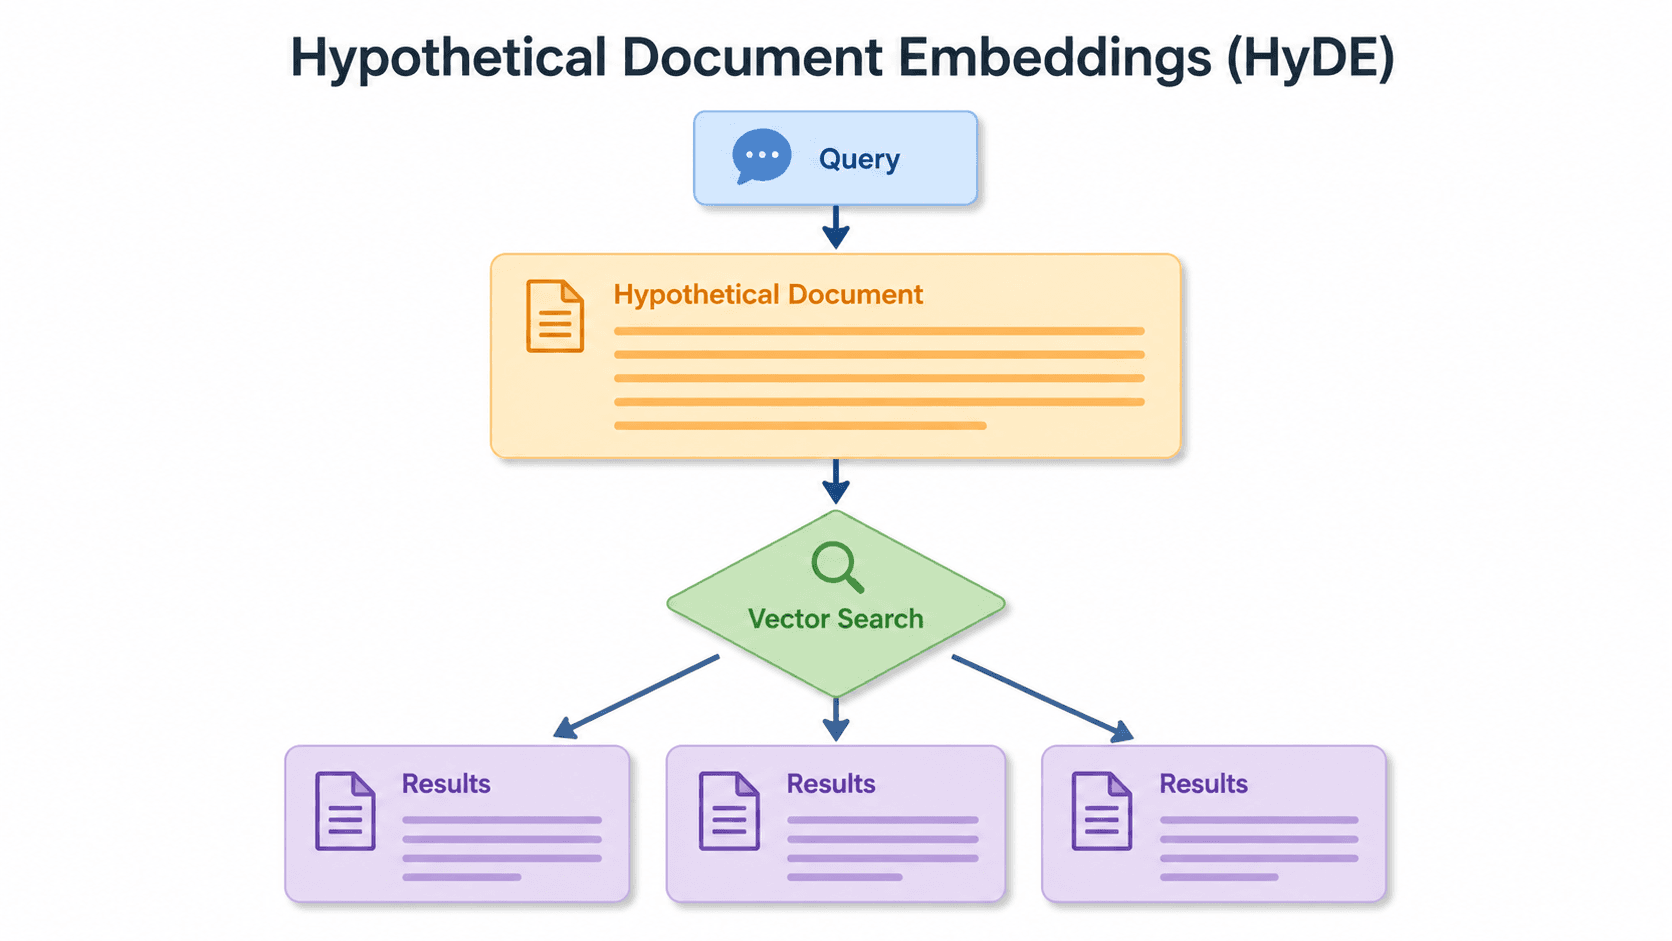
Short queries, formal documents: how HyDE improved semantic search precision by 50% in Elasticsearch
HyDE boosts semantic search precision and recall by 50% on short queries. Here's how to implement it in Elasticsearch with the Inference API and semantic_text.