Test Elastic's leading-edge, out-of-the-box capabilities. Dive into our sample notebooks in the Elasticsearch Labs repo, start a free cloud trial, or try Elastic on your local machine now.
Query activity in Kibana gives you a live list of in-flight search tasks in Elasticsearch (ES|QL, DSL, SQL, EQL), so in about a minute you can move from “something’s slow” to which query, how long it’s been running, and whether you can cancel it. It builds on the Tasks Management API, but it’s the operational view you can show in a war room. If you’re on Elastic Cloud Serverless, it’s available now; on Elastic Cloud Hosted and self-managed, it ships with Kibana 9.4.
When “something is slow” finally has an answer
Query activity is already available in your Elastic Cloud Serverless project today. For Elastic Cloud Hosted and Elastic Self-Managed clusters, it ships with Kibana 9.4 and is available across all deployments and clusters on that version. Query activity is the Kibana view on top of the Tasks Management API in Elasticsearch. It’s purpose-built for search-related tasks in any query language, including Elasticsearch Query Language (ES|QL), DSL, SQL, and Event Query Language (EQL).
It always starts the same way. Someone pings you on a Friday: Discover feels stuck. The exec dashboard won’t load. Did we change something? You open your monitoring tabs, squint at CPU, maybe tail a log, and you’re still guessing. Is it one giant ES|QL pipeline? A dashboard nobody remembers? A background rule doing honest work at the worst possible time? The cluster isn’t mysterious on purpose. In-flight work is simply invisible unless you enjoy living in Dev Tools and reconstructing life stories from task IDs and snippets of JSON.
We built Query activity for everyone who has ever muttered, Just tell me what’s running. It’s a new screen in Kibana that lists active search work in ES|QL, DSL, SQL, or EQL. It shows the queries that are consuming your cluster right now, with enough context to move from panic to diagnosis without a scavenger hunt.

The play you know and the one-minute rewrite
If you’ve operated Elasticsearch for more than a week, you’ve lived the old script. In Act I, someone says the cluster feels slow. In Act II, you scatter across shards, heap, slow logs, and sticky-note task IDs. Hours pass, and you still cannot name the query. In Act III, maybe you find the culprit before dinner, or maybe next month Act I opens again with the same villain in a fake mustache.
Query activity replaces that meandering Act II with one default sequence. It’s the same story, compressed from symptom to evidence to origin to action in about a minute. Paste this into your runbook or send it to your on-call channel. It’s the whole innovation in practice.
1. Open Query activity as soon as Act I hits. On Elastic Cloud Hosted and Elastic Self-Managed clusters, go to Stack Management and then Cluster performance. On Elastic Cloud Serverless, go to Admin and Settings and then Project performance. Do this before you fork into guesswork.
2. Refresh the list of queries once so you’re looking at right now, not five minutes ago.
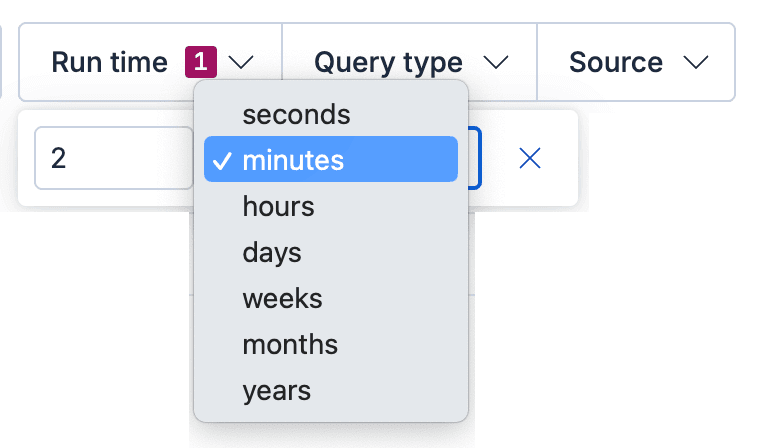
3. Surface the pressure. Sort by run time, or tighten the “Run time” filter, until the expensive work floats to the top.
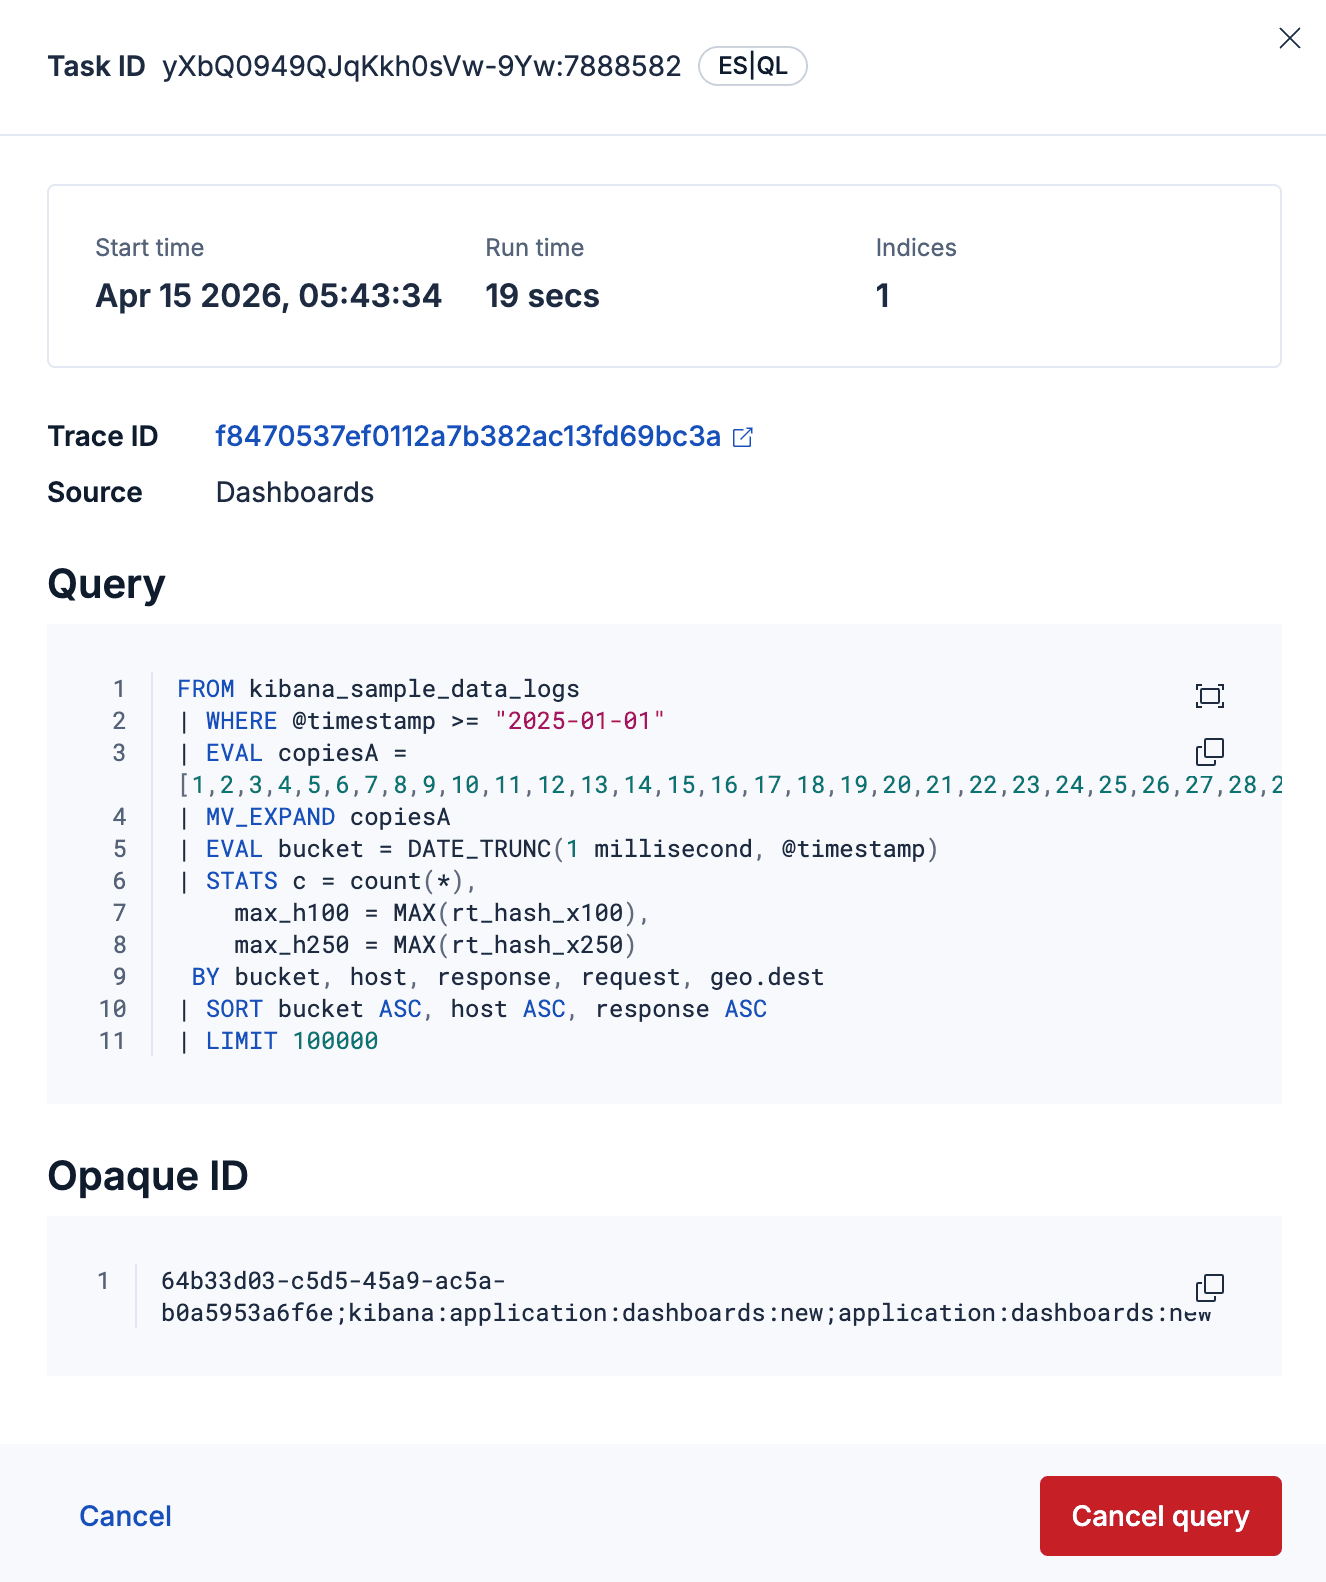
4. Open the flyout on the worst offender. You’ll see duration, query type, index breadth, and full query text. That’s your evidence without opening Dev Tools.
5. Name the owner. Use trace.id to jump into Discover and filter on the audit or query logs for that trace, or use X-Opaque-Id to figure out which dashboard, saved search, or rule this query originates from.
6. Resolve Act III. Let the query finish, fix the upstream, or cancel when it’s appropriate and Elasticsearch says the task is cancelable.
That’s one pass through what used to be three acts. You get attribution instead of folklore and decisions instead of theater.
Query activity deep dive
The one-minute sequence above is the habit. What follows is the machinery: the concrete controls and signals in Kibana that make that rewrite possible. You get what’s executing, how long it’s been running, where it came from, and what to do next, without stitching clues across tabs.
Under the hood, this view is powered by Elasticsearch’s Tasks Management API for long-running search tasks. It’s translated into an operational UI that’s built for speed. You can find the outlier quickly, inspect rich details, and act with confidence.
Here’s how the UI backs each beat of the runbook.
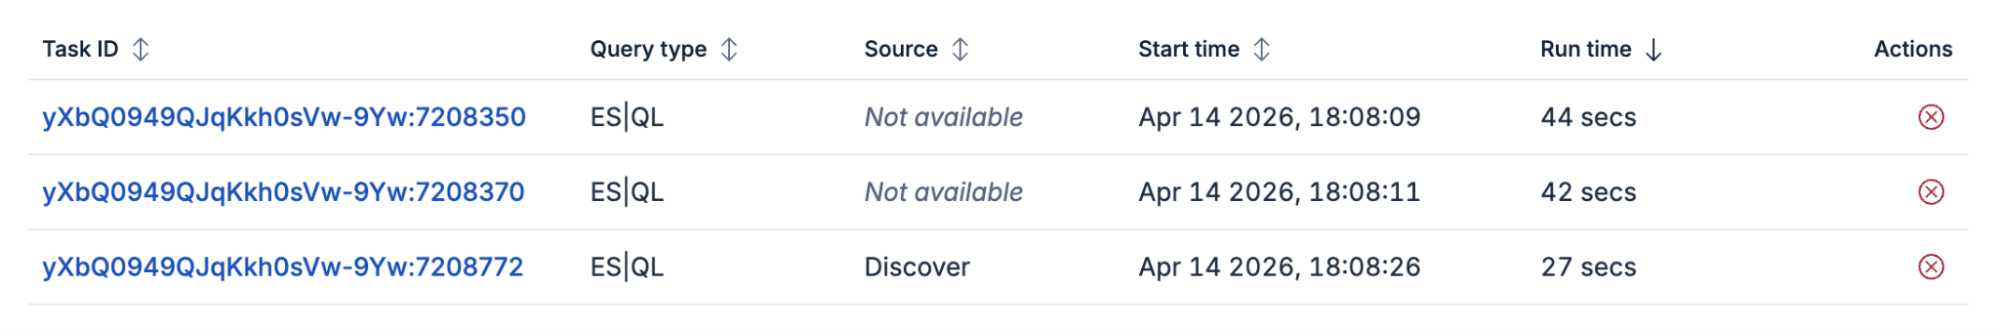
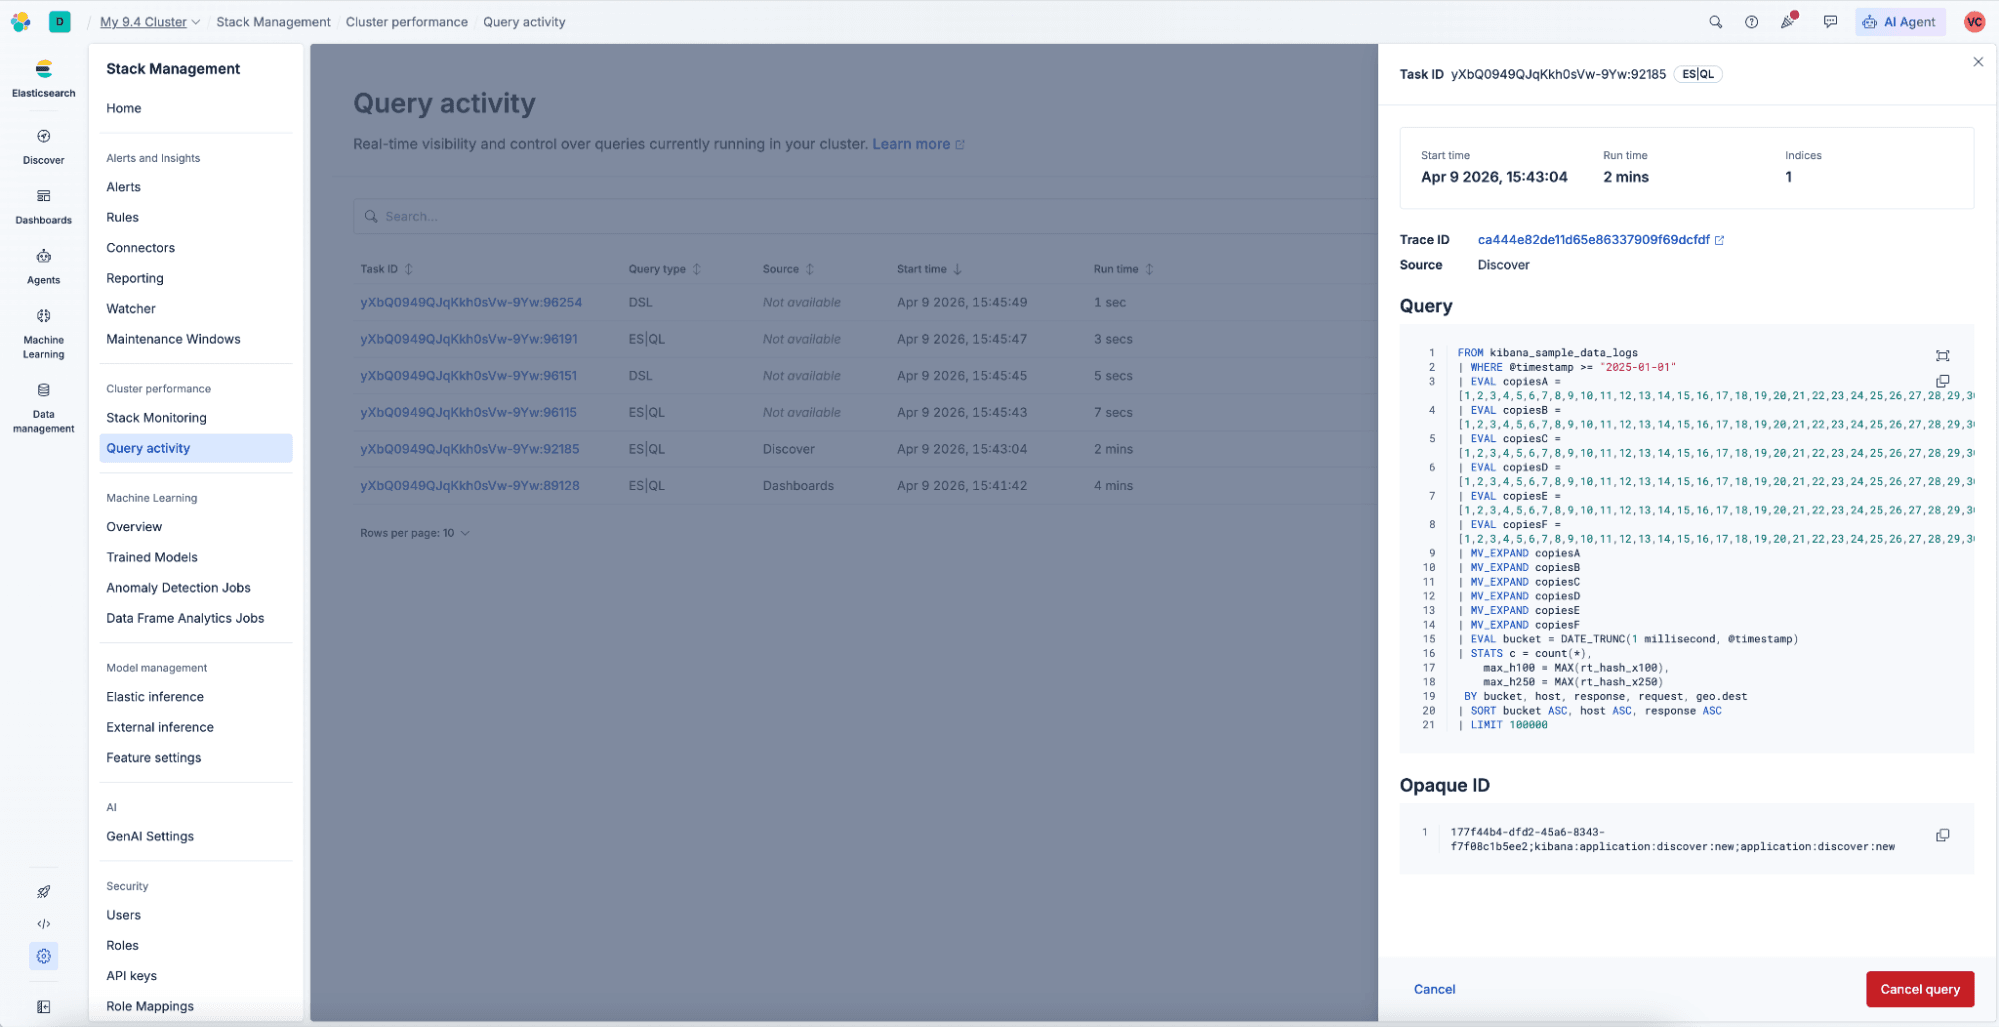
The main view is a filterable list of running queries. It includes a search bar so you can match anything in the table, including task ID. You also get filters for run time, query language, and source (for example Discover, Dashboard, and similar surfaces). You stay in control of what “noisy” means.
Refresh is manual on purpose. The table does not auto-refresh. You click Refresh when you’re ready, and the UI shows when the last refresh happened. You shouldn’t have to wonder whether the list is stale.
When you click a task ID, a detail flyout opens. It shows start time, run time, how many indices the query touches, and full query text. When X-Opaque-Id is present, it can help you trace an Elasticsearch query to its origin in Kibana so you can turn “mystery load” into “that dashboard, that version.” Previous and next navigation let you walk the queue without jumping back to the list. When trace.id is available, you can open Discover with that trace prefiltered. That helps when the incident channel is already busy.
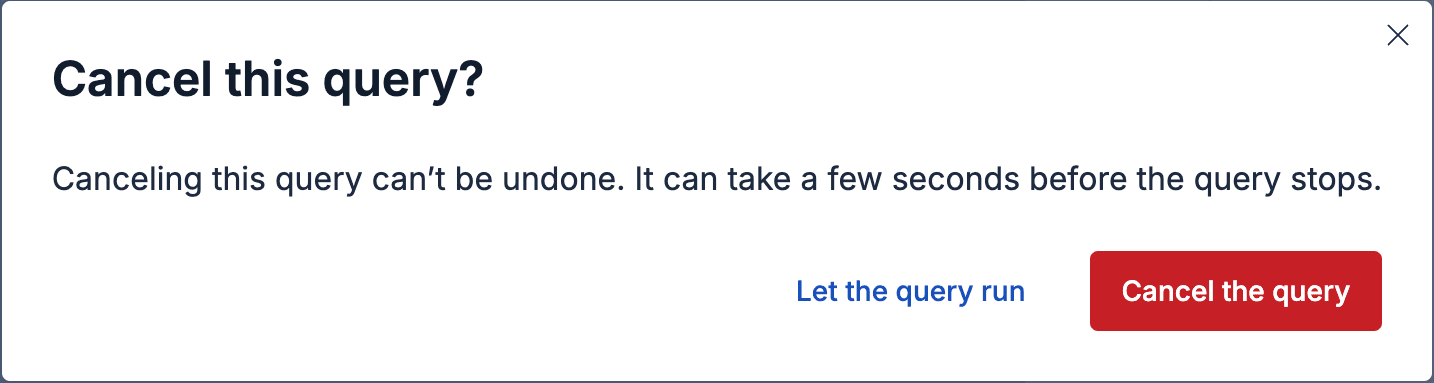
Where work is cancelable, you can request cancellation from the list or the flyout. There’s a deliberate confirmation step. After you confirm, the cancel control shows a spinner until Elasticsearch reports that the task actually stopped. The goal is oops-proof, not oops-fast.
Viewing and managing active query work requires appropriate cluster privileges. The UI states clearly when something is missing. For example, users without cluster:manage may not be able to take destructive actions. Users without cluster:monitoring may not see task details. You shouldn’t get a blank screen that feels like the stack is playing hide-and-seek.
If you’ve been following our broader story around query observability, this is the live side of the house. It’s what is happening now, in the product, with controls you can use. Over time, pair it with historical views, such as query logs and AutoOps long-running search tasks insights when you need to ask whether this has happened before. When you need to answer what’s eating your cluster in this minute, start with the new Query activity UI in Kibana.
Who this is for (and who becomes the hero)
Cluster and platform admins get the obvious win: faster incident response and less time translating APIs into narratives for stakeholders.
Centers of excellence and internal search champions get something equally valuable: a teachable moment you can screenshot. This is the query pattern that blew up shared capacity. This is what “interactive” versus “background” pressure looks like when everyone is busy.
Anyone on the hook for Service Level Agreements (SLAs) gets a cleaner bridge between user experience (“the app is slow”) and search reality (“these three requests are still running, and one of them is huge”).
You don’t have to be the person who wrote the query to be the person who explains the cluster calmly. That’s the whole point.
Not every task is cancelable, and deep tuning work still has its place. Query activity doesn’t fix your queries for you. It surfaces in seconds which ones might need attention, and it gives you faster evidence, clearer attribution, and better decisions before you reach for heavier tools.
Where to find it
You’ll find Query activity in the performance area of each deployment model. In Elastic Cloud Hosted and Elastic Self-Managed clusters, open Stack Management and then Cluster performance. In Serverless projects, open Admin and Settings and then Project performance.
Threshold hygiene: Open Stack Management and then Advanced Settings. The running_queries:minRunningTime setting defaults to 100 ms. Only tasks that have been running longer than that appear. That way you can dial through noise without drowning in instantaneous work.
What to do next
Walk through the six-step sequence once when the cluster is calm. When Act I hits, you won’t be learning a new UI under pressure. Then repeat it during the next slow moment. The gap between assuming and seeing is the whole product story.
If you aren’t on Elastic Cloud yet, you can still get hands-on with the stack at elastic.cloud/registration.
相关内容

2026年7月9日
Why Elasticsearch is becoming a columnar database
Elasticsearch is becoming a first-class columnar database. Columnar Mode ships in 9.5, storing data once alongside the existing modes and cutting storage footprints while speeding up analytical queries.

2026年7月7日
Your compliance posture just got an upgrade: Elasticsearch now supports FIPS 140-3
Elastic 9.4 brings FIPS 140-3 support for Elasticsearch and Kibana to GA. Here's what changes for federal, defense and regulated deployments, and how to migrate from 140-2.

2026年7月2日
A simdvec deep-dive: How Elasticsearch uses neural-net and video-codec CPU instructions for vector search
Four ways Elasticsearch's vector search engine reuses neural-network, video-codec and cryptography CPU instructions for up to 6x speedups; with the math, the failed attempts and the benchmarks.

2026年6月29日
Bringing it together: How we rebuilt Elasticsearch as a columnar metrics engine; 6.6x less storage, 160x faster queries
Elasticsearch metrics in version 9.4 run on a fully columnar engine: 6.6x less storage, 160x faster queries, native PromQL and OTel support.

2026年6月11日
How Elasticsearch cut metrics storage by 41% by dropping sequence numbers after replication
Find out how Elasticsearch trims sequence numbers at merge time to cut TSDS storage by 41%, what you give up, and why it's safe for metrics workloads.