Introducing the Elastic Stack ArcSight Integration
Introduction
If you've been following our engineering blogs for the past 9 months or so (see Editor's note at the end for links), you'll recall that we've posted a half dozen examples of how to use the Elastic Stack to augment the ArcSight SIEM by taking a copy of the ArcSight CEF-formatted event data stream, ingesting it into the Elastic Stack, and then searching, analyzing, visualizing, and alerting on these events using various Elastic products and features.
We've had such a good response to the blog series, that we decided to make the integration even better and easier to get started. Today, we are very excited to introduce the Logstash ArcSight module that simplifies the Elastic Stack ArcSight integration down to one command. Run one command and start exploring your ArcSight events in Kibana in literally minutes.
Before we dig into the details of this new Logstash module, let's take a look at why this integration with ArcSight makes sense.
Security Analytics is a Growing Use Case for the Elastic Stack
The security threat landscape has fundamentally changed in the past 5 years. While traditional methods usually involved searching for known bad activity in their log data, today's analysts often need to interactively investigate wherever the data leads them in real time. Additionally, the volumes of security-relevant log data that used to be measured in TB per day are now growing to PB per day. Depending on their specific role, security teams may need tools and platforms optimized for their particular workloads. Factors affecting platform requirements include:
- Security Mission - Interactive threat hunting vs. continuous threat monitoring
- Retention Timeframe: Short-term vs. long-term
- Incident Response Workflow - Native Integrated vs. downstream integration
- Tactical - Known bad detection vs. anomaly detection
Necessarily, there is not a one-size-fits-all solution for log-based security analytics.
Driven by these factors, security analytics has become one of the fastest growing use cases for the Elastic Stack. The Elastic Stack is integrated in popular open-source security projects like SOF-ELK, Security Onion, and Rock-NSM, and is featured in SANS security training courses. The recent introduction of machine learning capabilities to the Elastic Stack (via X-Pack) are enabling even more automated detection of attack behaviors for security analysts, as described in this deep dive blog post.
Good Security Analytics Requires "Good Data"
Security operations teams have learned over the years that their ability to detect threats and respond to cyber incidents depends upon having "good data" to monitor and analyze. Good data means that the security events generated by systems and devices have been normalized into a common format with common field names, and filtered so that visualization, correlation, and alerting can be implemented efficiently across multiple data sources.
Easier said than done! Collecting "good" security data is hard. In fact, in an April 2017 post, security industry analyst Anton Chuvakin cites "dirty data" and "trouble with collecting data" as top reasons for failure in security analytics or security data lake initiatives. He comments on the difficulty of the data collection problem, noting that SIEM vendors have spent 10+ years debugging and innovating their "data collectors" for a reason.
Users of the Elastic Stack already address the "good data" challenge with Beats, our suite of specialized open source data shippers. They install as lightweight agents and send data from hundreds or thousands of machines to Logstash or Elasticsearch.
We wanted to make it easy for ArcSight customers who have deployed a security event collection layer using ArcSight Smart Connectors (ArcSight supports connectors for 350-400 devices/systems) to get their security event data into the Elastic Stack to enable new ways to search, analyze, and visualize their data.
Last year, ArcSight introduced the ArcSight Data Platform (ADP) which embraces an open architecture and lets ArcSight users send their CEF-formatted security event data to a variety of destinations beyond the ArcSight Logger and ESM SIEM products. The ADP also added a queuing system, called the ArcSight Event Broker, which provides a mechanism for multiple systems to pull security event data from the same queue, therefore enabling a "collect once, use everywhere" paradigm.
Our new Logstash ArcSight module makes this integration easy, whether users are using Smart Connectors or the Event Broker, to enjoy powerful downstream capabilities of real-time search, analytics, visualizations, and advanced security analytics with the Elastic Stack.
The Elastic Stack ArcSight Integration
OK, now that we understand the motivation behind this integration, let's dig into the details. As we've mentioned, the Elastic Stack ArcSight Integration enables ArcSight users to send a copy of their normalized security event data to the Elastic Stack for data exploration and analysis with Kibana visualizations and dashboards.
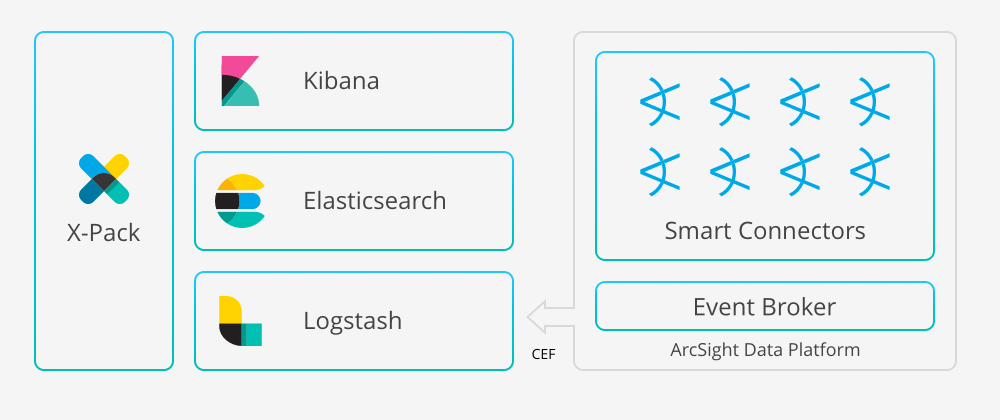
The new Elastic product feature is called the Logstash ArcSight module. The module includes a Logstash configuration for ingesting and enriching CEF-formatted data from either Smart Connectors or the ADP Event Broker, while bundling a set of Kibana dashboards to view events from common sources. Oh, and it all installs with just one Logstash command.

Available starting with the Logstash 5.6 release, the module taps directly into the ArcSight data stream, parses and indexes the security events into Elasticsearch, and installs a set of Kibana dashboards to get you immediately exploring your network, firewall, endpoint, and Windows DNS datasets. ArcSight customers will be able to use the Logstash module to feed their data into the Elastic Stack and start exploring it within minutes.
Free to Use and Easy to Upgrade
The Logstash ArcSight module is free to use. Use of this module requires the installation of X-Pack and a free Basic license from Elastic. Plus, users have the option to upgrade their Elastic deployment with a subscription that includes additional powerful features like security controls, alerting, monitoring, reporting, graph analytics, and machine learning. (Please note that X-Pack features are only available from Elastic).
We're excited about this integration and our technology partnership with the ArcSight folks, but it's important to realize what this partnership is not. On the commercial side, neither Micro Focus nor Elastic will sell or distribute each other's products or services. From a technology perspective, customers will be responsible for their integration.
Security analytics with Elastic Stack and ArcSight together offers the best of both worlds. See more, act faster, secure it all. Check out the Logstash ArcSight module documentation to get started!
For more information:
- Check out the new Elastic Stack ArcSight integration page
- More details on the Logstash product
- Register for our upcoming webinar on the topic
- This integration listed on the ArcSight Marketplace
- Learn more about Micro Focus on Elastic's technology partner page
- Read our press release
If you prefer email, just drop us a line at arcsight@elastic.co
Editor's Note: Be sure to check out this related 6-part blog series. Part 1 kicks off the series with getting started content. Part 2 continues the story with how to proactively monitor security data in Elasticsearch using X-Pack. Part 3 walks you through how to scale the architecture. Part 4 and Part 5 provide examples of setting up alerts for common security threats using the alerting features in X-Pack. Part 6 extends the alerting story with automated anomaly detection using X-Pack machine learning.