Logstash ArcSight Module
editLogstash ArcSight Module
editThe Logstash ArcSight module is an X-Pack feature under the Basic License and is therefore free to use. Please contact arcsight@elastic.co for questions or more information.
The Logstash ArcSight module enables you to easily integrate your ArcSight data with the Elastic Stack. With a single command, the module taps directly into the ArcSight Smart Connector or the Event Broker, parses and indexes the security events into Elasticsearch, and installs a suite of Kibana dashboards to get you exploring your data immediately.
Deployment Architecture
editThe Logstash ArcSight module understands CEF (Common Event Format), and can accept, enrich, and index these events for analysis on the Elastic Stack. ADP contains two core data collection components for data streaming:
- The Smart Connectors (SC) are edge log collectors that parse and normalize data to CEF prior to publishing to the Logstash receiver.
- The Event Broker (EB) is the central hub for incoming data and is based on open source Apache Kafka. The Logstash ArcSight module can consume directly from EB topics.
Getting Started With The Smart Connector
editTo get started, you can use a basic Elastic Stack setup that reads events from the Smart Connector directly.

Requirements
edit- These instructions assume you have part of the Elastic Stack (Logstash, Elasticsearch, Kibana) already installed. The products you need are available to download and easy to install. The Elastic Stack 5.6 or higher is required for this module.
- The Elastic Stack is running locally with default ports exposed, namely Elasticsearch as "localhost:9200" and Kibana as "localhost:5601". Note that you can also run Elasticsearch, Kibana and Logstash on separate hosts to consume data from ArcSight.
-
Smart Connector has been configured to publish ArcSight data (to TCP port
5000) using the CEF syslog destination.
Instructions
edit- Install X-Pack on Elasticsearch and then start Elasticsearch.
- Install X-Pack on Kibana and then start Kibana.
- Install X-Pack on Logstash, which includes the Logstash ArcSight module.
-
Start the Logstash ArcSight module by running the following command in the Logstash install directory with your respective EB host and port:
bin/logstash --modules arcsight --setup
  -M "arcsight.var.inputs=smartconnector"
  -M "arcsight.var.elasticsearch.username=elastic"
  -M "arcsight.var.elasticsearch.password=changeme"
  -M "arcsight.var.kibana.username=elastic"
  -M "arcsight.var.kibana.password=changeme"
The command in this example is formatted for readability. Remove the line breaks before running this command.
The
--modules arcsightoption spins up an ArcSight CEF-aware Logstash pipeline for ingestion. The--setupoption creates anarcsight-*index pattern in Elasticsearch and imports Kibana dashboards and visualizations. On subsequent module runs or when scaling out the Logstash deployment, the--setupoption should be omitted to avoid overwriting the existing Kibana dashboards. -
Explore your data with Kibana:
- Open browser @ http://localhost:5601 (username: "elastic"; password: "changeme")
- Open the [ArcSight] Network Overview Dashboard
- See Exploring Your Security Data for additional details on data exploration.
See Configuring the Module if you want to specify additional options that control the behavior of the ArcSight module.
Getting Started With The Event Broker
editTo get started, you can use a basic Elastic Stack setup that reads events from the EB event stream.

Requirements
edit- These instructions assume you have the Elastic Stack (Logstash, Elasticsearch, Kibana) already installed. The products you need are available to download and easy to install. The Elastic Stack 5.6 or higher is required for this module.
- The Elastic Stack is running locally with default ports exposed, namely Elasticsearch as "localhost:9200" and Kibana as "localhost:5601".
- By default, the Logstash ArcSight module consumes from the EB "eb-cef" topic. For additional EB settings, see Logstash ArcSight Module Configuration Options. Consuming from a secured EB port is not currently available.
Instructions
edit- Install X-Pack on Elasticsearch and then start Elasticsearch.
- Install X-Pack on Kibana and then start Kibana.
-
Install X-Pack on Logstash, which includes the Logstash ArcSight module. Then update the Logstash Kafka input plugin to an EB compatible version. In the Logstash install directory, run:
bin/logstash-plugin install x-pack
bin/logstash-plugin install --version 6.2.7 logstash-input-kafka
-
Start the Logstash ArcSight module by running the following command in the Logstash install directory with your respective EB host and port:
bin/logstash --modules arcsight --setup
  -M "arcsight.var.input.eventbroker.bootstrap_servers={eb_host}:{eb_port}"
  -M "arcsight.var.elasticsearch.username=elastic"
  -M "arcsight.var.elasticsearch.password=changeme"
  -M "arcsight.var.kibana.username=elastic"
  -M "arcsight.var.kibana.password=changeme"
The command in this example is formatted for readability. Remove the line breaks before running this command.
The
--modules arcsightoption spins up an ArcSight CEF-aware Logstash pipeline for ingestion. The--setupoption creates anarcsight-*index pattern in Elasticsearch and imports Kibana dashboards and visualizations. On subsequent module runs or when scaling out the Logstash deployment, the--setupoption should be omitted to avoid overwriting the existing Kibana dashboards. -
Explore your data with Kibana:
- Open browser @ http://localhost:5601 (username: "elastic"; password: "changeme")
- Open the [ArcSight] Network Overview Dashboard
- See Exploring Your Security Data for additional details on data exploration.
See Configuring the Module if you want to specify additional options that control the behavior of the ArcSight module.
Exploring Your Security Data
editOnce the Logstash ArcSight module starts receiving events, you can immediately begin using the packaged Kibana dashboards to explore and visualize your security data. The dashboards rapidly accelerate the time and effort required for security analysts and operators to gain situational and behavioral insights on network, endpoint, and DNS events flowing through the environment. You can use the dashboards as-is, or tailor them to work better with existing use cases and business requirements.
The dashboards have a navigation pane for context switching and drill downs across three core use cases:
-
Network Data
- Dashboards: Network Overview, Network Suspicious Activity
- Data Types: Network firewalls, intrusion systems, VPN devices
-
Endpoint Data
- Dashboards: Endpoint Overview, Endpoint OS Activity
- Data Types: Operating systems, applications, host intrusion systems
-
DNS Data
- Dashboards: Microsoft DNS Overview
- Data Types: Microsoft DNS devices
Example Network Dashboards
edit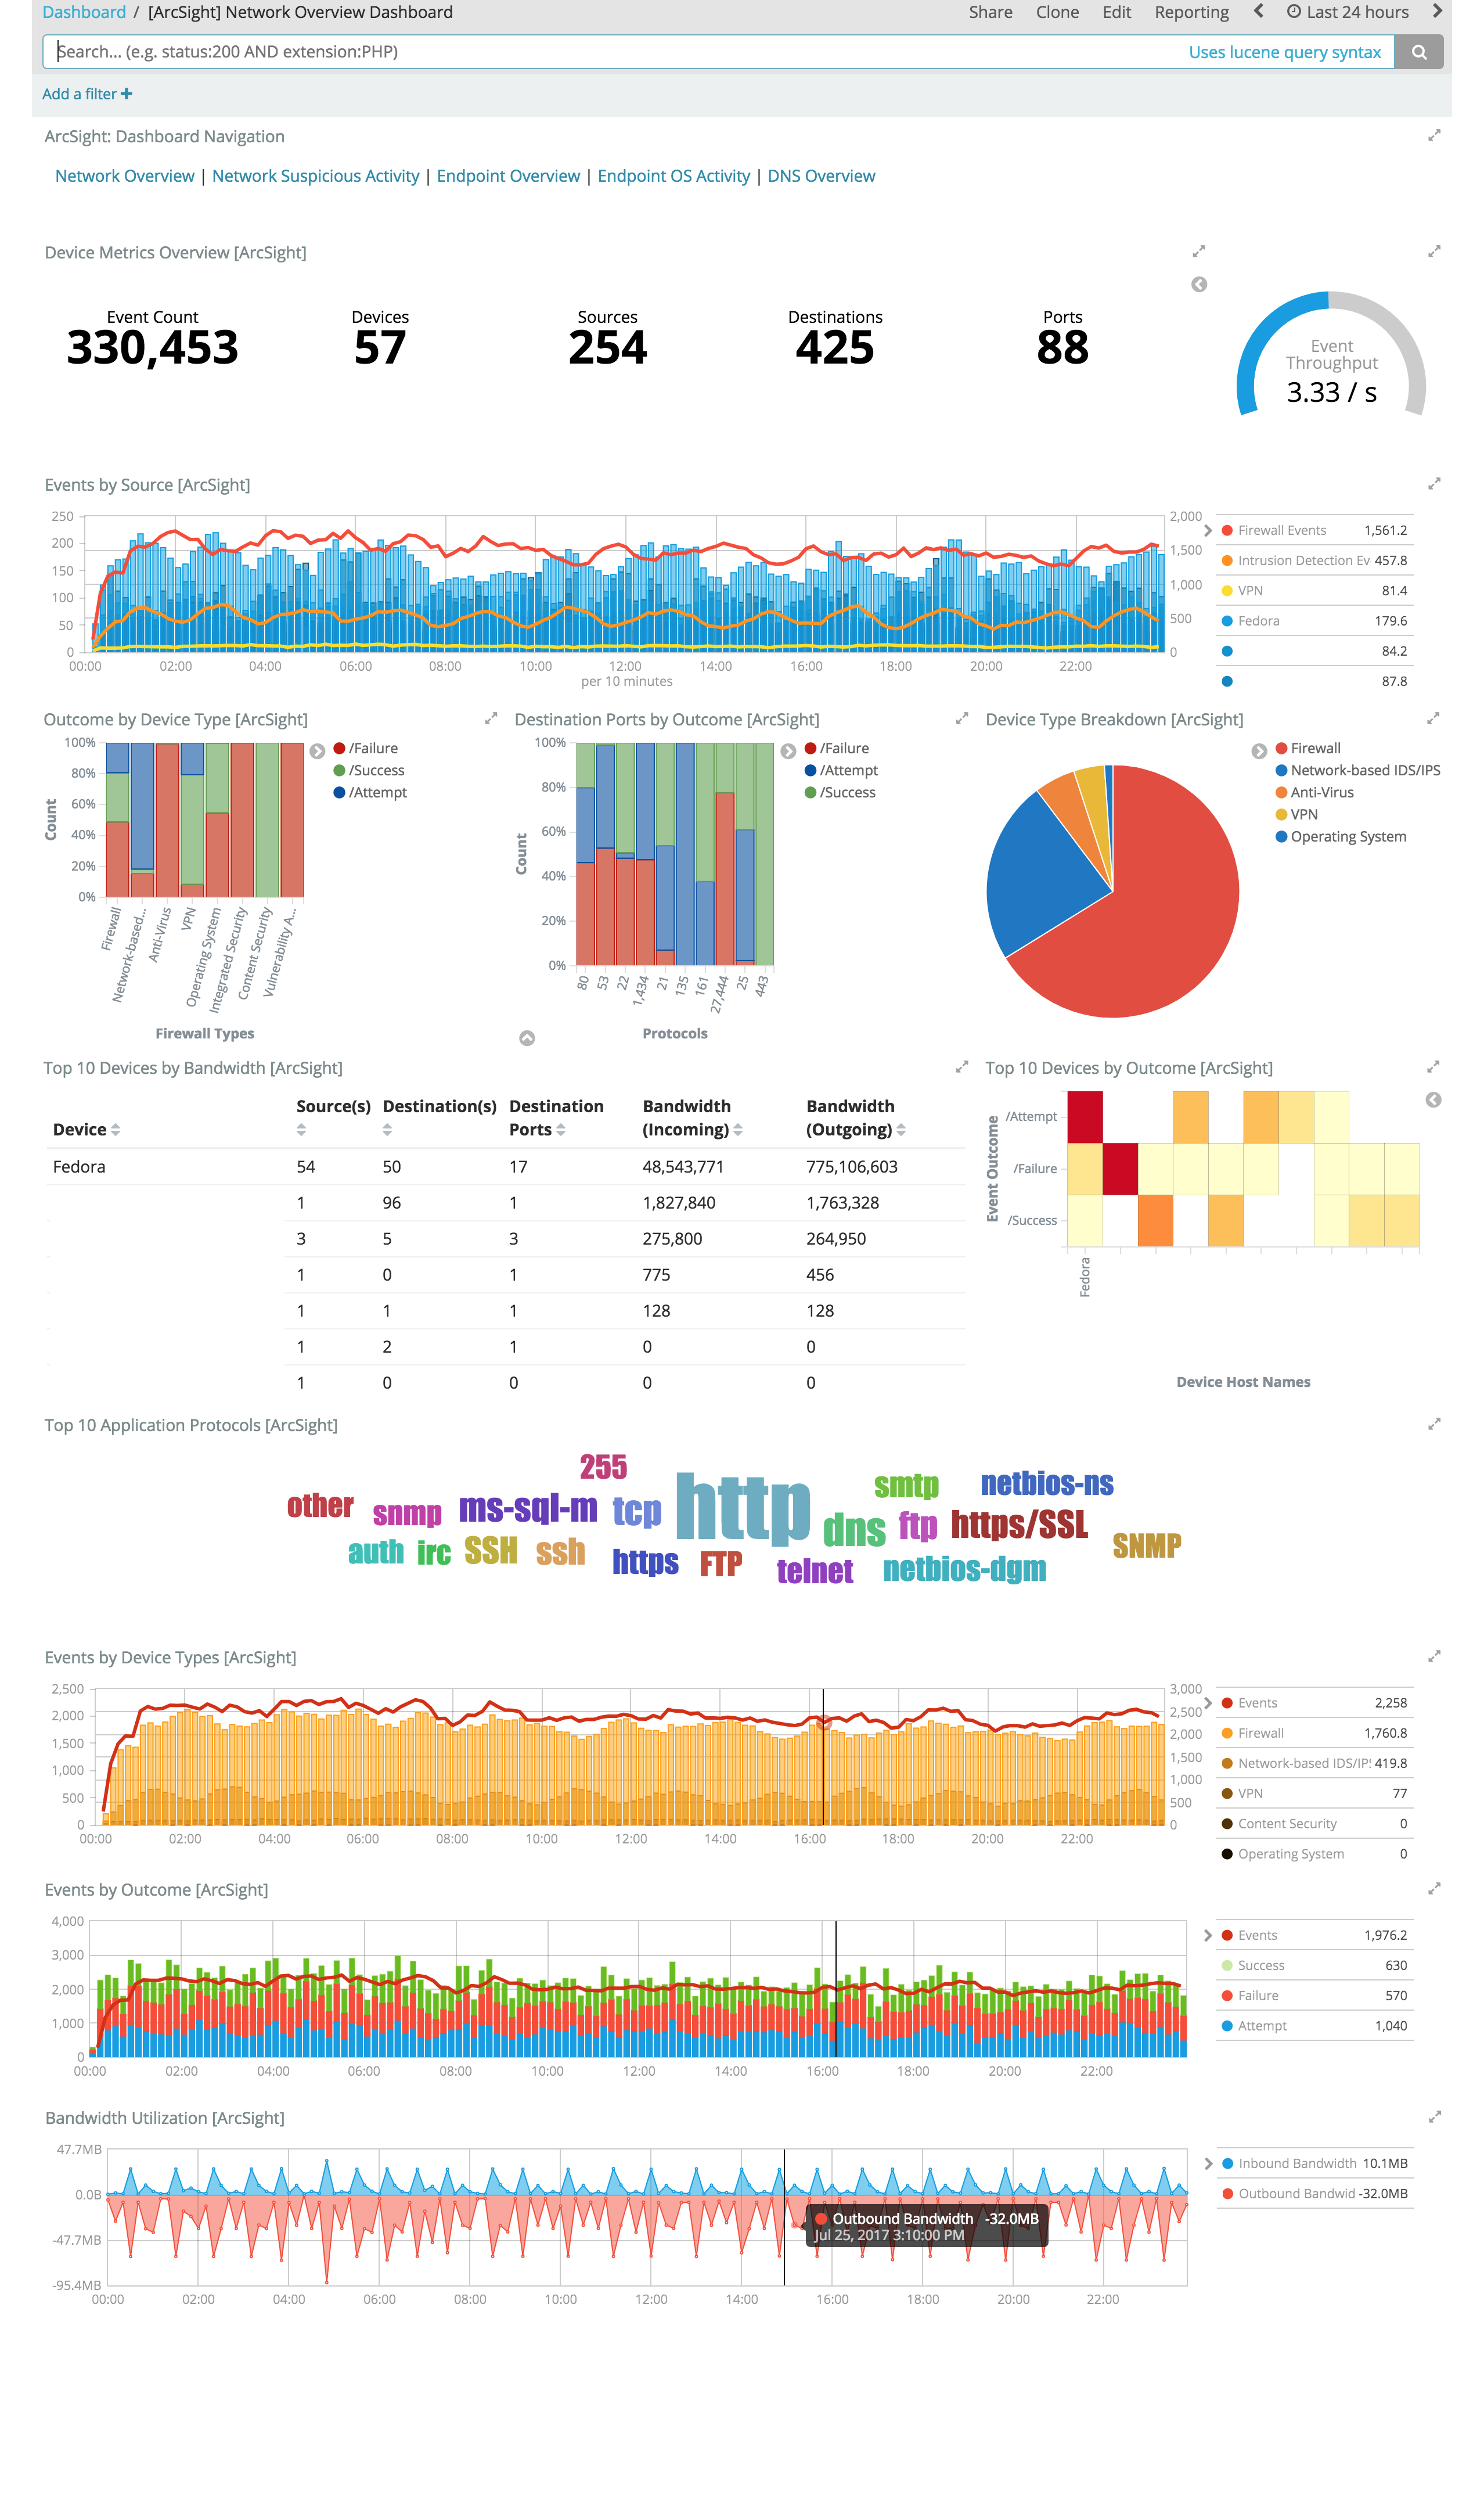
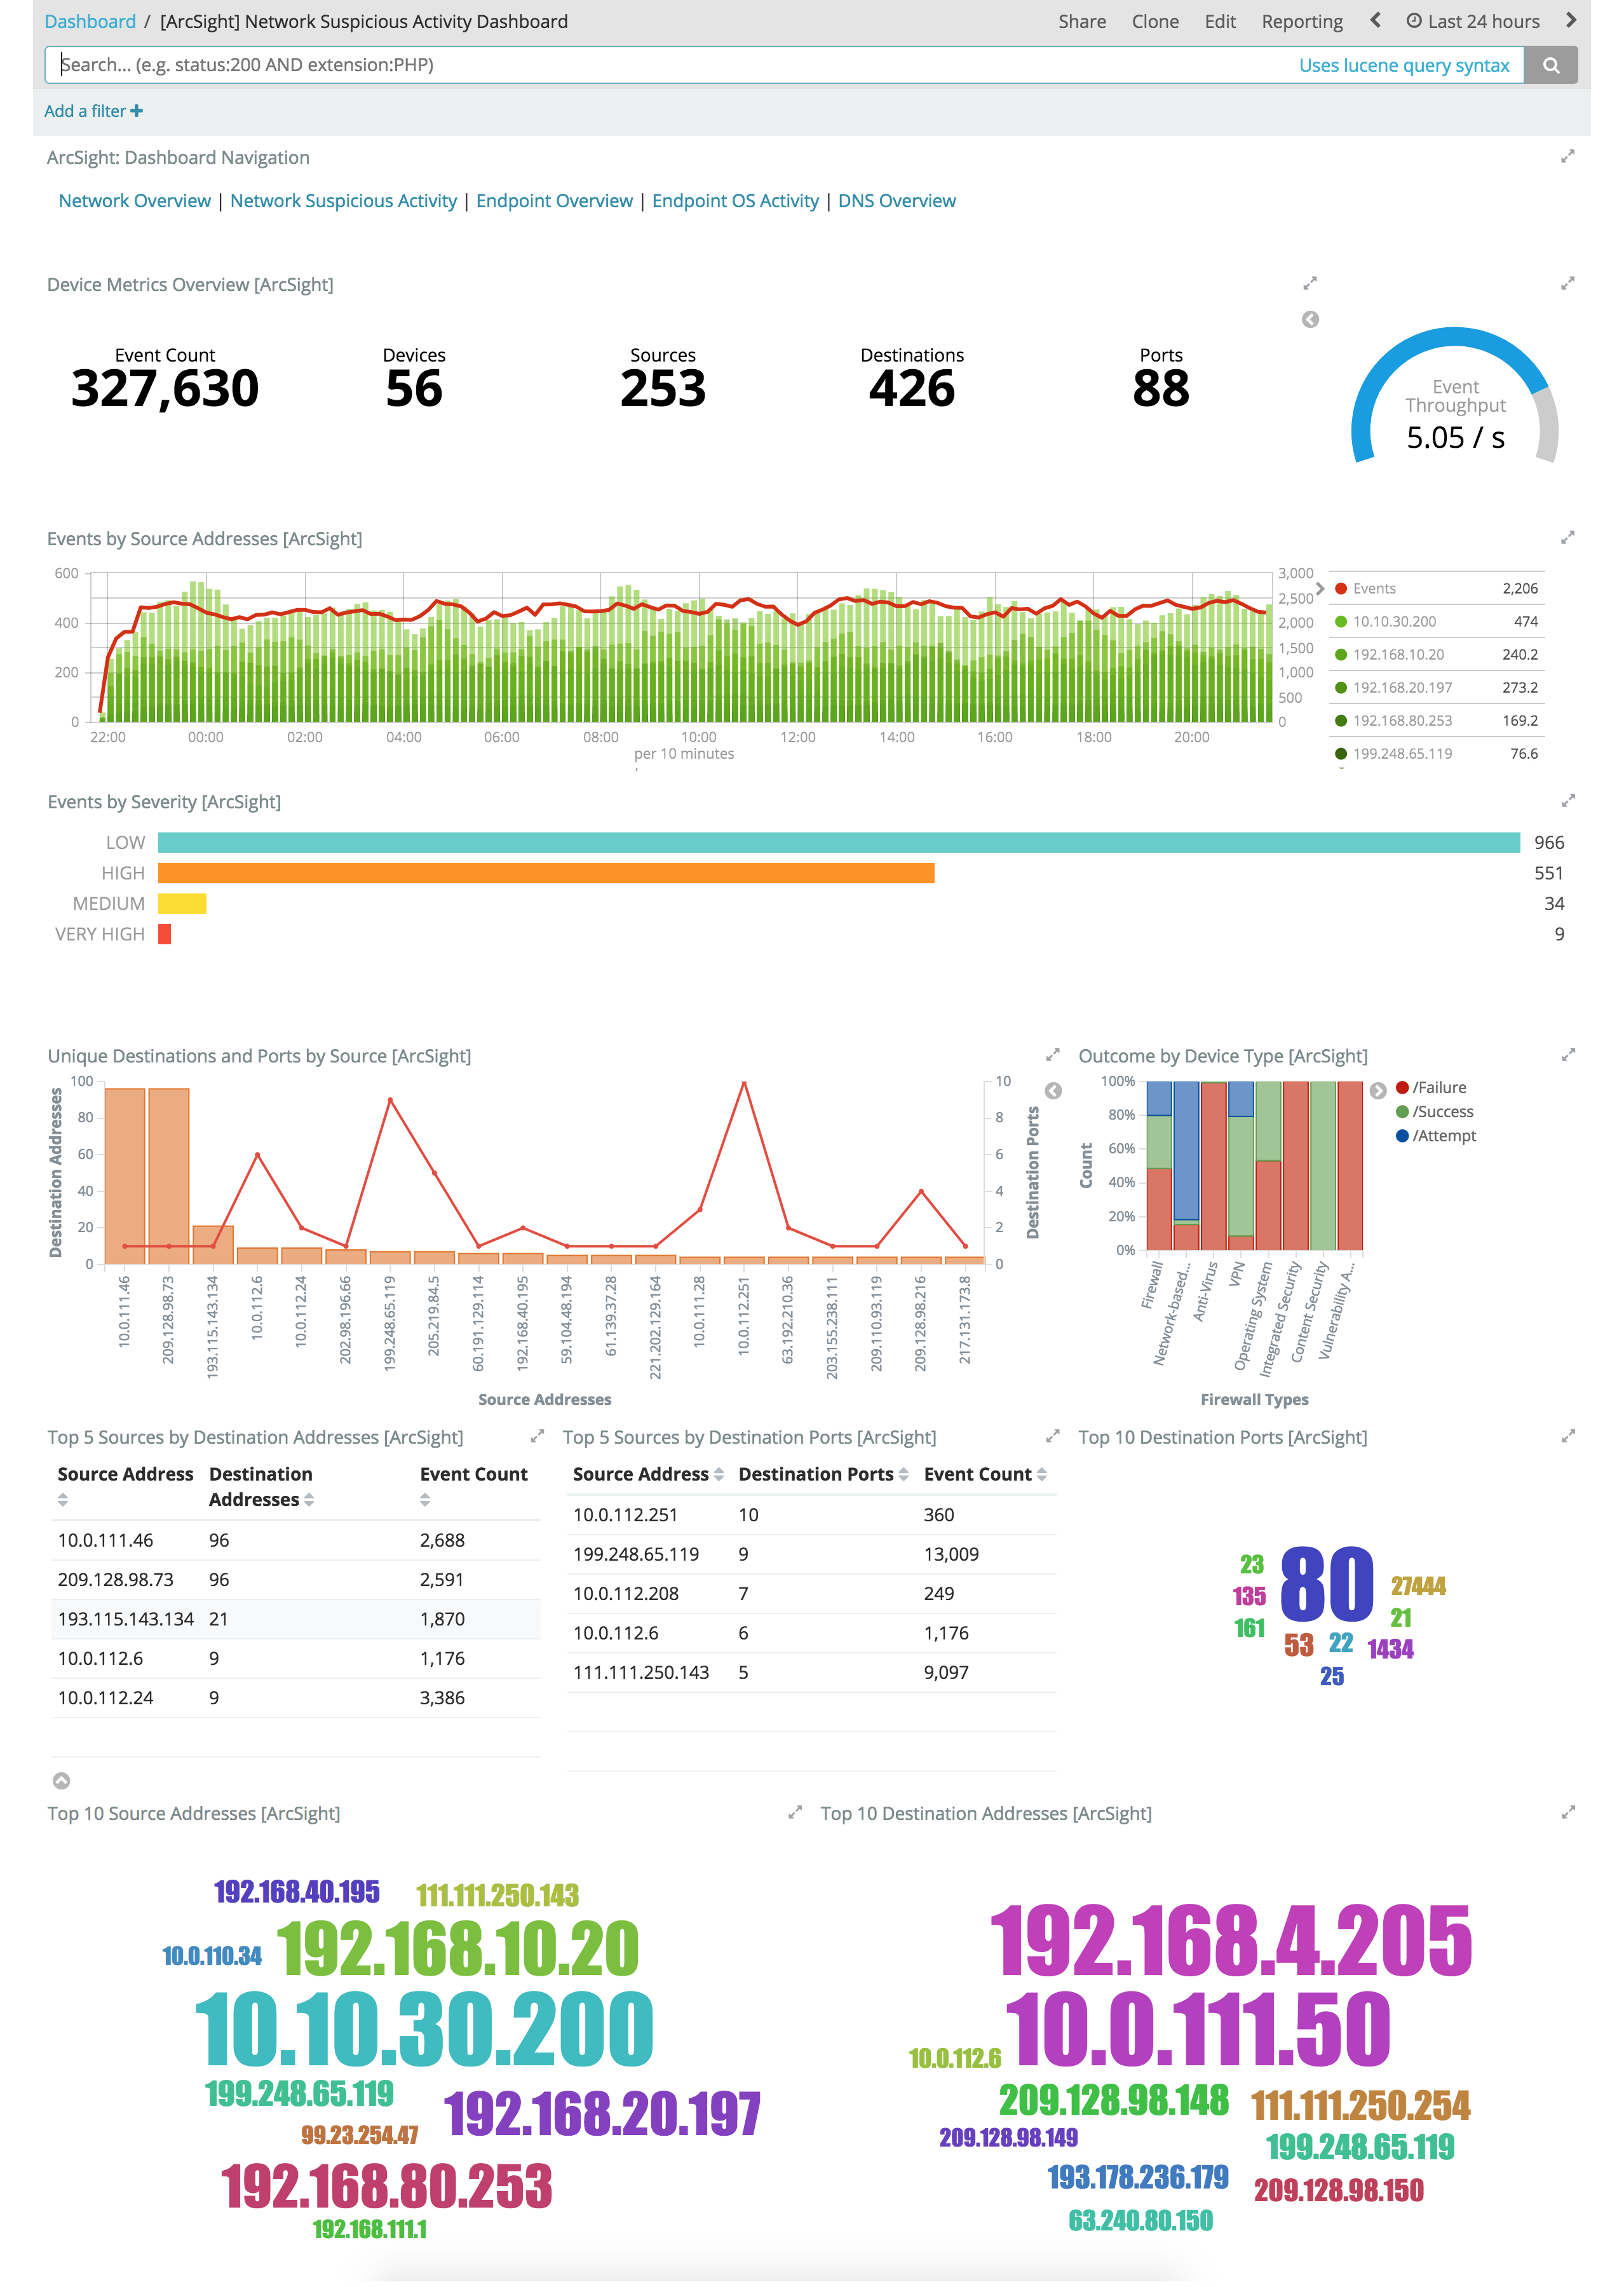
These Kibana visualizations enable you to quickly understand the top devices, endpoints, attackers, and targets. This insight, along with the ability to instantly drill down on a particular host, port, device, or time range, offers a holistic view across the entire environment to identify specific segments that may require immediate attention or action. You can easily discover answers to questions like:
- Who are my attackers and what are they targeting?
- Which of my devices or endpoints are the busiest and what services were rendered?
- How many unique attackers, techniques, signatures, or targets were triggered at any given point in time?
- What are the top sources, destinations, protocols, and behaviors that are causing the elevated count of failures?
Configuring the Module
editYou can specify additional options for the Logstash ArcSight module in the
logstash.yml configuration file or with overrides through the command line
like in the getting started. For more information about configuring modules, see
Working with Logstash Modules.
As an example, the following settings can be appended to logstash.yml to
configure your module:
modules:
  - name: arcsight
    var.input.eventbroker.bootstrap_servers: "eb_host:39092"
    var.input.eventbroker.topics: "eb_topic"
    var.elasticsearch.hosts: "localhost:9200"
    var.elasticsearch.username: "elastic"
    var.elasticsearch.password: "changeme"
    var.kibana.host: “localhost:5601”
    var.kibana.username: "elastic"
    var.kibana.password: "changeme"
Logstash ArcSight Module Configuration Options
editThe ArcSight module provides the following settings for configuring the behavior of the module. These settings include ArcSight-specific options plus common options that are supported by all Logstash modules.
When you override a setting at the command line, remember to prefix the setting
with the module name, for example, arcsight.var.inputs instead of var.inputs.
If you don’t specify configuration settings, Logstash uses the defaults.
ArcSight Module Options
-
var.inputs -
- Value type is string
- Default value is "eventbroker"
Set the input(s) to expose for the Logstash ArcSight module. Valid settings are "eventbroker", "smartconnector", or "eventbroker,smartconnector" (exposes both inputs concurrently).
-
var.input.eventbroker.bootstrap_servers -
- Value type is string
- Default value is "localhost:39092"
A list of EB URLs to use for establishing the initial connection to the cluster. This list should be in the form of
host1:port1,host2:port2. These URLs are just used for the initial connection to discover the full cluster membership (which may change dynamically), so this list need not contain the full set of servers (you may want more than one, though, in case a server is down). -
var.input.eventbroker.topics -
- Value type is array
- Default value is ["eb-cef"]
A list of EB topics to subscribe to.
-
var.input.smartconnector.port -
- Value type is number
- Default value is 5000
The TCP port to listen on when receiving data from SCs.
Common options
The following configuration options are supported by all modules:
-
var.elasticsearch.hosts -
- Value type is uri
- Default value is "localhost:9200"
Sets the host(s) of the Elasticsearch cluster. For each host, you must specify the hostname and port. For example, "myhost:9200". If given an array, Logstash will load balance requests across the hosts specified in the hosts parameter. It is important to exclude dedicated master nodes from the hosts list to prevent Logstash from sending bulk requests to the master nodes. So this parameter should only reference either data or client nodes in Elasticsearch.
Any special characters present in the URLs here MUST be URL escaped! This means # should be put in as %23 for instance.
-
var.elasticsearch.username -
- Value type is string
- Default value is "elastic"
The username to authenticate to a secure Elasticsearch cluster.
-
var.elasticsearch.password -
- Value type is string
- Default value is "changeme"
The password to authenticate to a secure Elasticsearch cluster.
-
var.elasticsearch.ssl.enabled -
- Value type is boolean
- There is no default value for this setting.
Enable SSL/TLS secured communication to the Elasticsearch cluster. Leaving this unspecified will use whatever scheme is specified in the URLs listed in
hosts. If no explicit protocol is specified, plain HTTP will be used. If SSL is explicitly disabled here, the plugin will refuse to start if an HTTPS URL is given in hosts. -
var.elasticsearch.ssl.verification_mode -
- Value type is string
- Default value is "strict"
The hostname verification setting when communicating with Elasticsearch. Set to
disableto turn off hostname verification. Disabling this has serious security concerns. -
var.elasticsearch.ssl.certificate_authority -
- Value type is string
- There is no default value for this setting
The path to an X.509 certificate to use to validate SSL certificates when communicating with Elasticsearch.
-
var.elasticsearch.ssl.certificate -
- Value type is string
- There is no default value for this setting
The path to an X.509 certificate to use for client authentication when communicating with Elasticsearch.
-
var.elasticsearch.ssl.key -
- Value type is string
- There is no default value for this setting
The path to the certificate key for client authentication when communicating with Elasticsearch.
-
var.kibana.host -
- Value type is string
- Default value is "localhost:5601"
Sets the hostname and port of the Kibana instance to use for importing dashboards and visualizations. For example: "myhost:5601".
-
var.kibana.username -
- Value type is string
- Default value is "elastic"
The username to authenticate to a secured Kibana instance.
-
var.kibana.password -
- Value type is string
- Default value is "changeme"
The password to authenticate to a secure Kibana instance.
-
var.kibana.ssl.enabled -
- Value type is boolean
- Default value is false
Enable SSL/TLS secured communication to the Kibana instance.
-
var.kibana.ssl.verification_mode -
- Value type is string
- Default value is "strict"
The hostname verification setting when communicating with Kibana. Set to
disableto turn off hostname verification. Disabling this has serious security concerns. -
var.kibana.ssl.certificate_authority -
- Value type is string
- There is no default value for this setting
The path to an X.509 certificate to use to validate SSL certificates when communicating with Kibana.
-
var.kibana.ssl.certificate -
- Value type is string
- There is no default value for this setting
The path to an X.509 certificate to use for client authentication when communicating with Kibana.
-
var.kibana.ssl.key -
- Value type is string
- There is no default value for this setting
The path to the certificate key for client authentication when communicating with Kibana.