Kibana—your window into Elastic
editKibana—your window into Elastic
editKibana enables you to give shape to your data and navigate the Elastic Stack. With Kibana, you can:
- Search, observe, and protect. From discovering documents to analyzing logs to finding security vulnerabilities, Kibana is your portal for accessing these capabilities and more.
- Visualize and analyze your data. Search for hidden insights, visualize what you’ve found in charts, gauges, maps and more, and combine them in a dashboard.
- Manage, monitor, and secure the Elastic Stack. Manage your indices and ingest pipelines, monitor the health of your Elastic Stack cluster, and control which users have access to which features.
Kibana is for administrators, analysts, and business users. As an admin, your role is to manage the Elastic Stack, from creating your deployment to getting Elasticsearch data into Kibana, and then managing the data. As an analyst, your job is to discover insights in the data, visualize your data on dashboards, and share your findings. As a business user, you want to view existing dashboards and drill down into details.
Kibana works with all types of data. Your data can be structured or unstructured text, numerical data, time-series data, geospatial data, logs, metrics, security events, and more. Kibana is designed to use Elasticsearch as a data store. No matter your data, Kibana can help you uncover patterns and relationships and visualize the results.
Where to start
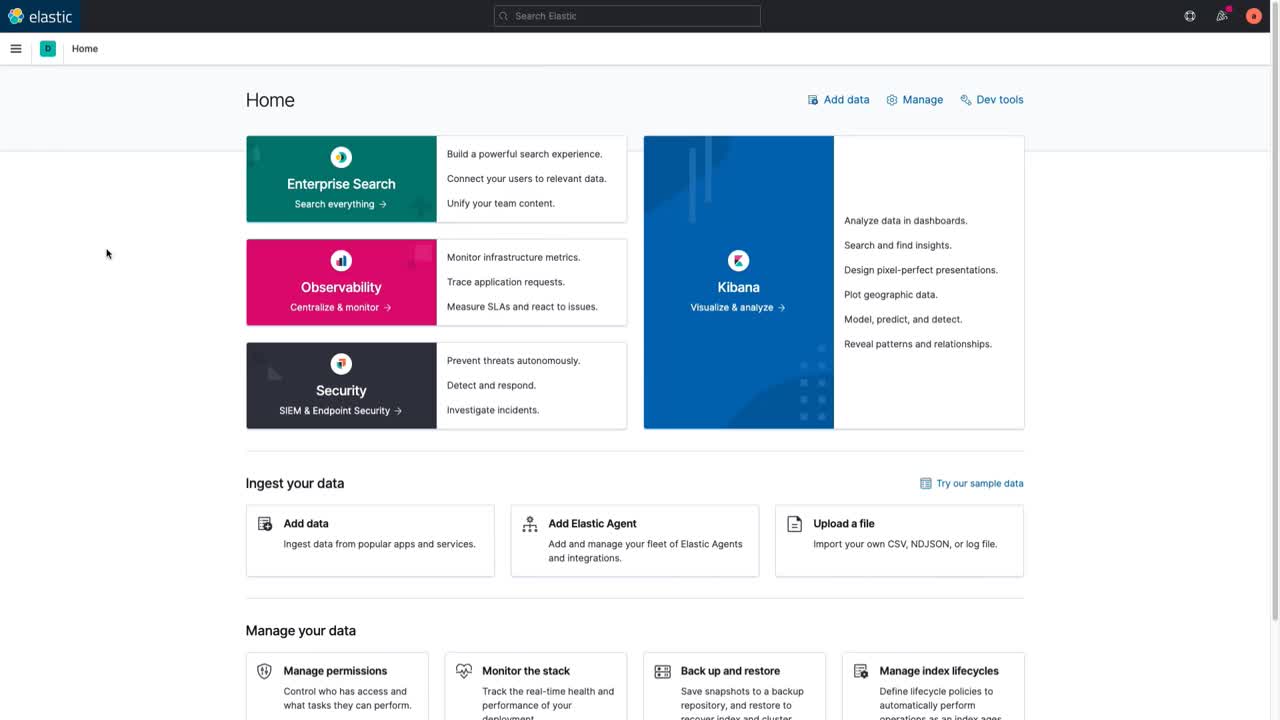
editStart with the home page, where you’re presented options for adding your data. You can collect data from an app or service or upload a file that contains your data. If you’re not ready to use your own data, you can add a sample data set.
The home page provides access to the Enterprise Search, Observability, and Security solutions, and everything you need to visualize and analyze your data.
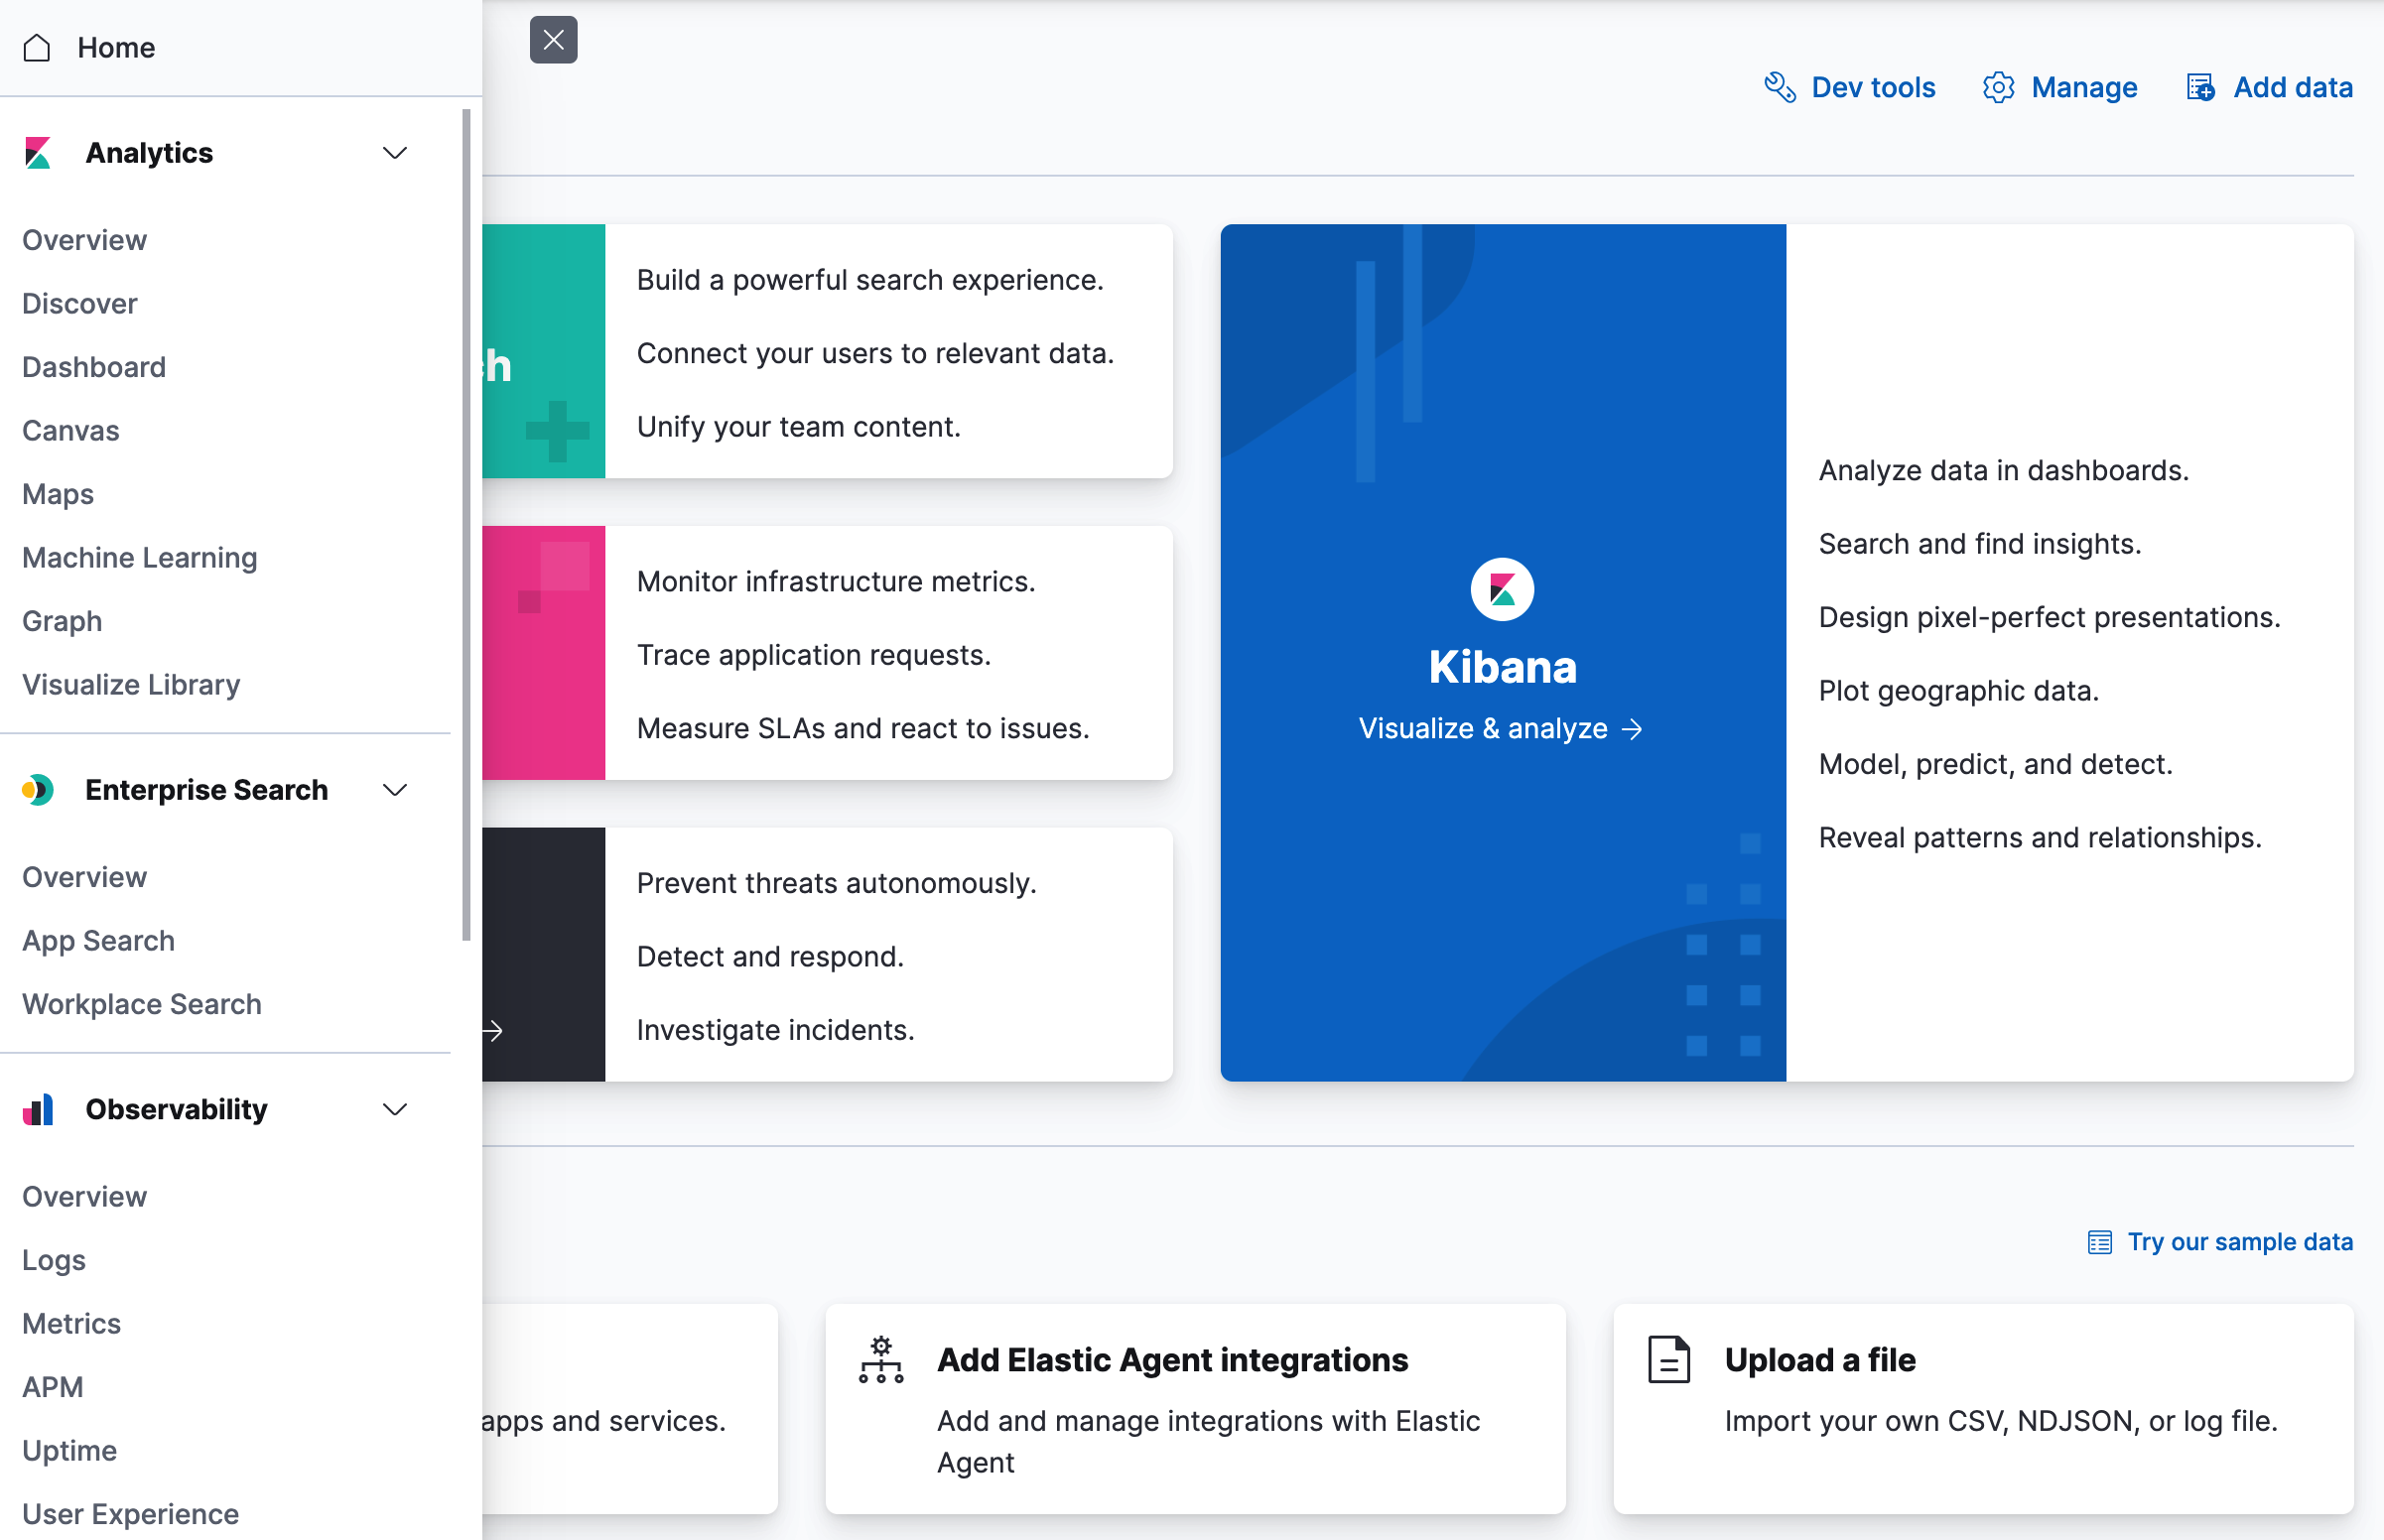
To access all of Kibana features, use the main menu. Open this menu by clicking the menu icon. For a quick reference of all Kibana features, refer to What’s the right app for you?
Search, observe, and protect
editBeing able to search, observe, and protect your data is a requirement for any analyst. Kibana provides solutions for each of these use cases.
- Enterprise Search enables you to create a search experience for your app, workplace, and website.
- Elastic Observability enables you to monitor and apply analytics in real time to events happening across all your environments. You can analyze log events, monitor the performance metrics for the host or container that it ran in, trace the transaction, and check the overall service availability.
- Designed for security analysts, Elastic Security provides an overview of the events and alerts from your environment. Elastic Security helps you defend your organization from threats before damage and loss occur.
Visualize and analyze
editData analysis is a core functionality of Kibana. You can quickly search through large amounts of data, explore fields and values, and then use Kibana’s drag-and-drop interface to rapidly build charts, tables, metrics, and more.
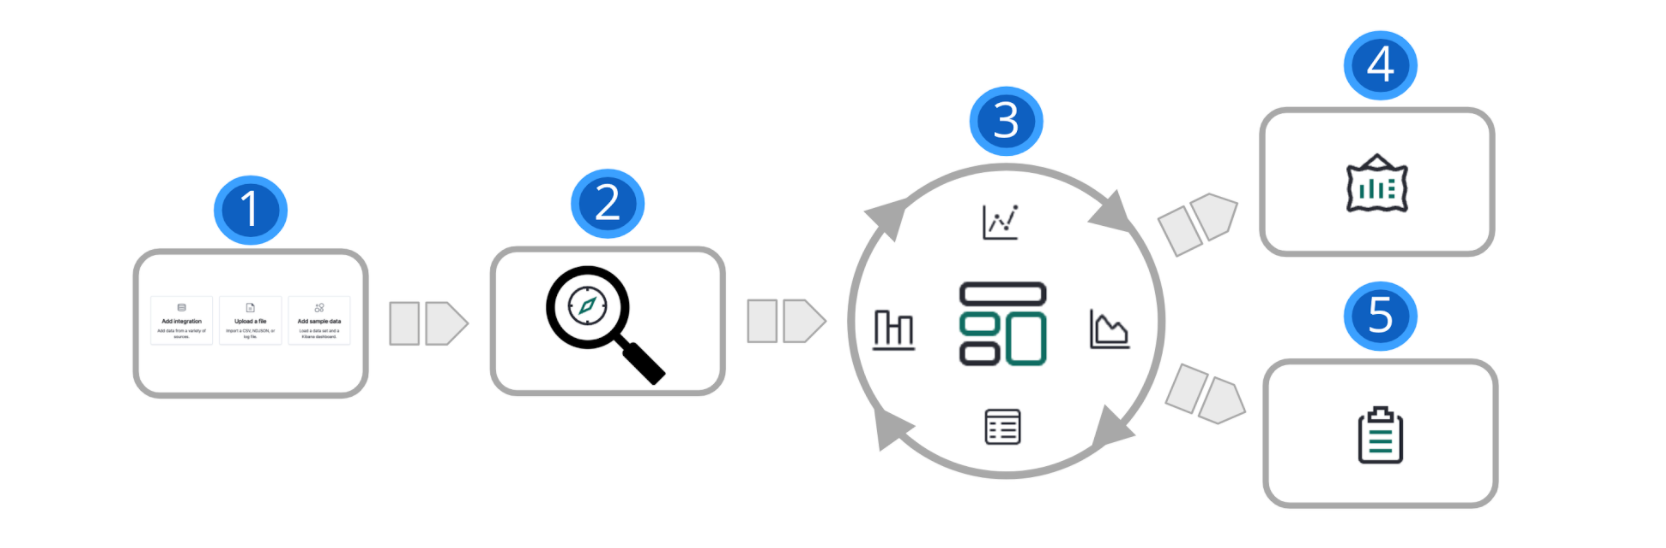
1 |
Add data. The best way to add Elasticsearch data to Kibana is to use one of our guided processes, available from the home page. |
2 |
Explore. With Discover, you can search your data for hidden insights and relationships. Ask your questions, and then filter the results to just the data you want. You can limit your results to the most recent documents added to Elasticsearch. |
3 |
Visualize. Kibana provides many options to create visualizations of your data, from aggregation-based data to time series data. Dashboard is your starting point to create visualizations, and then pulling them together to show your data from multiple perspectives. |
4 |
Present. With Canvas, you can display your data on a visually compelling, pixel-perfect workpad. Canvas can give your data the “wow” factor needed to impress your CEO and captivate coworkers with a big-screen display. |
5 |
Share. Ready to share your findings with a larger audience? Kibana offers many options—embed a dashboard, share a link, export to PDF, and more. |
Plot location data on a map
editIf you’re looking to better understand the “where’’ in your data, your data analysis journey will also include Maps. This app is the right choice when you’re looking for a spatial pattern, performing ad-hoc location-driven analysis, or analyzing metrics with a geographic perspective. With Maps, you can build world country maps, administrative region maps, and point-to-point origin-destination maps. You can also visualize and track movement over space and through time.
Model data behavior
editTo model the behavior of your data, you’ll use Machine learning. This app can help you extract insights from your data that you might otherwise miss. You can forecast unusual behavior in your time series data. You can also perform outlier detection, regression, and classification analysis on your data and generate annotated results.
Graph relationships
editLooking to uncover how items in your data are related? Graph is your app. Graphing relationships is useful in a variety of use cases, from fraud detection to recommendation engines. For example, graph exploration can help you uncover website vulnerabilities that hackers are targeting, so you can harden your website. Or, you might provide graph-based personalized recommendations to your e-commerce customers.
Manage all things Elastic Stack
editKibana’s Management UIs takes you under the hood, so you can twist the levers and turn the knobs. You’ll find guided processes for administering all things Elastic Stack, including data, indices, clusters, alerts, and security.
Manage your data, indices, and clusters
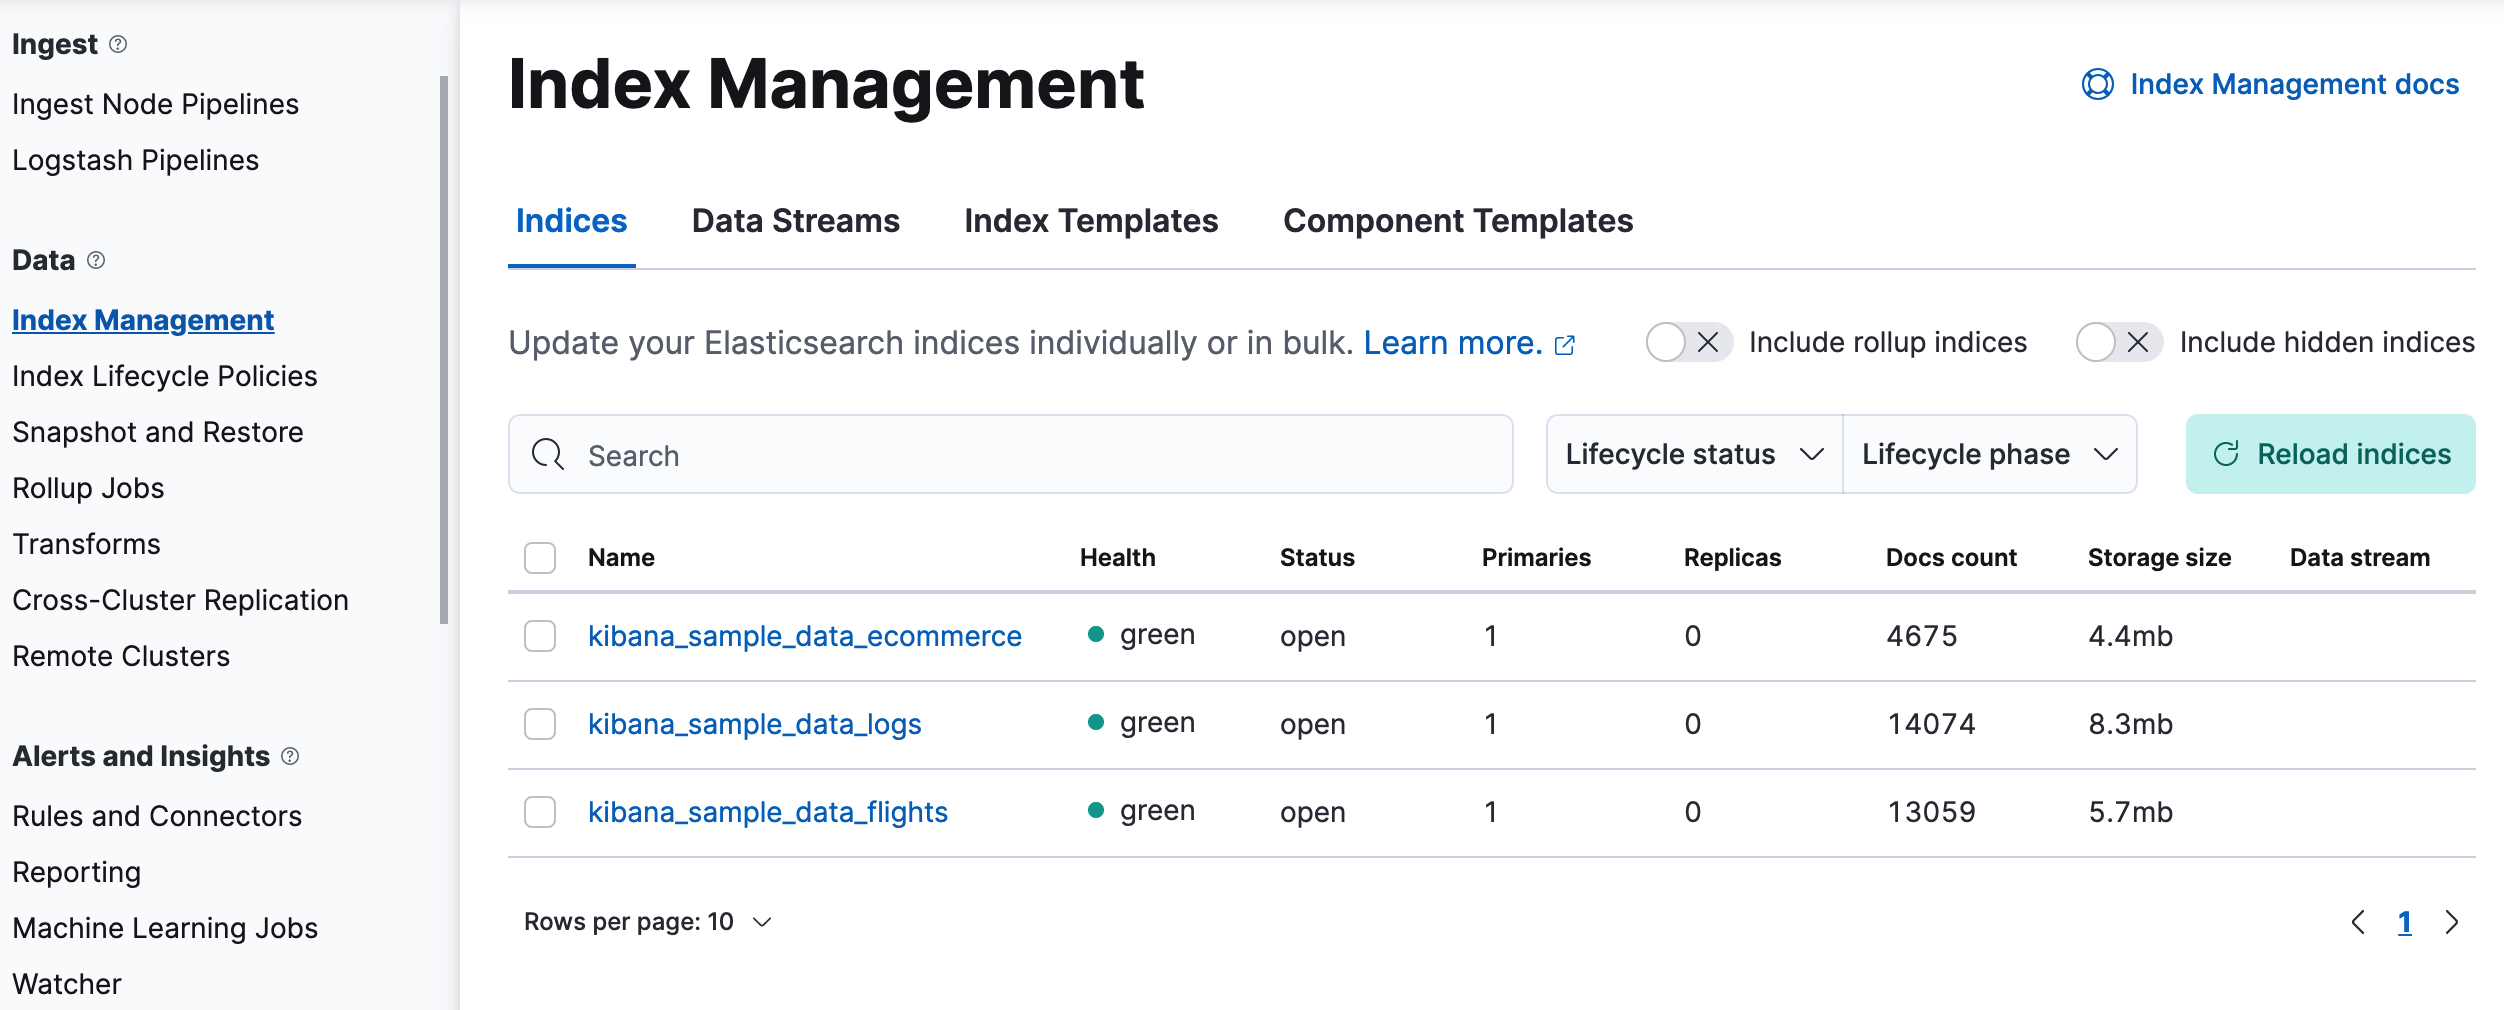
editKibana offers these data management tasks—all from the convenience of a UI:
- Refresh, flush, and clear the cache of your indices.
- Define the lifecycle of an index as it ages.
- Define a policy for taking snapshots of your cluster.
- Roll up data from one or more indices into a new, compact index.
- Replicate indices on a remote cluster and copy them to a local cluster.
Alert and take action
editDetecting and acting on significant shifts and signals in your data is a need that exists in almost every use case. For example, you might set a rule to notify you when:
- A shift occurs in your business critical KPIs.
- System resources, such as memory, CPU and disk space, take a dip.
- An unusually high number of service requests, suspicious processes, and login attempts occurs.
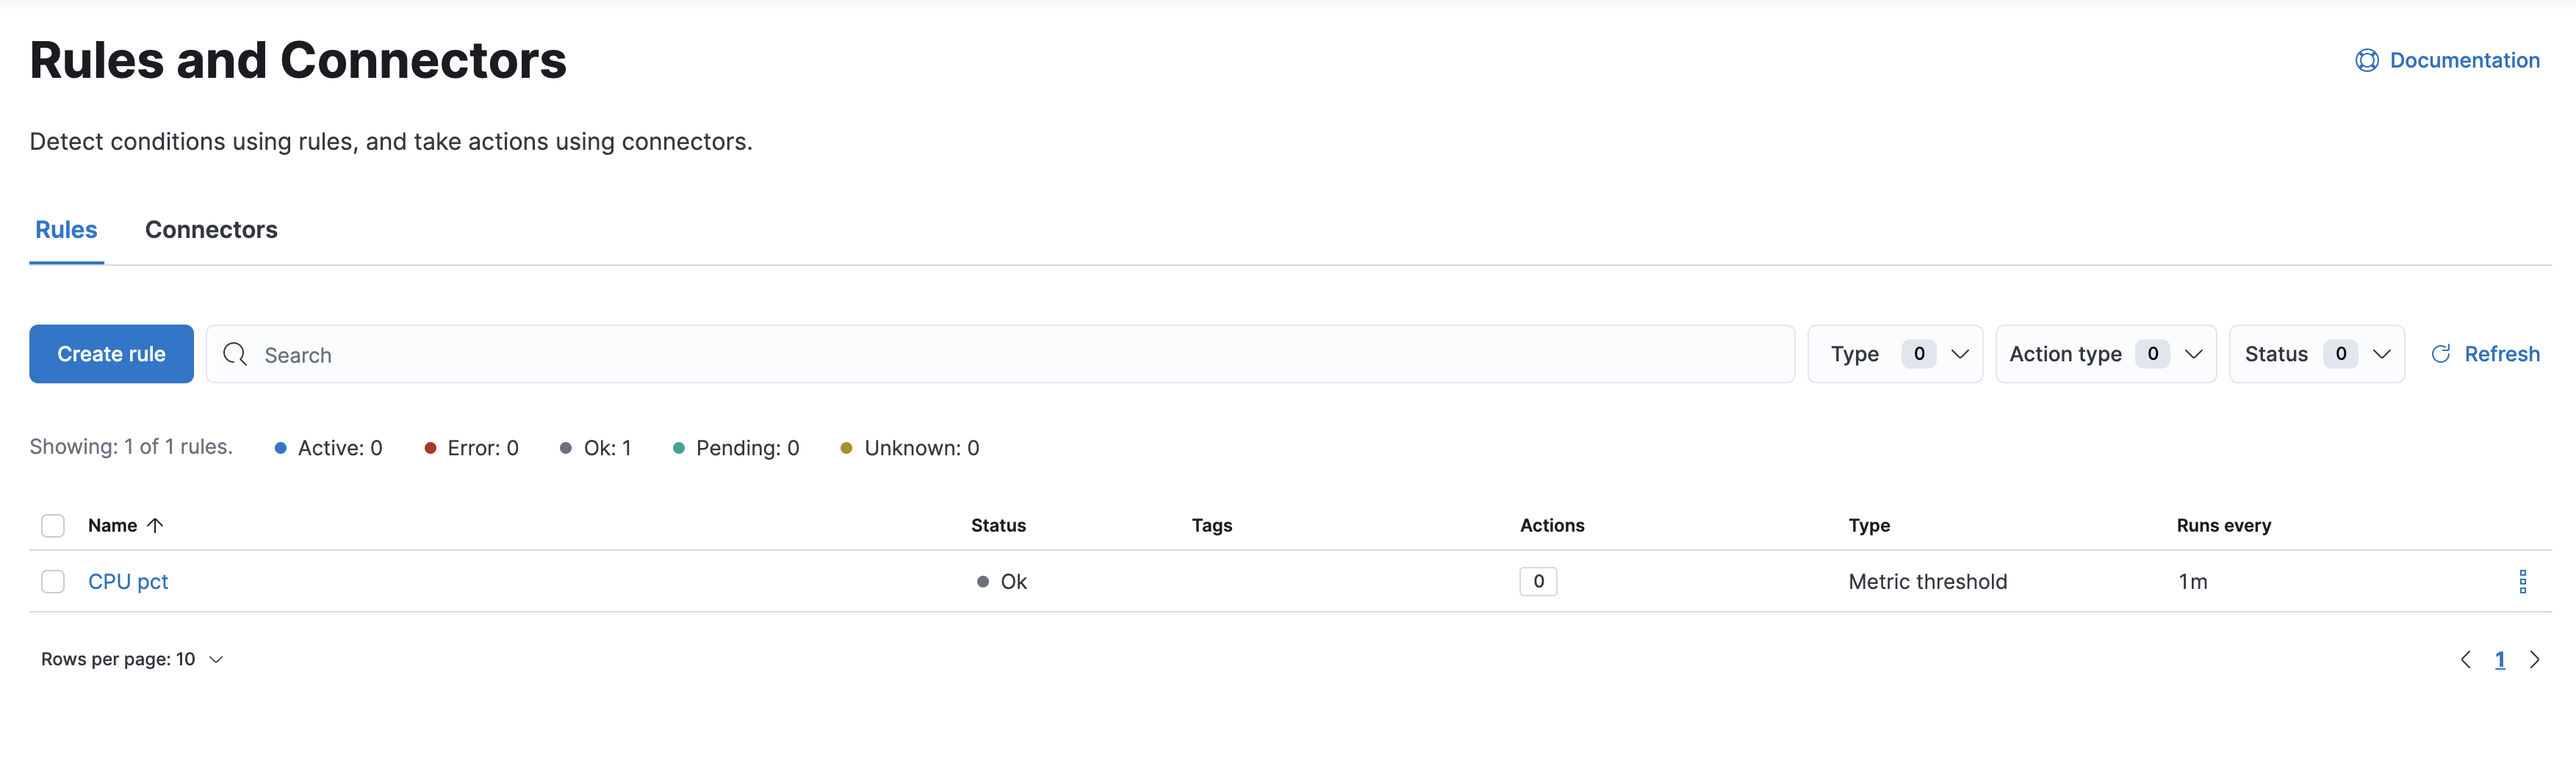
A rule triggers when a specified condition is met. For example, you can create a rule when the average or max of one of your metrics exceeds a threshold within a specified time frame.
When the rule triggers, you can send a notification to a system that is part of your daily workflow. Kibana integrates with email, Slack, PagerDuty, and ServiceNow, to name a few.
A dedicated view for creating, searching, and editing rules is in Rules and Connectors.
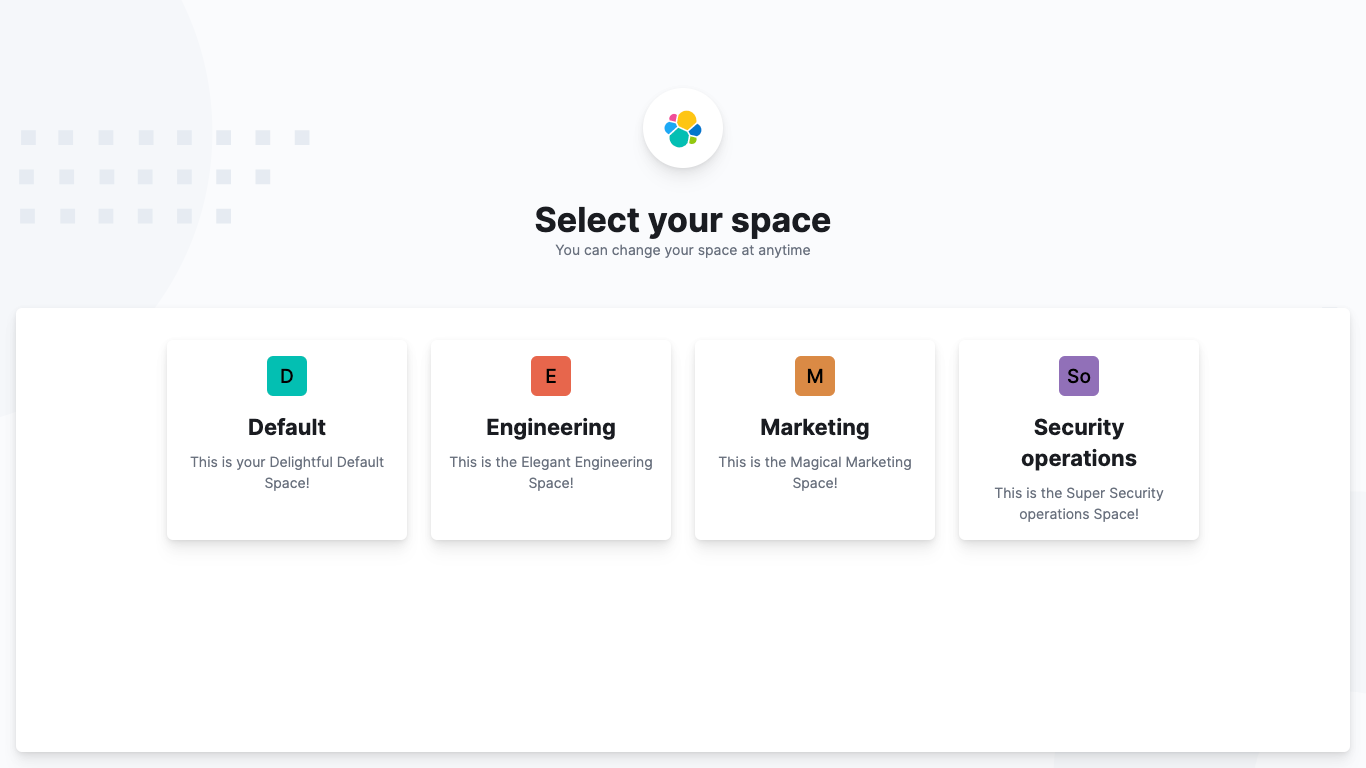
Organize your work in spaces
editWant to share Kibana’s goodness with other people or teams without overwhelming them? You can do so with Spaces, built for organizing your visualizations, dashboards, and index patterns. Think of a space as its own mini Kibana installation—it’s isolated from all other spaces, so you can tailor it to your specific needs without impacting others.
Most of Kibana’s entities are space-aware, including dashboards, visualizations, index patterns, Canvas workpads, graphs, tags, and machine learning jobs.
In addition:
- Elastic Security is space-aware, so the timelines and investigations you open in one space will not be available to other spaces.
- Observability is currently partially space-aware, but will be enhanced to become fully space-aware.
- Most of the Stack Management features are not space aware because they are primarily used to manage features of Elasticsearch, which serves as a shared data store for all spaces.
- Alerts are space-aware and work nicely with the Kibana role-based access control model to allow you secure access to them, depending on the alert type and your user roles. For example, roles with no access to an app will not have access to its alerts.
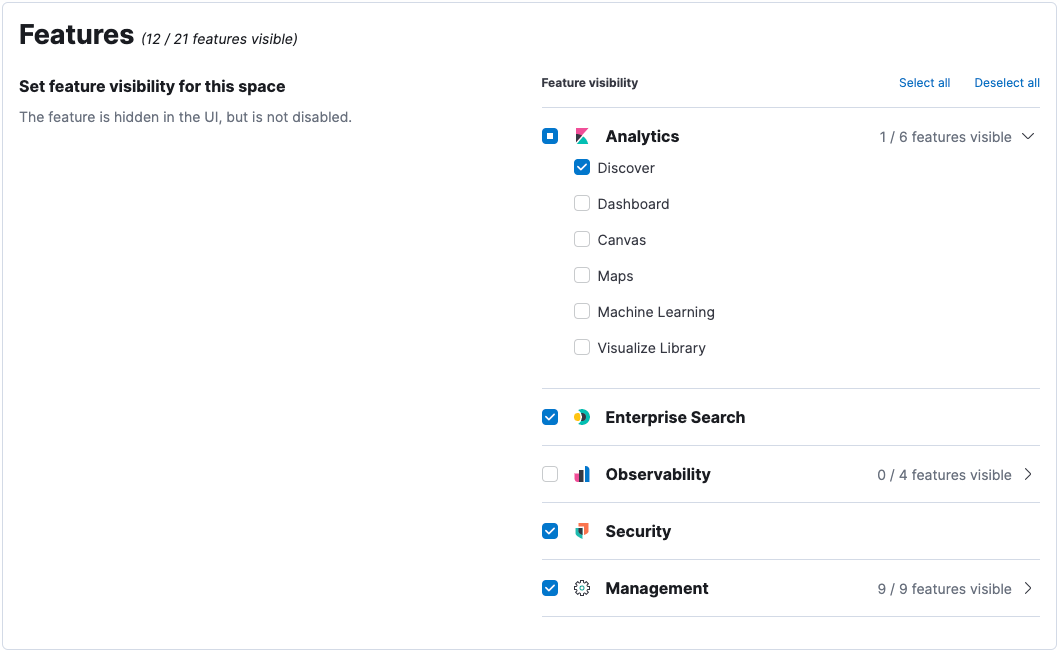
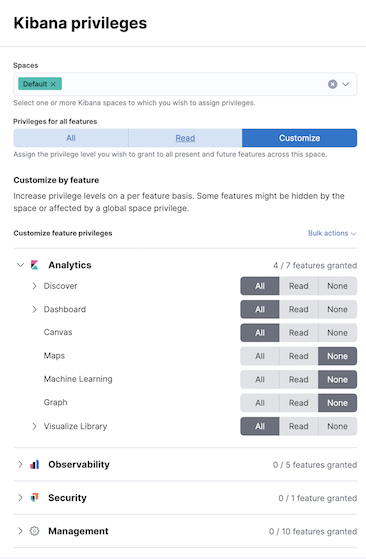
Control feature visibility
editYou can take spaces one step further and control which features are visible within each space. For example, you might hide Dev Tools in your "Marketing" space or show Stack Monitoring only in your "Engineering" space.
Controlling feature visibility is not a security feature. To secure access to specific features on a per-user basis, you must configure Kibana Security.
Secure Kibana
editKibana offers a range of security features for you to control who has access to what. The security features are automatically turned on when security is enabled in Elasticsearch. For a description of all available configuration options, see Security settings in Kibana.
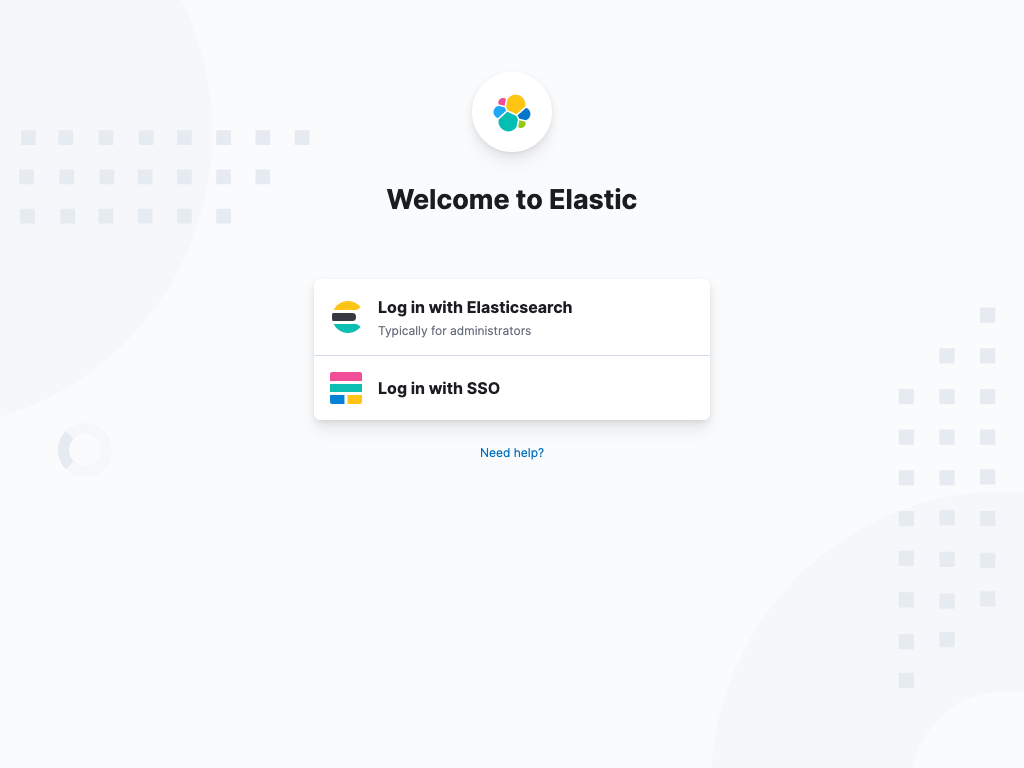
Log in
editKibana supports several authentication providers, allowing you to login using Elasticsearch’s built-in realms, or by your own single sign-on provider.
Secure access
editKibana provides roles and privileges for controlling which users can view and manage Kibana features. Privileges grant permission to view an application or perform a specific action and are assigned to roles. Roles allow you to describe a “template” of capabilities that you can grant to many users, without having to redefine what each user should be able to do.
When you create a role, you can scope the assigned Kibana privileges to specific spaces. This makes it possible to grant users different access levels in different spaces, or even give users their very own private space. For example, power users might have privileges to create and edit visualizations and dashboards, while analysts or executives might have Dashboard and Canvas with read-only privileges.
Kibana’s role management interface allows you to describe these various access levels, or you can automate role creation via our API.
Audit access
editOnce you have your users and roles configured, you might want to maintain a record of who did what, when. The Kibana audit log will record this information for you, which can then be correlated with Elasticsearch audit logs to gain more insights into your users’ behavior. For more information, see Kibana audit logging.
Quickly find apps and objects
editUsing the search field in the global header, you can search for applications and objects, such as dashboards and visualizations. Search suggestions include deep links into applications, allowing you to directly navigate to the views you need most.
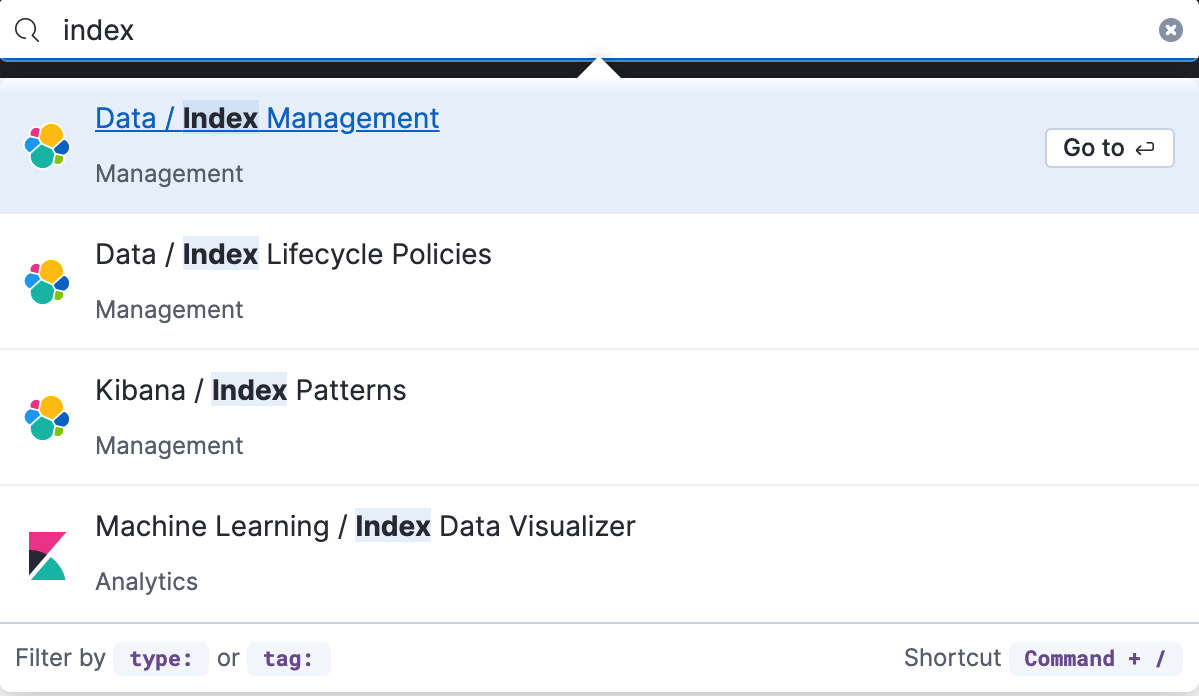
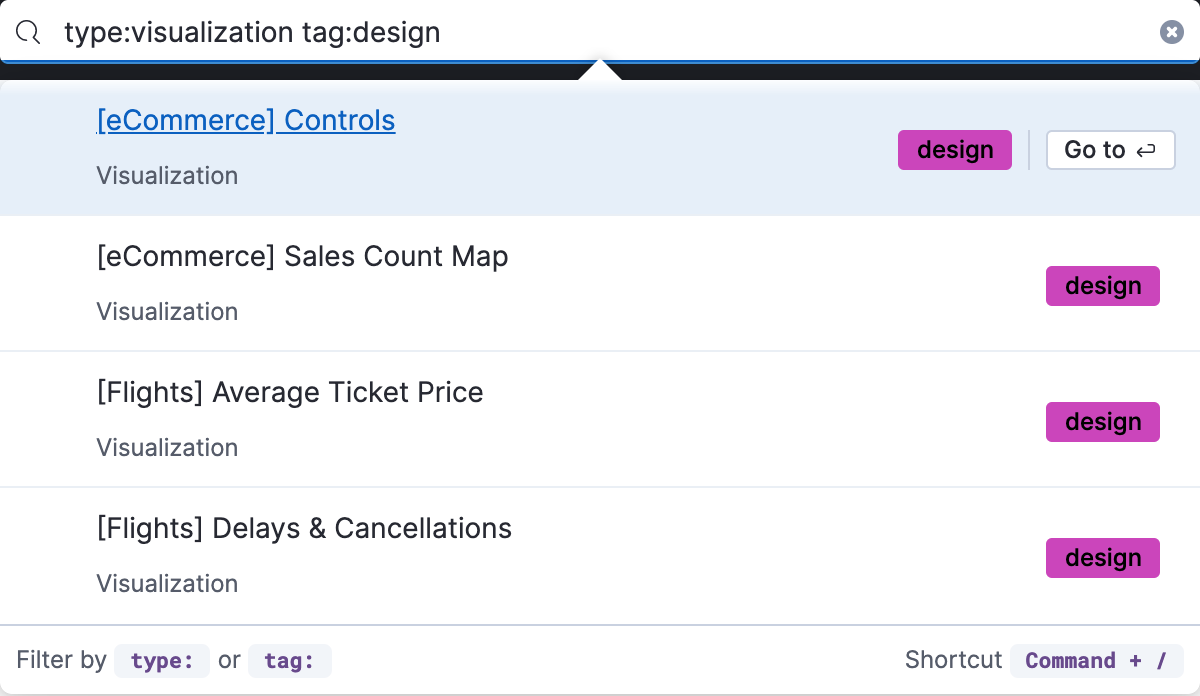
When searching for objects, you can search by type, name, and tag. Tags are keywords or labels that you assign to Kibana objects, so you can classify the objects in a way that is meaningful to you. You can then quickly search for related objects based on shared tags.
To get the most from the search feature, follow these tips:
- Use the keyboard shortcut—Ctrl+/ on Windows and Linux, Command+/ on MacOS—to focus on the input at any time.
-
Use the provided syntax keywords.
Search by type
type:dashboardAvailable types:
application,canvas-workpad,dashboard,index-pattern,lens,maps,query,search,visualizationSearch by tag
tag:mytagname
tag:"tag name with spaces"Search by type and name
type:dashboard my_dashboard_titleAdvanced searches
tag:(tagname1 or tagname2) my_dashboard_title
type:lens tag:(tagname1 or tagname2)
type:(dashboard or canvas-workpad) logs
What’s the right app for you?
editKibana has a wealth of apps, each with its own area of specialty. Scan this table to quickly find the app that gets you to our goal.
Get started |
|
Get Kibana |
Sign up for a free trial and start exploring data in minutes. |
Don’t know where to begin |
The home page. If you’re looking to explore and visualize your data, follow the Kibana Quick start. |
Add data |
The Add data page, available from the home page. |
See the full list of Kibana features |
|
Build a search experience |
|
Create a search experience for your workplace |
|
Build a search experience for your app |
|
Monitor, analyze, and react to events |
|
Monitor software services and applications in real-time by collecting performance information |
|
Monitor the availability of your sites and services |
|
Search, filter, and tail all your logs |
|
Analyze metrics from your infrastructure, apps, and services |
|
Prevent, detect, and respond to threats |
|
Create and manage rules for suspicious source events, and view the alerts these rules create. |
|
View all hosts and host-related security events. |
|
View key network activity metrics via an interactive map. |
|
Investigate alerts and complex threats, such as lateral movement of malware across hosts in your network. |
|
Create and track security issues |
|
View and manage hosts that are running Endpoint Security |
|
Analyze and visualize your data |
|
Know what’s in your data |
|
Create charts and other visualizations |
|
Show your data from different perspectives |
|
Work with location data |
|
Create a presentation of your data |
|
Generate models for your data’s behavior |
|
Explore connections in your data |
|
Share your data |
|
Administer your Kibana instance |
|
Manage your Elasticsearch data |
|
Set up rules |
|
Organize your workspace and users |
|
Define user roles and privileges |
|
Customize Kibana to suit your needs |
|
How to get help
editUsing our in-product guidance can help you get up and running, faster.
Click the help icon ![]() for help with questions or to provide feedback.
for help with questions or to provide feedback.
To keep up with what’s new and changed in Elastic, click the celebration icon in the global header.