Detections and alerts
editDetections and alerts
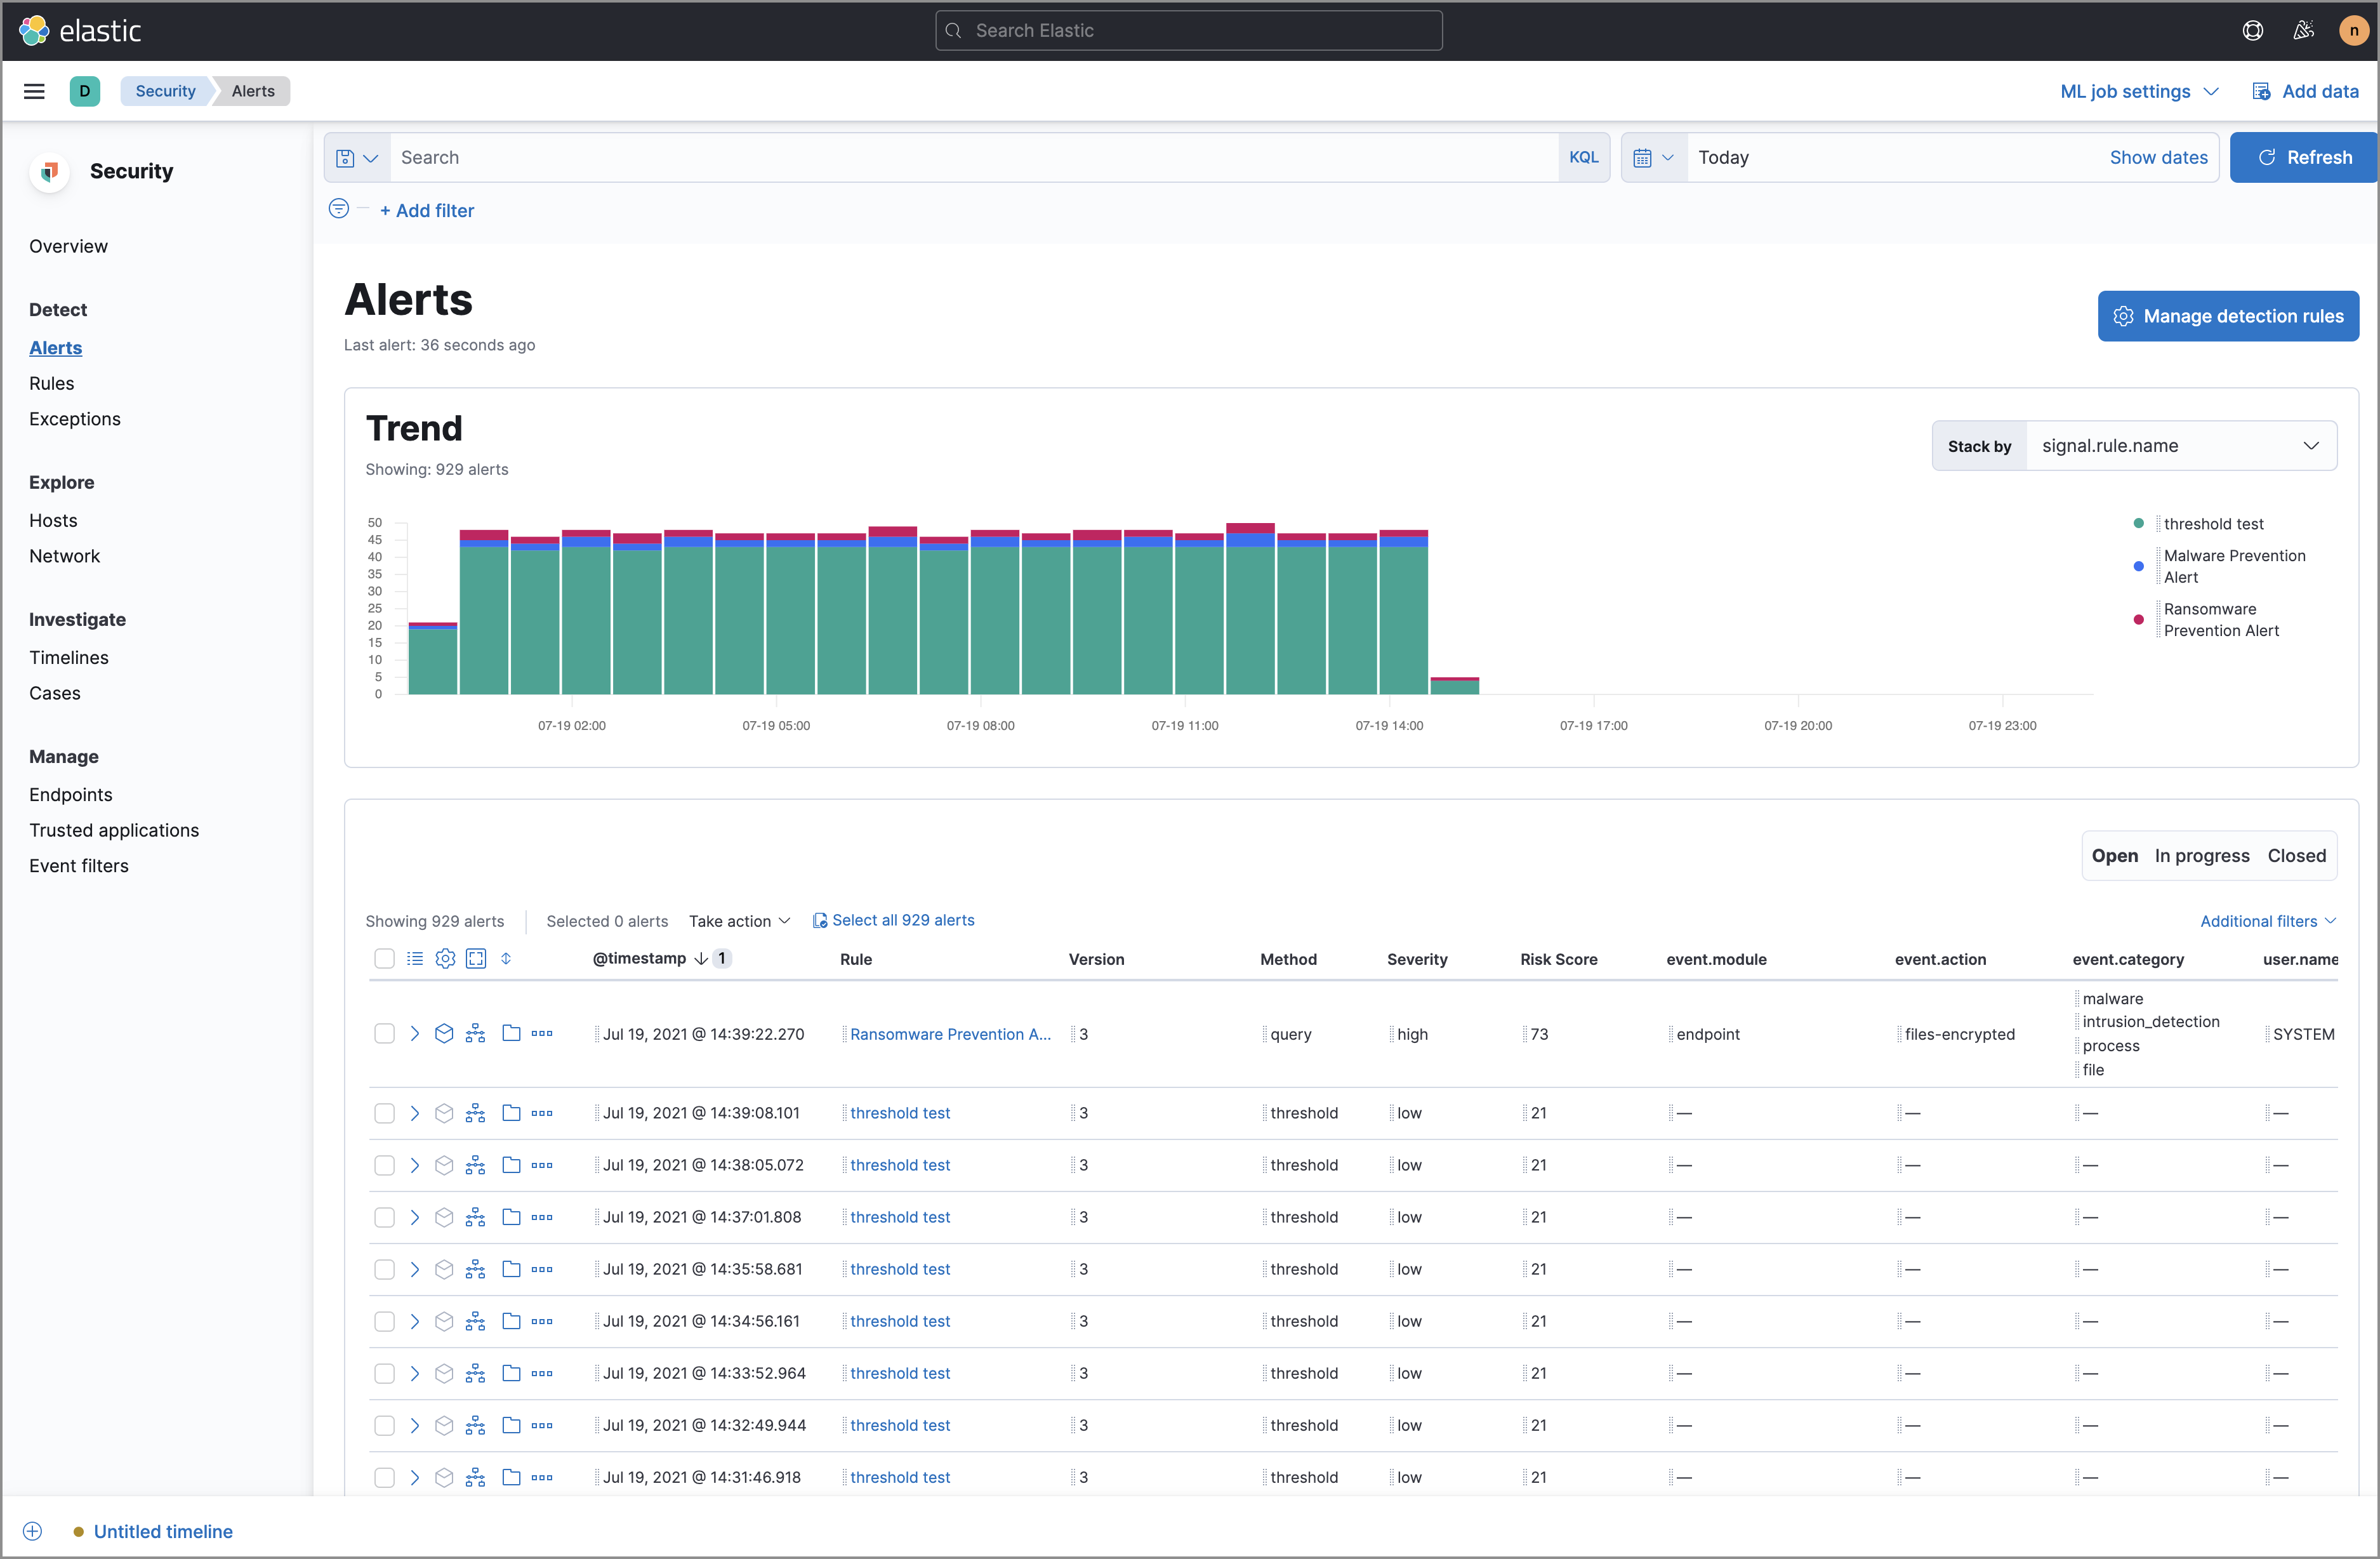
editUse the Detections feature to create and manage rules, and view the alerts
these rules create. Rules periodically search indices (such as endgame-* and
filebeat-*) for suspicious source events, and create alerts when a rule’s
conditions are met. When an alert is created, its status is Open. To help
track investigations, an alert’s status can be set as Open, In progress, or
Closed (see Change an alert’s status).
In addition to creating your own rules, enable Elastic prebuilt rules to immediately start detecting suspicious activity. For detailed information on all the prebuilt rules, see the Prebuilt rule reference section. Once the prebuilt rules are loaded and running, Tune detection rules and Rule exceptions and value lists explain how to modify the rules to reduce false positives and get a better set of actionable alerts. You can also use exceptions and value lists when creating or modifying your own rules.
There are two special prebuilt rules you need to know about:
-
Endpoint Security: Automatically creates an alert from all incoming Elastic Endpoint alerts. To receive Elastic Endpoint alerts, you must install the Endpoint agent on your hosts (see Configure and install the Endpoint Security integration).
When this rule is enabled, the following Endpoint events are displayed as detection alerts:
- Malware Prevention Alert
-
Malware Detection Alert
When you load the prebuilt rules, this is the only rule that is enabled by default.
- External Alerts: Automatically creates an alert for all incoming third-party system alerts (for example, Suricata alerts).
If you want to receive notifications via external systems, such as Slack or email, when alerts are created, use the Kibana Alerting and Actions framework.
To use Kibana Alerting for detection alert notifications, you need the appropriate license.
After rules have started running, you can monitor their executions to verify they are functioning correctly, as well as view, manage, and troubleshoot alerts (see Manage detection alerts and Monitor and troubleshoot rule executions).
You can create and manage rules and alerts via the UI or the Detections API.
To make sure you can access Detections and manage rules, see Detections prerequisites and requirements.
Compatibility with cold tier nodes
editCold tier is a data tier that holds time series data that is accessed only occasionally. In Elastic Stack version >=7.11.0, Elastic Security supports cold tier data for the following Elasticsearch indices:
-
Index patterns specified in
securitySolution:defaultIndex - Index patterns specified in the definitions of detection rules, except for indicator match rules
- Index patterns specified in the data sources selector on various Elastic Security app pages
Elastic Security does NOT support cold tier data for the following Elasticsearch indices:
- Index patterns controlled by Elastic Security, including signals and list indices
- Index patterns specified in indicator match rules
Using cold tier data for unsupported indices may result in detection rule timeouts and overall performance degradation.
Limited support for indicator match rules
editIndicator match rules provide a powerful capability to search your security data; however, their queries can consume significant deployment resources. We recommend avoiding indicator index queries that return more indicators than necessary for the desired rule coverage. In addition, the following support restrictions are in place:
- Elastic Security does not support the use of frozen tier data with indicator match rules.
- The use of Cross Cluster Search (CCS) with indicator match rules is not supported.
- Indicator match rules with an additional look-back time value greater than 24 hours are not supported.
Terminology
edit- Actions
- Sends notifications via other systems when a detection alert is created, such as email, Slack, PagerDuty, and Webhook.
- Detection alerts
-
Elastic Security produced alerts. Detection alerts are never received from external systems. When a rule’s conditions are met, Elastic Security writes a detection alert to an Elasticsearch
.signalsindex.Detection alert indices are created for each Kibana space. The naming convention is:
.siem-signals-<space name>. For the default space, the alerts index is named.siem-signals-default. - Detection rules
- Background tasks that run periodically and produce alerts when suspicious activity is detected.
- Elastic Security indices
-
Indices containing host and network source events (such as
packetbeat-*,log-*, andwinlogbeat-*). When you create a new rule, the default index pattern corresponds to the values defined in thesecuritySolution:defaultIndex. - Endpoint exceptions
-
Exceptions added to both rules and Endpoint agents on hosts. Endpoint exceptions can only be added when:
- Endpoint agents are installed on the hosts.
- The Elastic Endpoint Security rule is activated.
- Exceptions
- Added to rules to prevent specific source event field values from generating alerts.
- External alerts
- Alerts Elastic Security receives from external systems, such as Suricata.
- Indicator indices
- Indices containing suspect field values. Indicator match rules use these indices to compare their field values with source event values contained in Elastic Security indices.
Detections configuration and index privilege prerequisites
editDetections prerequisites and requirements provides detailed information on all the permissions required to initiate and use the Detections feature.
Malware prevention
editMalware, short for malicious software, is any software program designed to damage or execute unauthorized actions on a computer system. Examples of malware include viruses, worms, Trojan horses, adware, scareware, and spyware. Some malware, such as viruses, can severely damage a computer’s hard drive by deleting files or directory information. Other malware, such as spyware, can obtain user data without their knowledge.
Malware may be stealthy and appear as legitimate executable code, scripts, active content, and other software. It is also often embedded in non-malicious files, non-suspicious websites, and standard programs — sometimes making the root source difficult to identify. If infected and not resolved promptly, malware can cause irreparable damage to a computer network.
For information on how to enable malware protection on your host, see Malware Protection.
Machine learning model
editTo determine if a file is malicious or benign, a machine learning model looks for static attributes of files (without executing the file) that include file structure, layout, and content. This includes information such as file header data, imports, exports, section names, and file size. These attributes are extracted from millions of benign and malicious file samples, which then are passed to a machine-learning algorithm that distinguishes a benign file from a malicious one. The machine learning model is updated as new data is procured and analyzed.
Threshold
editA malware threshold determines the action the agent should take if malware is detected. The Elastic Agent uses a recommended threshold level that generates a balanced number of alerts with a low probability of undetected malware. This threshold also minimizes the number of false positive alerts.
Ransomware prevention
editRansomware is computer malware that installs discreetly on a user’s computer and encrypts data until a specified amount of money (ransom) is paid. Ransomware is usually similar to other malware in its delivery and execution, infecting systems through spear-phishing or drive-by downloads. If not resolved immediately, ransomware can cause irreparable damage to an entire computer network.
Behavioral ransomware prevention on the Elastic Endpoint detects and stops ransomware attacks on Windows systems by analyzing data from low-level system processes, and is effective across an array of widespread ransomware families — including those targeting the system’s master boot record.
For information on how to enable ransomware protection on your host, see Ransomware protection.
Ransomware prevention is a paid feature and is enabled by default if you have a Platinum or Enterprise license.
Resolve UI error messages
editDepending on your privileges and whether detection system indices have already been created for the Kibana space, you might see an error message when you try to open the Detections page.
Let’s set up your detection engine
If you see this message, a user with specific privileges must visit the Detections page before you can view detection rules and alerts. See Enable and access detections for a list of all the requirements.
For self-managed Elastic Stack deployments only, this message may be displayed
when the
xpack.encryptedSavedObjects.encryptionKey
setting has not been added to the kibana.yml file. For more information, see Configure self-managed Elastic Stack deployments.
Detection engine permissions required
If you see this message, you do not have the required privileges to view the Detections feature, and you should contact your Kibana administrator.
For self-managed Elastic Stack deployments only, this message may be
displayed when the xpack.security.enabled
setting is not enabled in the elasticsearch.yml file. For more information, see Configure self-managed Elastic Stack deployments.