Monitoring AWS services using the CloudWatch metricset
Starting with Metricbeat 7.2, we introduced the new cloudwatch metricset in the AWS module to monitor various AWS services. Amazon CloudWatch provides data and insights to better monitor performance, utilization and health of their applications and services. Instead of adding a new metricset for each service in AWS module, the CloudWatch metricset can be used to collect monitoring metrics from any services that publishes CloudWatch metrics.
On top of the basic functionalities of the cloudwatch metricset in 7.2, we added the ability to specify statistic methods and enable tag collections to give users a better out of the box experience and flexibility in upcoming 7.4 release. This also enables us to extend metricsets in the aws module using the Metricbeat light module. Light modules are a new way of defining Metricbeat modules or metricsets based on existing implementations. Instead of writing Golang code, it uses configuration files based on existing metricset in Metricbeat. Please see introducing Metricbeat light module for more details and great examples.
Introduction to CloudWatch metricset
Running the cloudWatch metricset requires settings in AWS account, AWS credentials, and a running Elastic Stack. Elastic Stack includes Elasticsearch for storing and indexing the data, and Kibana for data exploration. For this you can either create a cluster in Elasticsearch Service on Elastic Cloud or set up the Elastic Stack on your local machine.
1. Create an IAM policy
An IAM policy is an entity that defines permissions to an object within your AWS environment. Creating a customized IAM policy for Metricbeat with specific permissions is needed. Please see Creating IAM Policies for more details. After Metricbeat IAM policy is created, you need to add this policy to the IAM user which provided the credentials in the previous step.
With the cloudWatch metricset, four permissions need to be added into Metricbeat IAM policy:
ec2:DescribeRegionsec2:DescribeInstancescloudwatch:ListMetricscloudwatch:GetMetricDatatags:getResources
2. Enable the AWS module
In the out-of-box configuration of Metricbeat, only the system module is enabled by default, so you will need to explicitly enable the AWS module. The following command enables the AWS configuration in the modules.d directory on MacOS and Linux systems:
metricbeat modules enable aws
3. Set AWS credentials in the config file
To configure AWS credentials, users can put the credentials into the Metricbeat module configuration or using environment variables to pass them. In Metricbeat 7.4, the ability to load AWS credentials from a shared credentials file is added into aws module. Shared credentials file is at C:\Users\<yourusername>\.aws\credentials</yourusername> for Windows and ~/.aws/credentials for Linux, MacOS, or Unix. Users can specify the profile name using parameter credential_profile_name in aws module config. For more details on AWS credentials types and supported formats, please see AWS credentials configuration for more detail.
4. Configure CloudWatch metricset
There are several cloudWatch metricset specific parameters in configuration: namespace, name, dimensions, statistic and tags.resource_type_filter.
namespace: A namespace in AWS CloudWatch is a container for metrics from a specific application or service. Each service has its own namespace, for example Amazon EC2 uses AWS/EC2 namespace and Amazon Elastic Block Storage uses AWS/EBS namespace. Please see the full list of services and namespaces that publish CloudWatch metrics for more details.name: Users can specify what are the specific CloudWatch metrics need to be collected per namespace.dimensions: Dimensions are used to refine metrics returned for each instance. For example, InstanceId, ImageId and InstanceType all can be used as dimensions to filter data requested from Amazon EC2.statistic: Users can specify one or more statistic methods for each CloudWatch metric setting. By default, average, count, maximum, minimum and sum will all be collected for each metric.tags.resource_type_filte: Tags for resources will not be collected unless this parameter is set. Each resource in AWS has a specific resource type and the common format is service[:resourceType]. Please see resource type filters for more details.
With these parameters, users can use cloudWatch metricset to monitor one or more specific namespaces, one or more specific CloudWatch metrics, different metrics with different statistic methods, etc. For example, with the configuration below, three sets of metrics will be collected from CloudWatch: AWS SNS metrics with Sum statistic method, average `HealthCheckPercentageHealthy`, and average `SSLHandshakeTime` metrics from AWS Route53, AWS EC2 metrics for instance i-1234 with all default statistic methods.
- module: aws
  period: 300s
  metricsets:
    - cloudwatch
  credential_profile_name: test-metricbeat
  metrics:
    - namespace: AWS/SNS
      statistic: ["Sum"]
    - namespace: AWS/Route53
      name: ["HealthCheckPercentageHealthy", "SSLHandshakeTime"]
      statistic: ["Average"]
    - namespace: AWS/EC2
      tags.resource_type_filter: ec2:instance
      dimensions:
  - name: InstanceId
    value: i-1234
5. Start Metricbeat
Usage running on mac and linux system as an example:
metricbeat -e
Creating new metricsets using light modules
In 7.4, the elb metricset for AWS Elastic Load Balancing has been introduced using light modules, based on cloudwatch metricset. With the metricset-specific parameters for cloudwatch, we were able to define the elb metricset to collect different metrics with different statistics. In classic load balancer metrics documentation, the most useful statistic method is specified for each metric. For example, for metric Latency, the most useful statistic is Average; for metric BackendConnectionErrors, the most useful statistic is Sum and Average/Minimum/Maximum are reported per load balancer node which are not typically useful. Therefore, in manifest.yml, which defines the new elb metricset using light module, we have different metrics specified with different statistics.
To run the elb metricset, it’s the same as running other metricsets in Metricbeat:
- module: aws
  period: 300s
  metricsets:
    - elb
  credential_profile_name: test-metricbeat
This metricset also includes a predefined dashboard that displays some of the metrics, such as:
aws.metrics.HealthyHostCount.avgfor the number of healthy instances registered with load balancer.aws.metrics.UnheathyHostCount.avgfor the number of unhealthy instances registered with load balancer.aws.metrics.RequestCount.sumfor the number of requests completed or connections made during the specific interval.aws.metrics.Latency.avgfor the total time elapsed, in seconds. For HTTP listener, it’s from the time the load balancer sent the request to a registered instance until the instance started to send the response headers. For TCP listener, it's time for the load balancer to successfully establish a connection to a registered instance.aws.metrics.BackendConnectionErrors.sumfor the number of connections that were not successfully established between the load balancer and the registered instances.aws.metrics.HTTPCode_Backend_2XX.sumfor the number of HTTP response codes 2XX generated by registered instances.aws.metrics.HTTPCode_Backend_4XX.sumfor the number of HTTP response codes 4XX generated by registered instances.aws.metrics.HTTPCode_ELB_5XX.sumfor the number of HTTP 5XX server error codes generated by the load balancer.
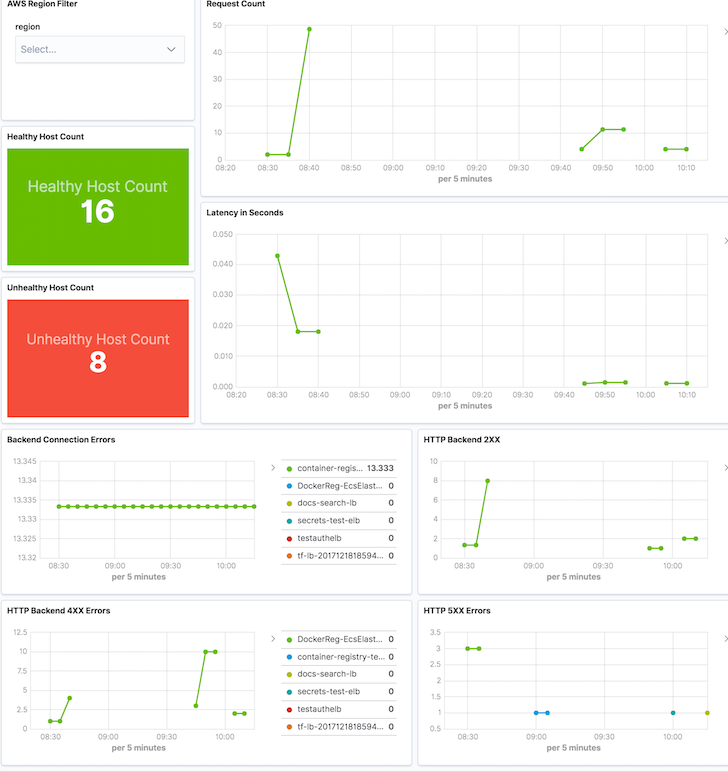
With this dashboard, users can check overall healthy host count and unhealthy host count, latency and errors. Users can also use the AWS Region Filter to only display load balancer data from one specific region to get a closer look.
What’s next
With the cloudWatch metricset, users can monitor different AWS services without waiting for individual metricset to be added into Metricbeat. For Beats contributors, Writing Metricbeat modules based on other modules: Introducing light modules introduced a faster and easier way to create new metricsets for more useful AWS services. We also highly encourage users to create light modules by converting a cloudWatch metricset configuration into a metricset for a specific AWS service that others can benefit as well. If you have any questions or feedback, please feel free to post on Beats discuss forum!
You can start capturing and analyzing your AWS CloudWatch metrics with the cloudWatch metricset, today, and can ship metrics to Elasticsearch running on Elastic Cloud, or to a cluster running the default distribution of the Elastic Stack.