Elastic APM 7.6.0 released
We are pleased to announce the release of Elastic APM 7.6.0 — available on the Elasticsearch Service, or as part of the default distribution of the Elastic Stack. This release brings exciting new changes, including support for messaging frameworks, while increasing our support for other open ecosystems.
Jaeger intake
Jaeger, a CNCF graduated project, is a popular choice for end-to-end request tracing that is compatible with OpenTelemetry standards, and we are excited to announce that Elastic APM now acts as a Jaeger intake. This enhancement enables you to ingest your Jaeger-instrumented traces directly into Elasticsearch via the APM Server without needing to change already instrumented code, leveraging your existing Jaeger instrumentation. This means your trace information will be stored in Elasticsearch and you will be able visualize your Jaeger agent-captured traces in the APM app. Check out our documentation to learn more and get started.
Deployment annotations
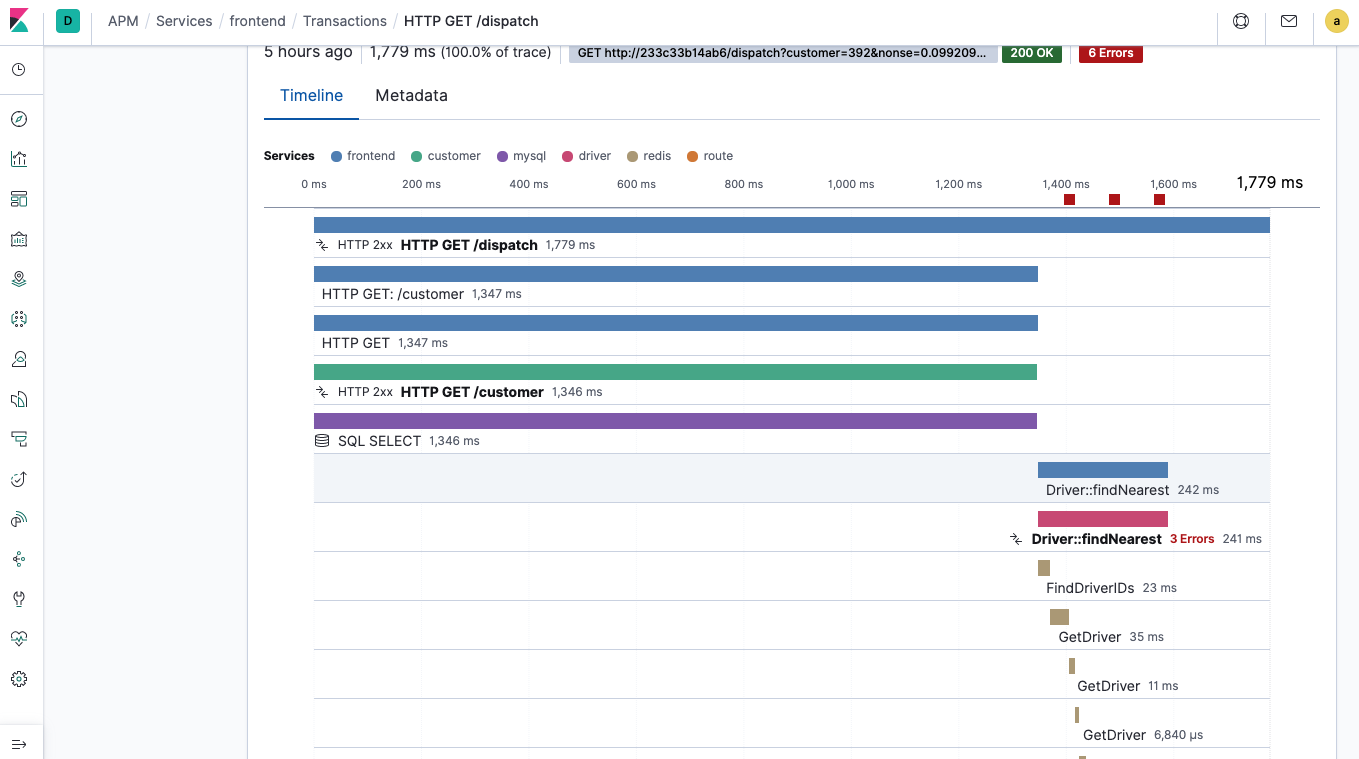
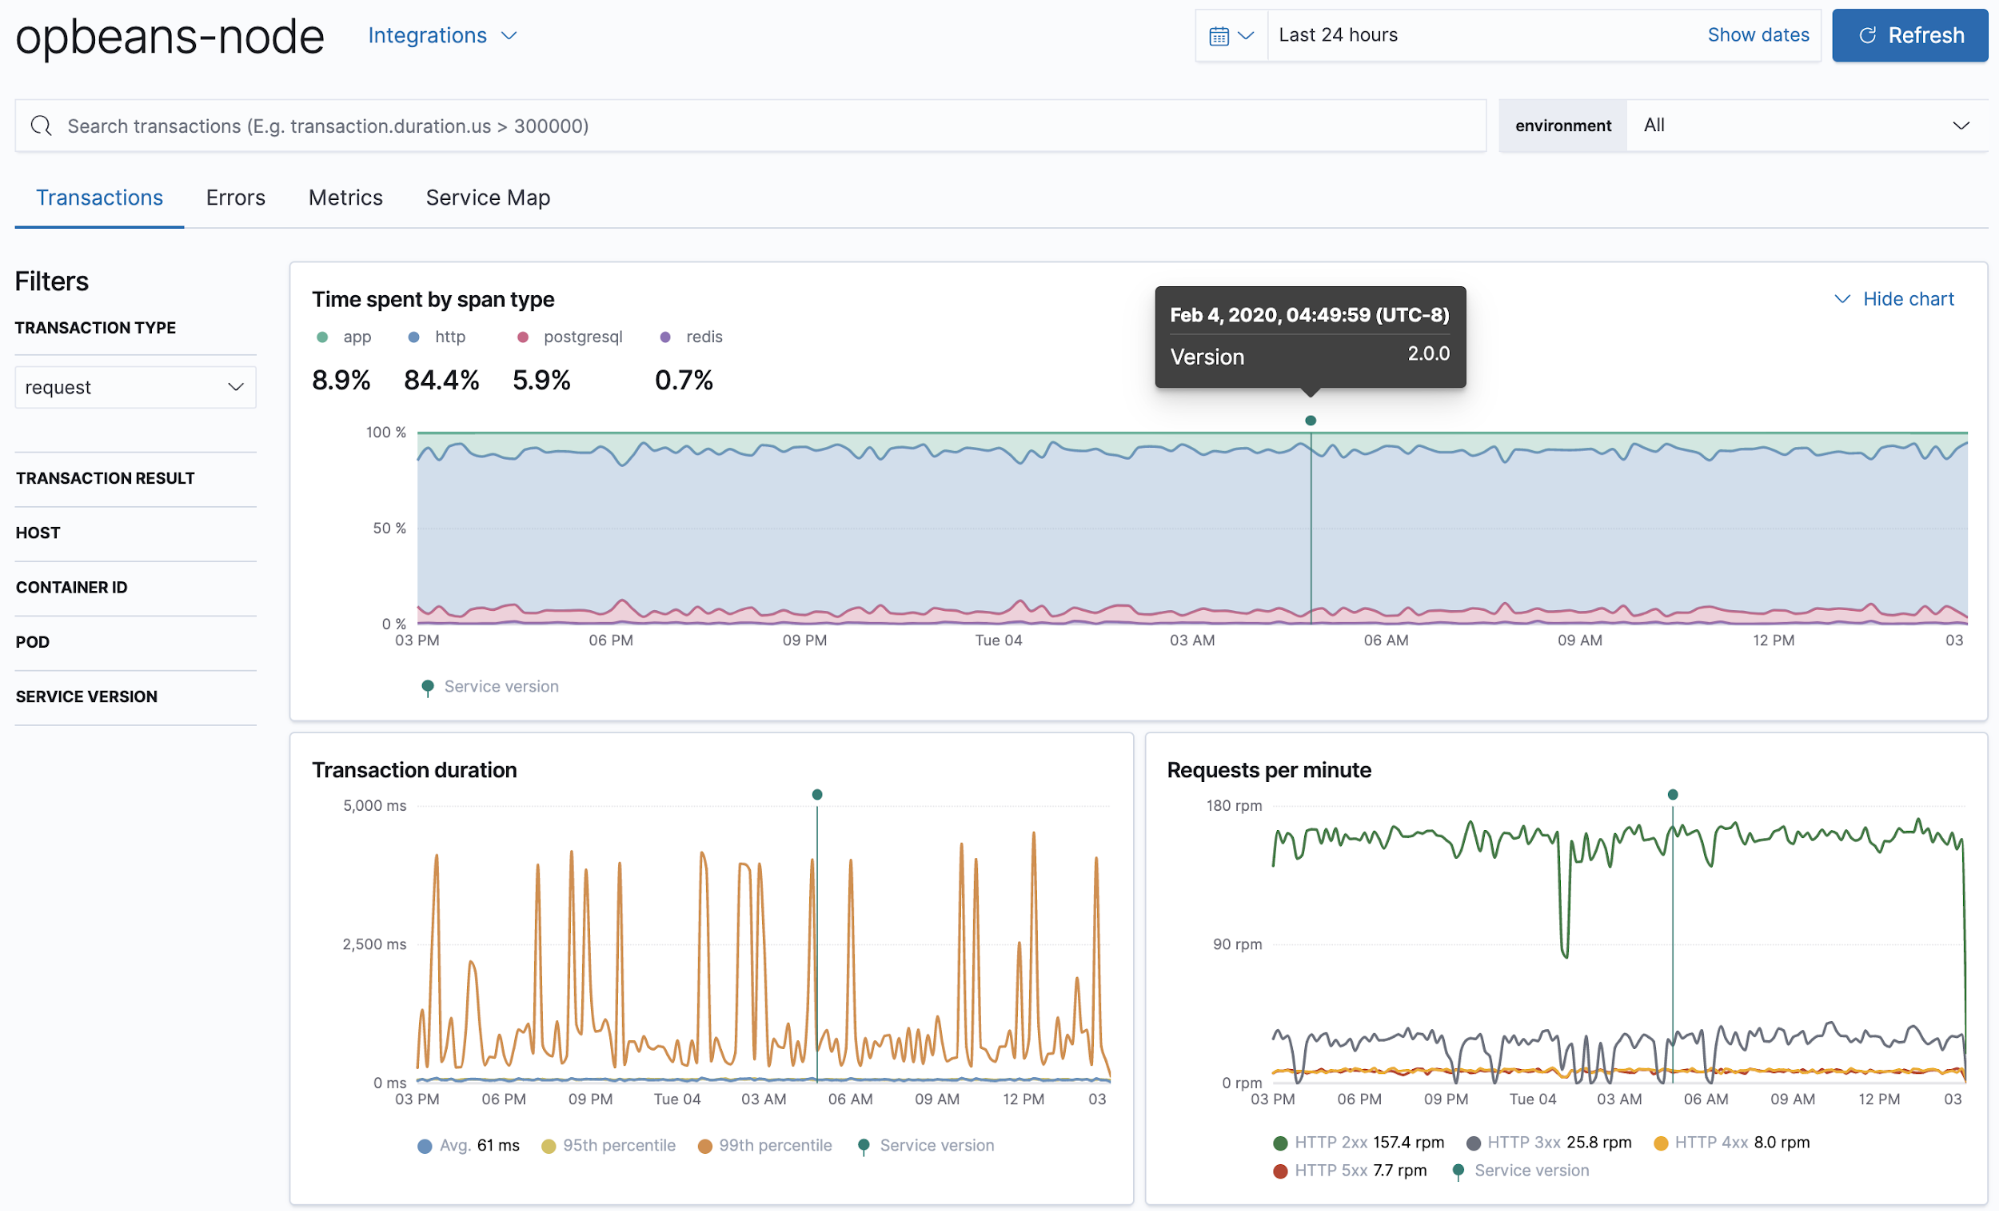
The 7.6 release also provides you with additional visibility into your deployments. APM app charts are now annotated automatically when a new deployment is detected by the agents monitoring your services. These annotations provide you a way to quickly visualize and identify if your new deployment has increased response times for an end user, or if the memory/CPU footprint of your application has increased, allowing you to manage your deployments more effectively.
Messaging framework support
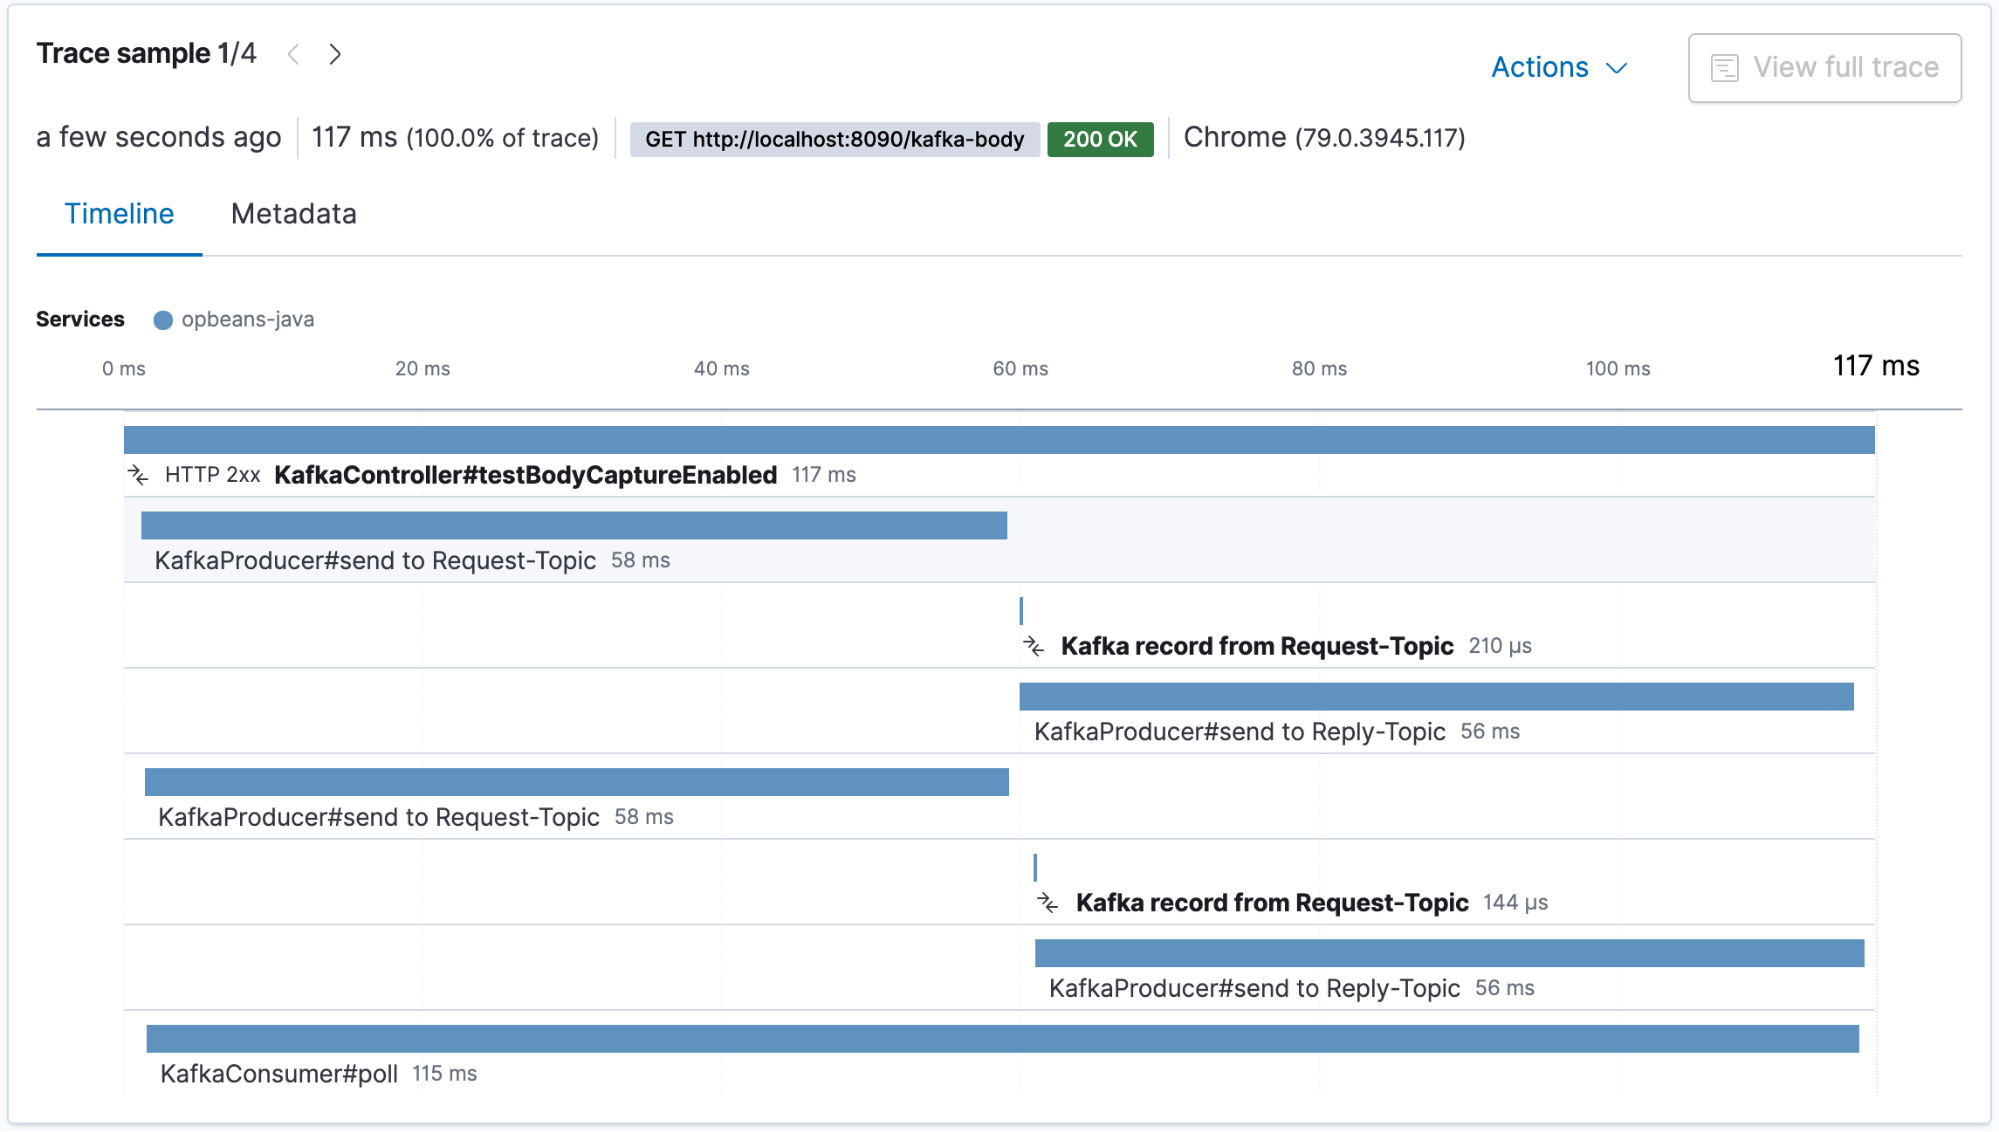
Using Kafka to connect your services but unable to see an end-to-end trace? In this release we have added support for Kafka and JMS to the Java agent. This means that you will now be able to visualize an end-to-end trace, including the messaging framework that was used to communicate between two services. In addition to the spans in the distributed trace, you can see the time your request spent waiting in the queue. Refer to our documentation for further details on this feature.
Including detailed information per transaction: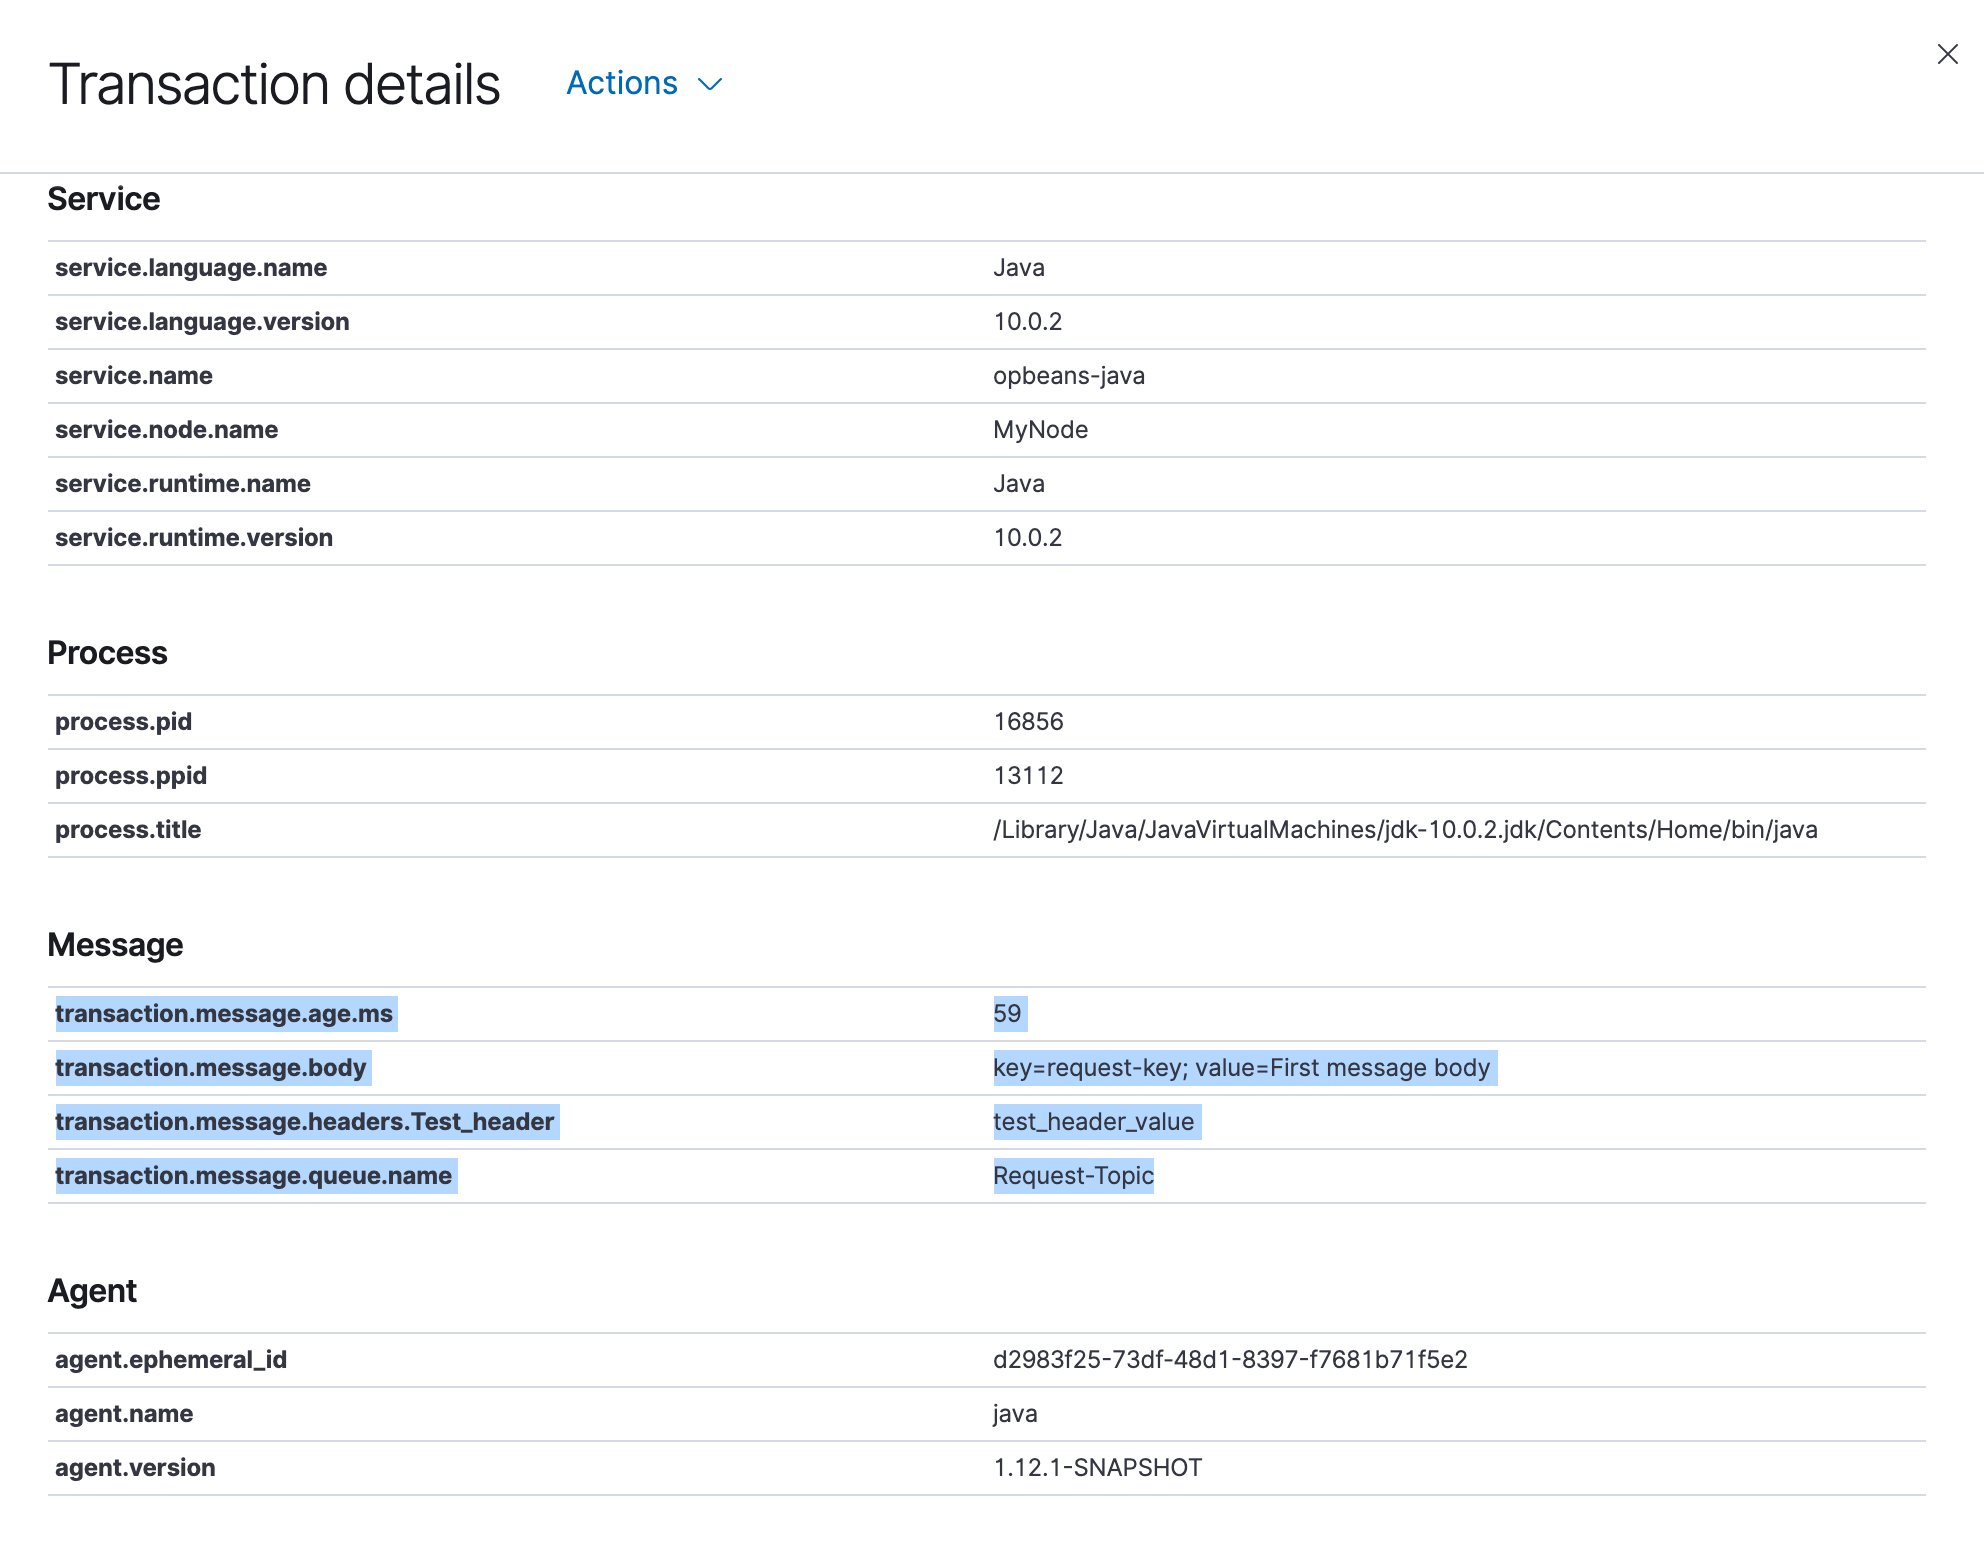
APM SIEM integration
HTTP data collected with your APM agents will now be available in the SIEM app. This will enable you to look for security threats in your APM data. In addition to the APM data being available in the SIEM app, we also have included additional machine learning jobs that can run against this data and apprise you when a security threat is detected. These custom machine learning jobs can help Identify requests from scripts, detect forbidden requests, requests accessing forbidden methods, and allow you to query for a specific attack by a dedicated tool and version.
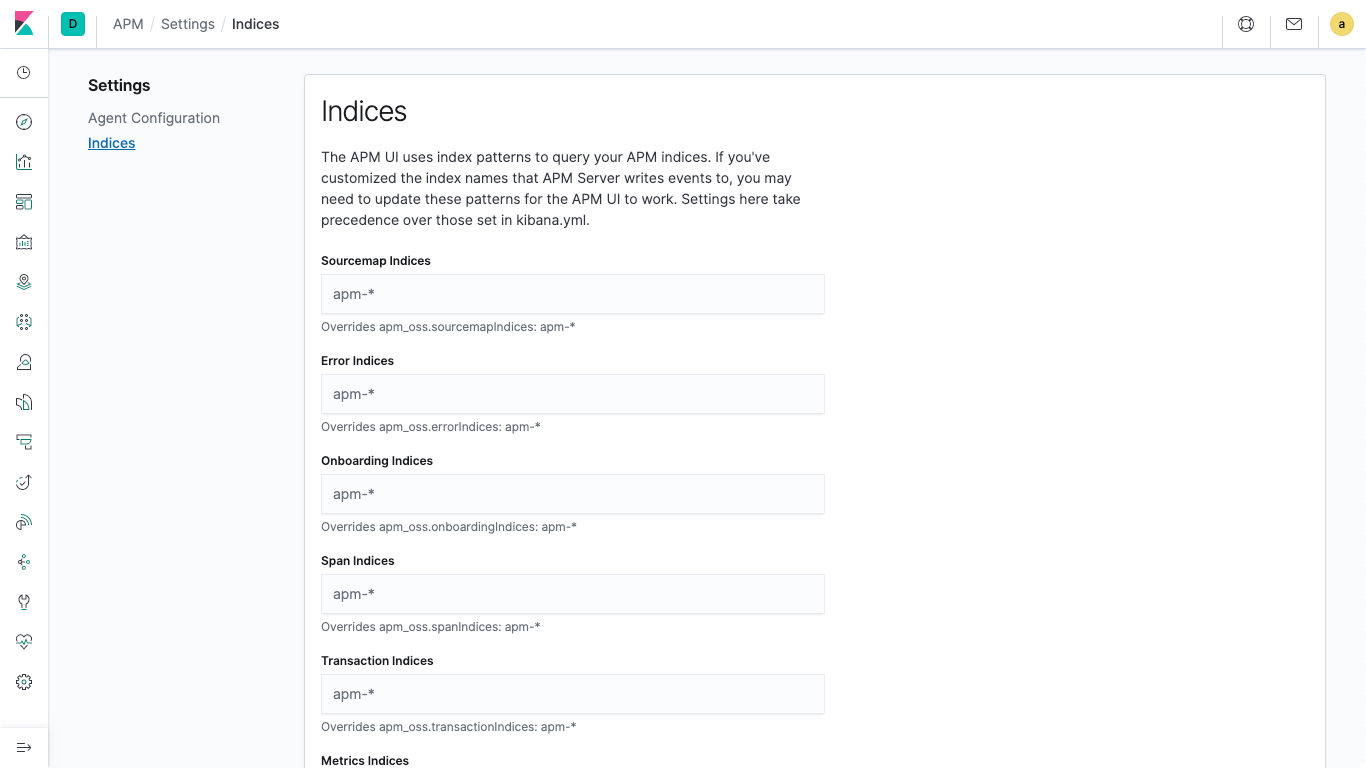
UI index configuration
In 7.5 release we shipped support for configuring your APM agent properties from the Kibana APM app. With the 7.6 release we have added support for configuring APM indices from Kibana, allowing you to customize your environment even further.
API key authentication
The 7.6 release enables API key authentication for your APM agents. This will provide you with greater flexibility when managing your services in Elastic APM by allowing for multiple tokens at the same time, adding/removing tokens without needing to restart the APM Server, and allowing for finer authorization rules going for specific services or teams.
Try it out!
You can access the 7.6.0 Elastic APM application on the Elasticsearch Service on Elastic Cloud, or you can download it as part of the default distribution of the Elastic Stack. Grab the APM Server (or leverage the one included with an Elasticsearch Service account), instrument your applications with the APM agents, and start monitoring your applications.