Elastic APM Java Agent is Generally Available
We are thrilled to announce that our Java Agent is now generally available (GA)! After a successful beta phase, with lots of downloads and plenty of feedback, we are ready to release the production-ready version, 1.0. Note that this version requires at least APM Server 6.5.
The Java agent is the new member of the Elastic APM agent family, joining Node.js, Python, Ruby, JavaScript/RUM, and Go (a new GA sibling as well). Elastic APM is the Application Performance Monitoring solution from Elastic that helps you to gain insight into the performance of your application and track errors.
Main Features
What you get out of the box
Installing the Elastic APM Java agent is as simple as adding the -javaagent flag and a couple of system properties to your JVM startup command. As long as you are using supported frameworks and platforms, such as Spring MVC/Spring Boot, Servlet API, and JAX-RS, your application will be instrumented and monitored automatically.
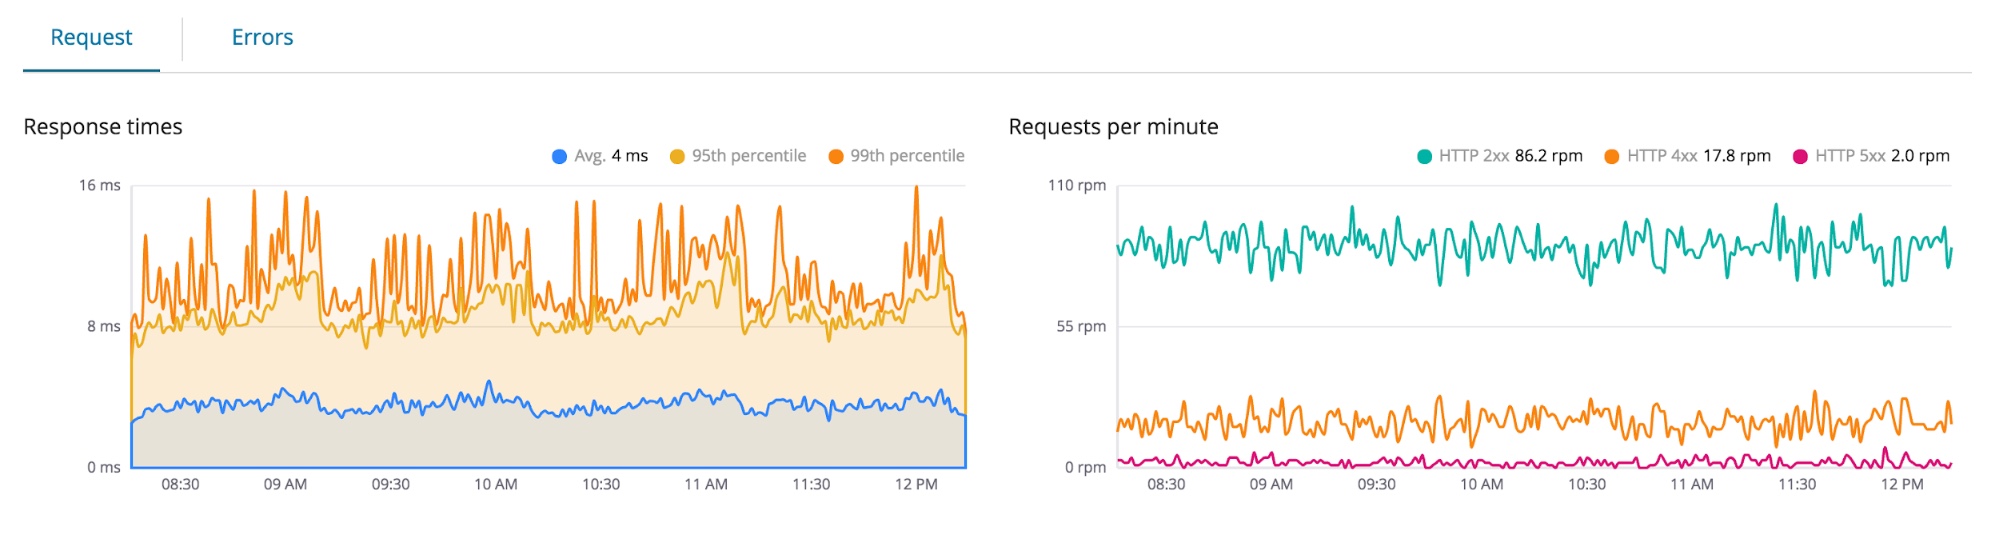
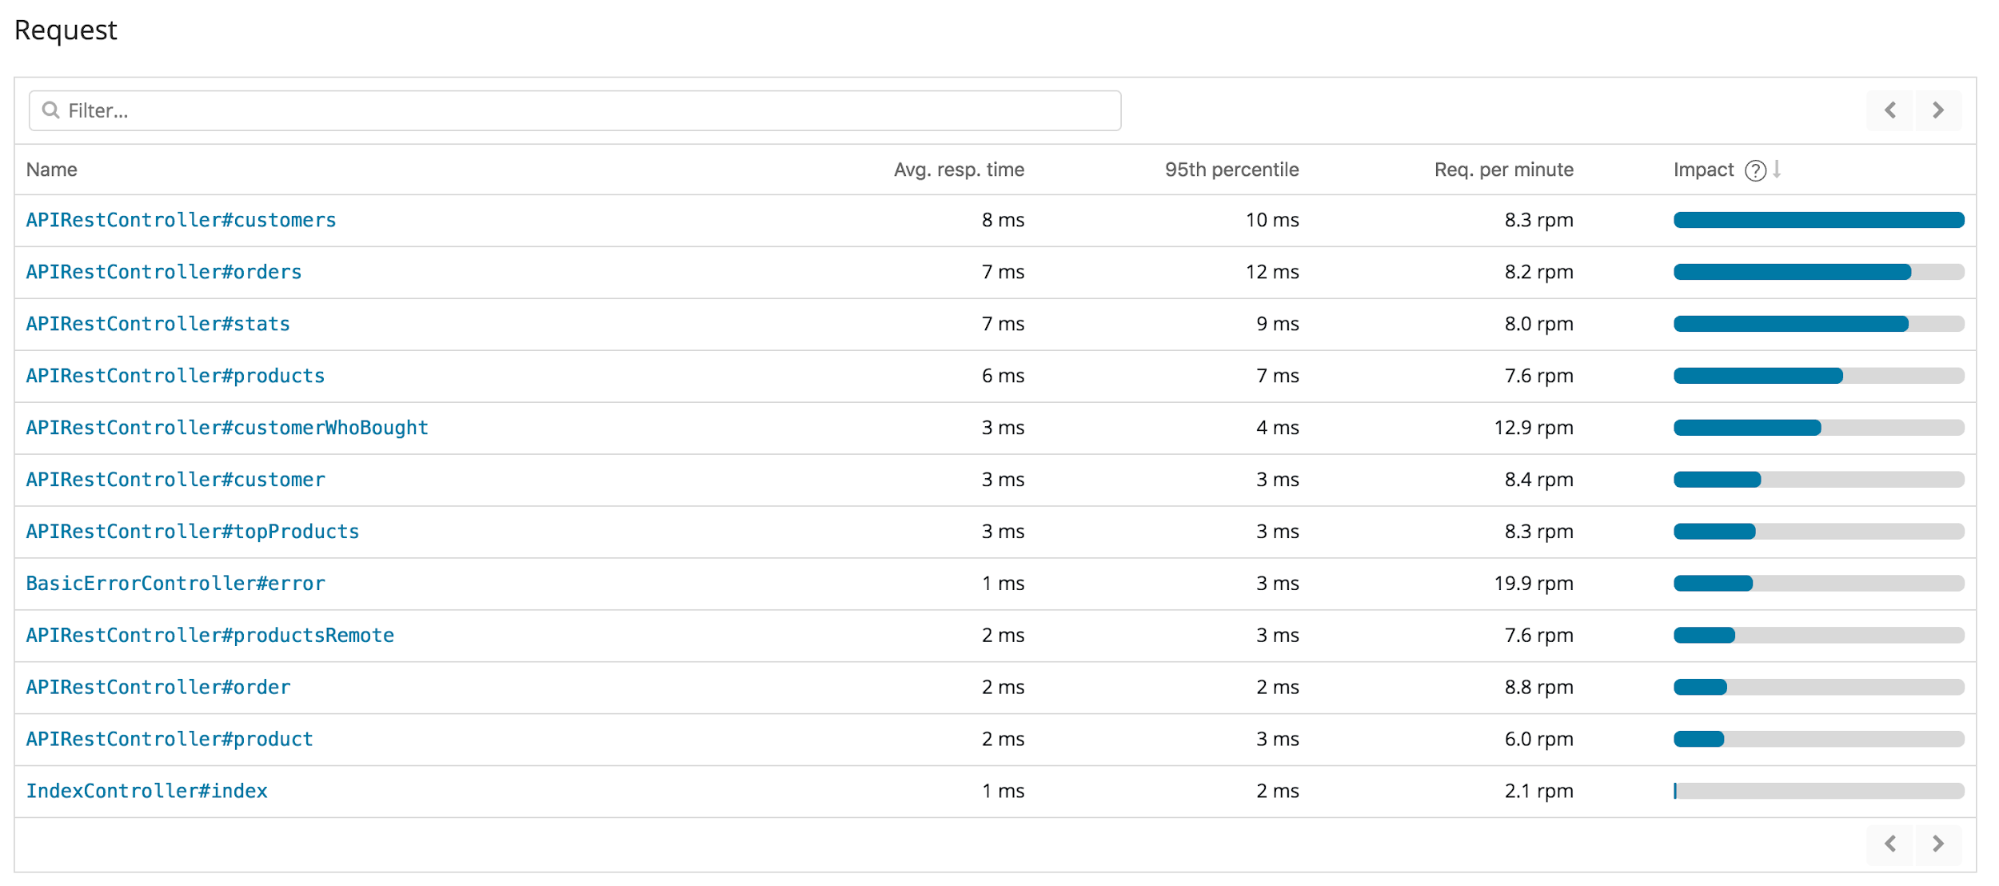
Web Request Visibility
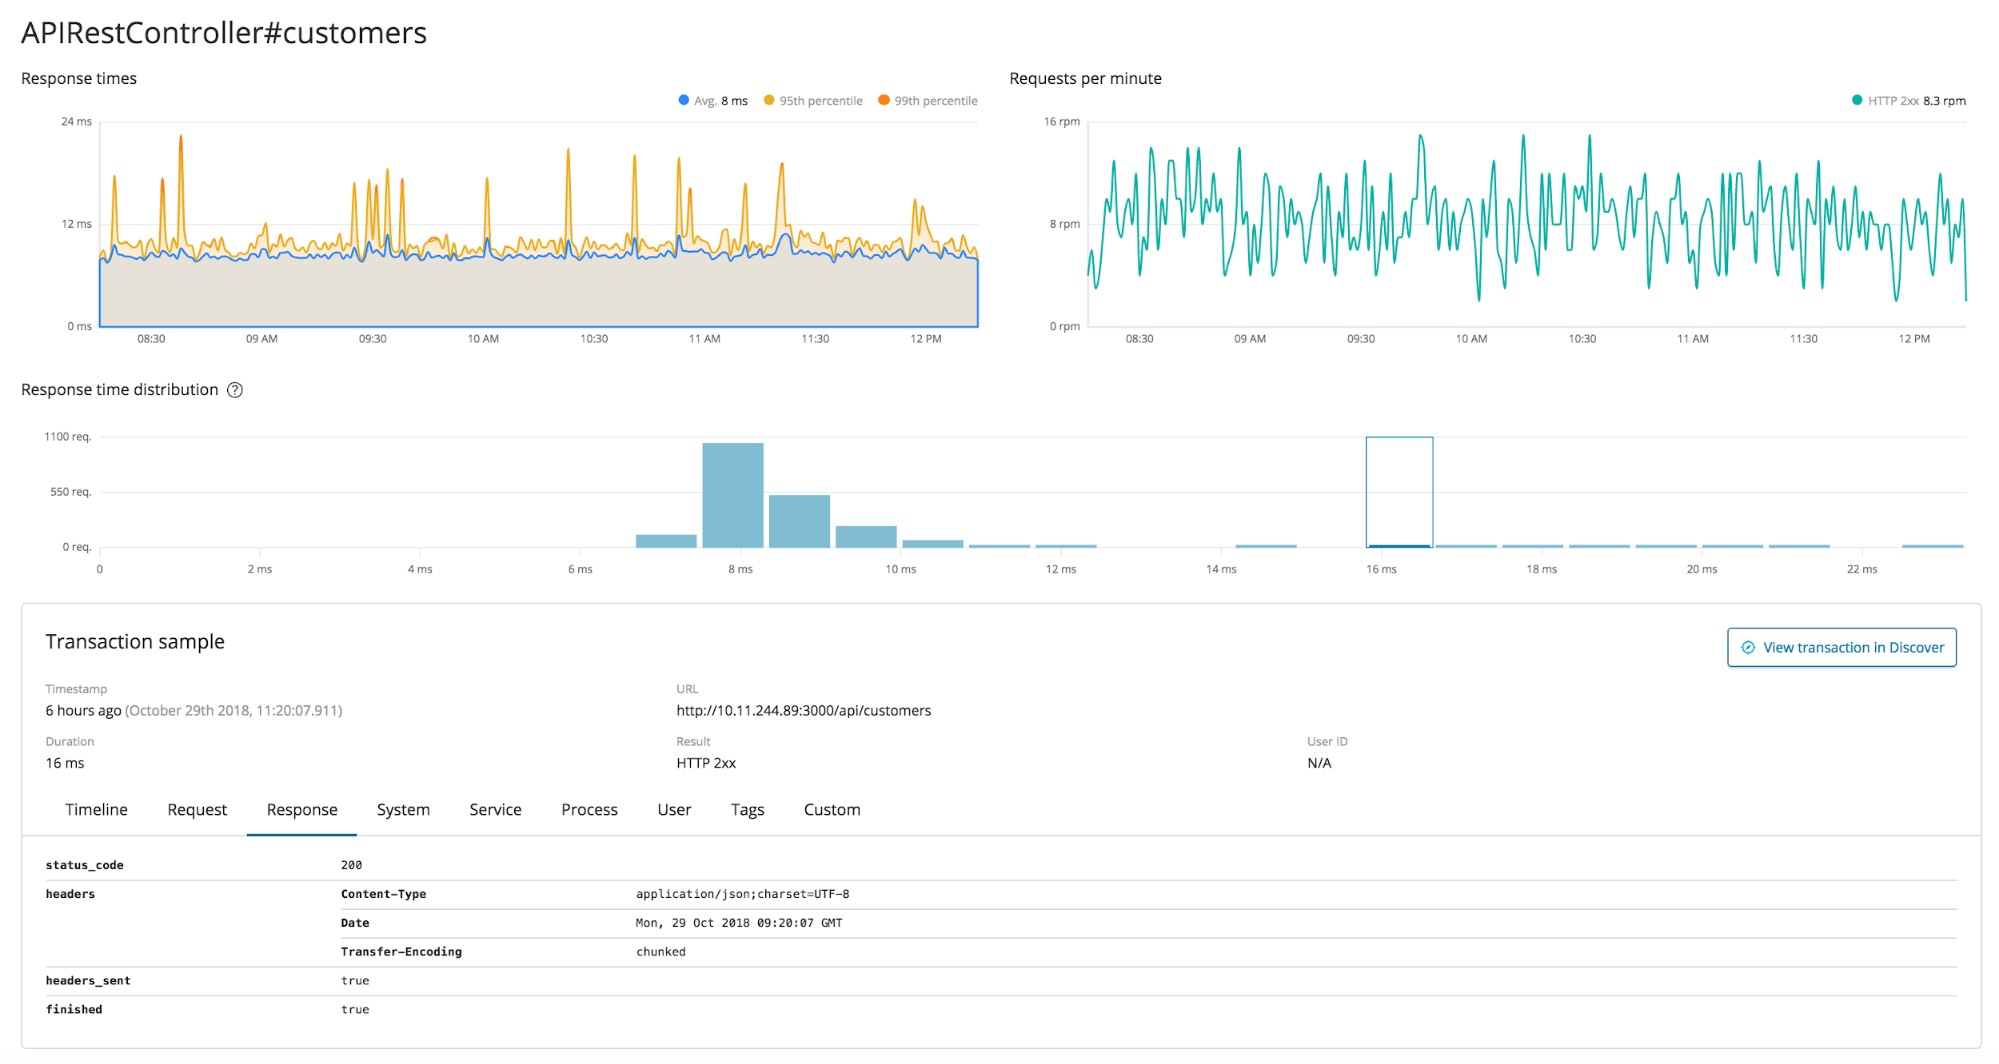
Get a high-level overview of your Java applications, and drill down to see how your Servlets or Spring Controllers are doing individually:
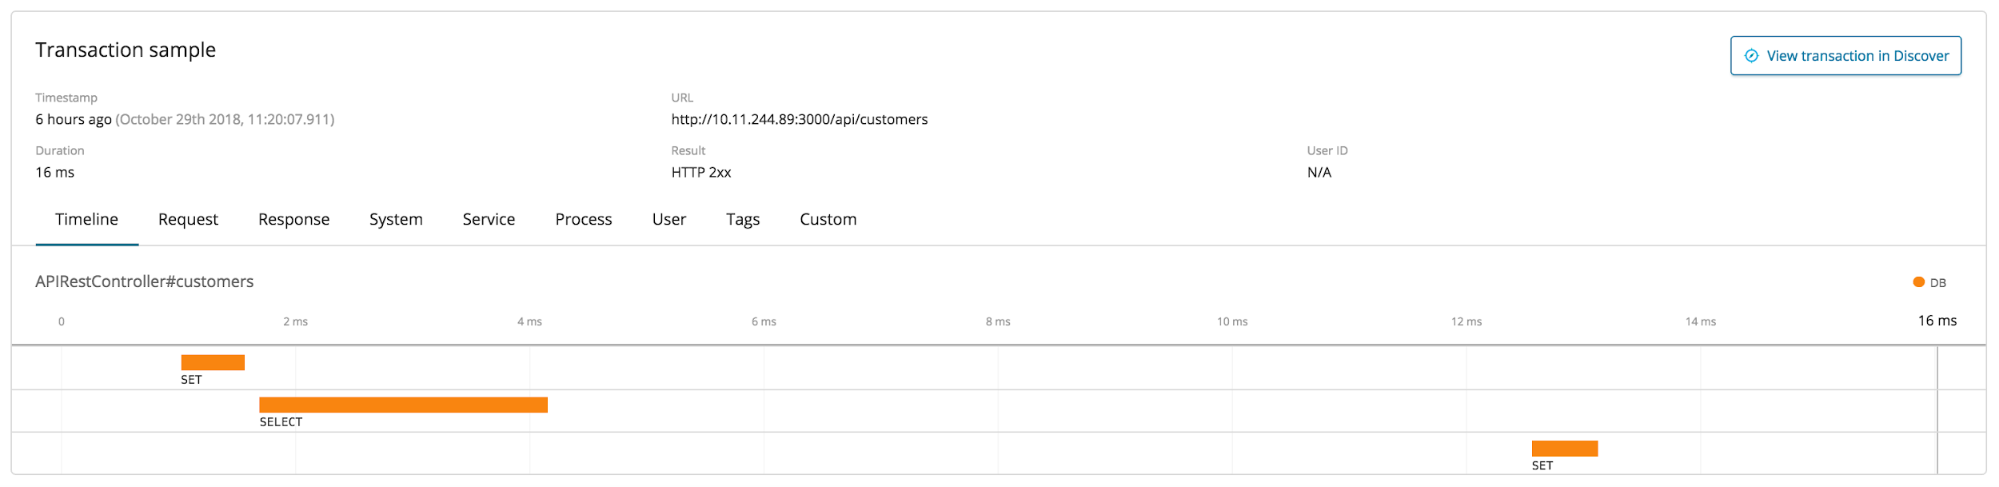
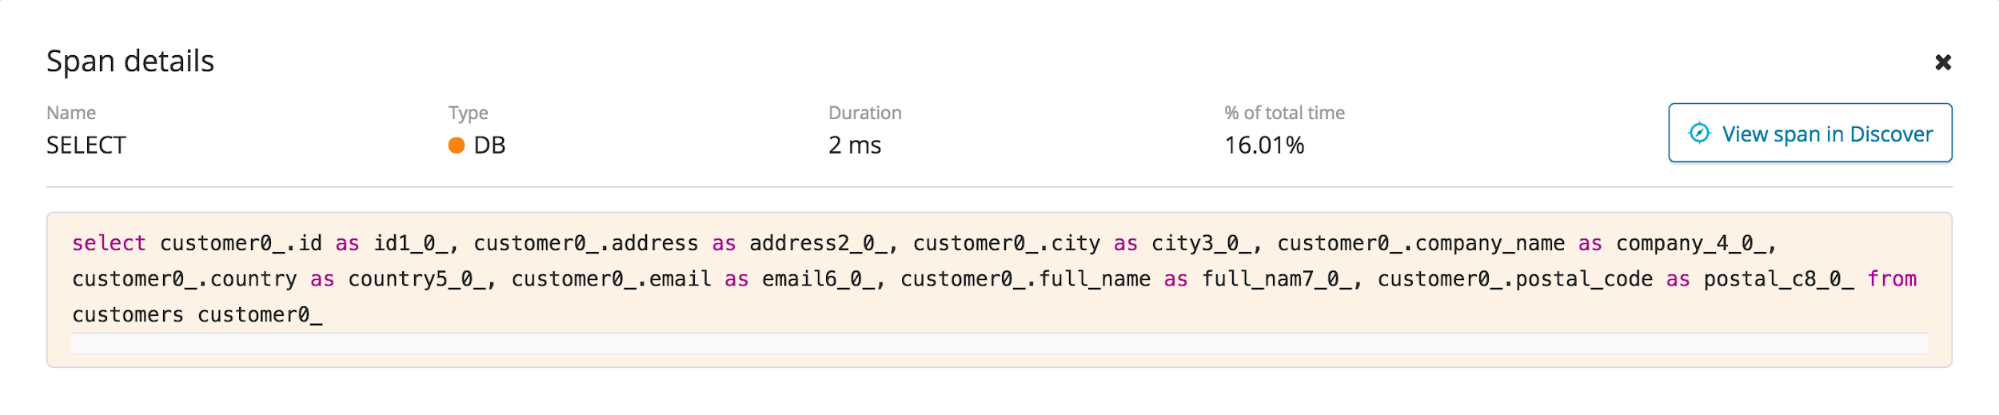
Data Store Visibility
Using JDBC or Elasticsearch? Learn where your Java application spends time on DB calls, which queries take longest and find out what errors they produce. You might be surprised what kind of queries your ORM mapper generates!
Networking Visibility
The Java agent also records how long your application is spending on external HTTP calls, so you can tell how much time is spent waiting for services out of your control.
Distributed Tracing
If your Java application is just one component in a multi-service setup, your traces will include data collected from any caller and callee that have an APM agent installed on them as well. As long as you are using one of the supported networking frameworks, the agent makes sure that it passes correlation IDs along so that you can see which services are involved in serving a request and which one is to blame when the request was slow. You can read more about distributed tracing in the Elastic APM 6.5.0 release announcement.
Enrich and Extend
For anything you want and don’t get out of the box
Is your Java application not using any of the supported technologies? Do you want better visibility to specific parts of your internal code? No worries, we provide the infrastructure that can help you trace virtually anything.
Customize your APM solution using our API
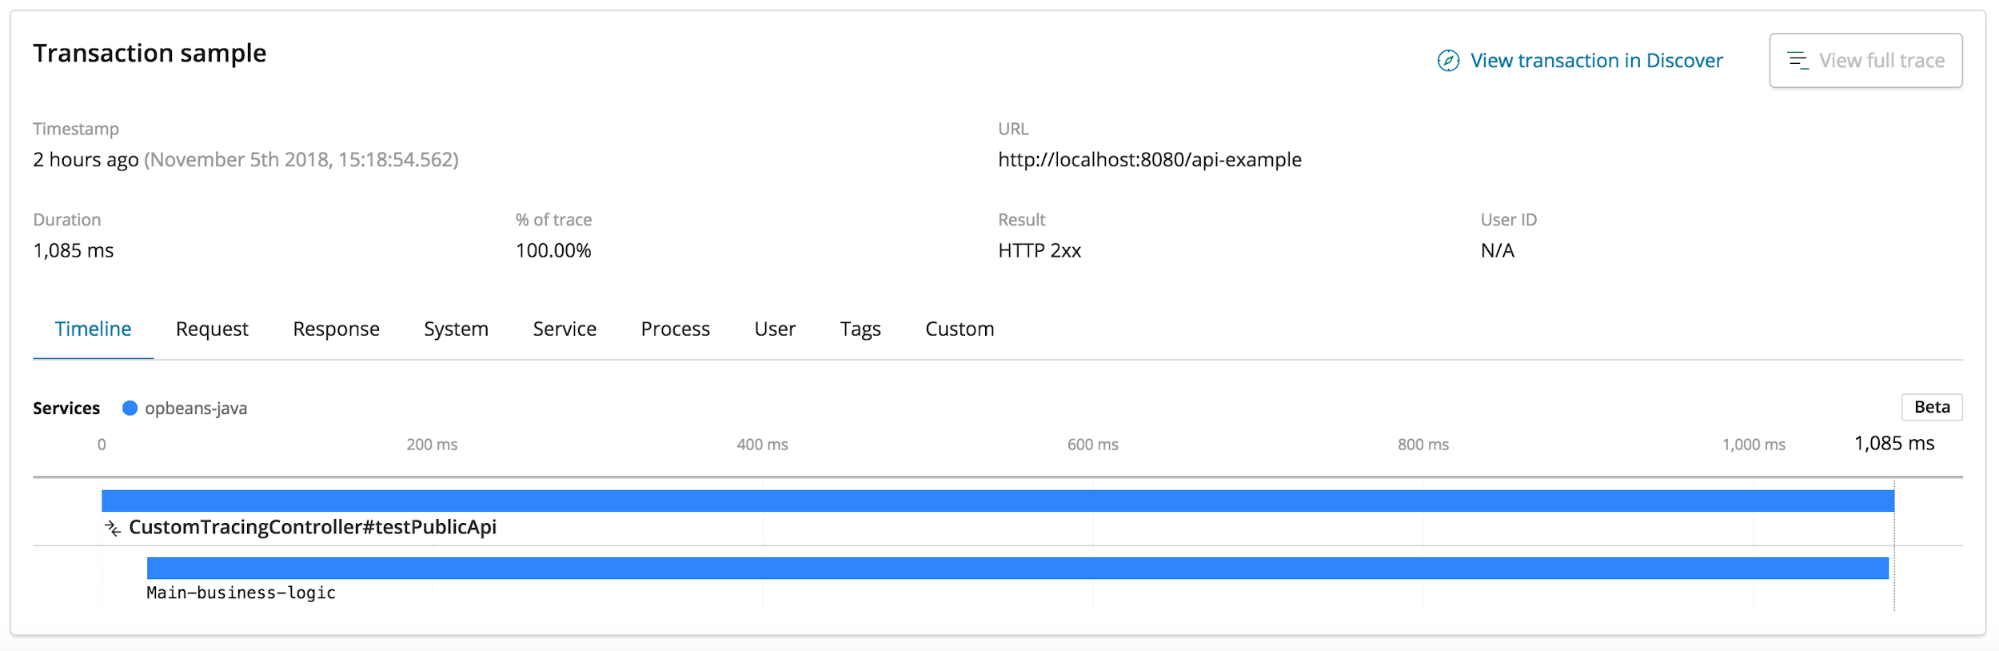
You can trace any method you wish using our public API. This API lets you customize and manually create spans and transactions, as well as track errors.
For example, our annotations API can be used as follows:
import co.elastic.apm.api.CaptureSpan;
import co.elastic.apm.api.ElasticApm;
import co.elastic.apm.api.Span;

public class MyImportantBusinessLogic {

    @CaptureSpan("Main-business-logic")
    public void myVeryImportantMethod(String someInfo) {
        ElasticApm.currentSpan().addTag("info", someInfo);
        // My important logic comes here
    }
}
To get your code show up as a span:
In order to use the public API in your code, you can declare a dependency to the apm-agent-api artifact, which is available on Maven Central.
OpenTracing API Support
You can also use our OpenTracing bridge to create Elastic APM Transactions and Spans, using the OpenTracing API. It translates the calls to the OpenTracing API to Elastic APM and thus allows for reusing existing instrumentation.
Mixing and matching the auto instrumentation capabilities of the Elastic APM agent with explicit instrumentation using OpenTracing is supported seamlessly: You can use the OpenTracing API to customize the spans Elastic APM creates automatically, enhance the auto instrumentation with your custom spans or disable the auto instrumentation capabilities and use the OpenTracing API to instrument your application manually.
This is one example showing how to use the OpenTracing API to trace custom methods:
import co.elastic.apm.opentracing.ElasticApmTracer;
import io.opentracing.Scope;
import io.opentracing.Span;
import io.opentracing.Tracer;
import io.opentracing.log.Fields;

public class MyBusinessLogic {
    private final Tracer tracer = new ElasticApmTracer();
    public void myVeryImportantMethod(String someInfo) {
        Span span = tracer.buildSpan("Main-business-logic").start();
        try (Scope scope = tracer.scopeManager().activate(span, false)) {
            // My important logic comes here
        } catch(Exception ex) {
            Tags.ERROR.set(span, true);
            span.log(Map.of(Fields.EVENT, "error", Fields.ERROR_OBJECT, ex, Fields.MESSAGE, ex.getMessage()));
        } finally {
            span.finish();
        }
    }
}
This creates your OpenTracing span as a child of the span created by the auto instrumentation of the Elastic APM agent.
What’s next?
So far we have been focusing on traditional thread-per-request execution models. But more and more applications use reactive frameworks to benefit from the scalability gains this model provides. In the future, we will provide better integration and auto instrumentation for those frameworks. Another area we will focus on is to make the integration of logs, metrics, and traces more seamless.
We'd like your feedback.
If we don't support your favorite framework or application server yet, make sure to participate in the Java agent survey to help shape its future.
Try it out with your Java application today tell us about your experience in the Discuss forum. If you liked it, we'd be happy get a start on GitHub.