Try out vector search for yourself using this self-paced hands-on learning for Search AI. You can start a free cloud trial or try Elastic on your local machine now.
Is it time for Semantic Search Ops?
Whether you're a veteran search engineer looking to explore the new AI features or an ML expert who wants more of the search infrastructure to enhance semantic similarity models - making the most out of this intersection of fields may require getting familiar with some new concepts.
While Elasticsearch provides some quick startup guides like the ELSER example notebook, when you are looking to scale your inference process, more configuration options are introduced.
In this blog, we will take a look at potential bottlenecks and ways to mitigate growing pains when dealing with more complex workloads.
Following the process of deploying a large language model in your environment, here are a few steps to pay attention to.
Before downloading the model
ML node size
The first step to building a project in Elasticsearch with NLP models is to set up the right infrastructure for deploying the models.
The correct ML Node configuration can be the first potential bottleneck, so ensure you are picking the appropriate size for your desired outcome.
The recommended minimum size:
If deployment autoscaling is turned off, the minimum dedicated ML node size for deploying and using the ELSER model is 4 GB; and 16 GB for natural language processing models.
Turning on autoscaling is recommended because it allows your deployment to dynamically adjust resources based on demand.
See docs.
Troubleshooting scenarios you may encounter:
| Potential Bottleneck | Error Message | Solution |
|---|---|---|
| ML Node is not big enough | ApiError(429, 'status_exception', 'Could not start deployment because no ML nodes with sufficient capacity were found') | Ensure you choose an appropriate size for your ML Node, and ideally enable autoscaling so your deployment can scale when faced with additional requests. |
| Autoscaling limit is not high enough | Autoscaling limits reached. To continue experiencing optimal performance, we recommend increasing your maximum size per zone for the topologies: Machine Learning. | There are also cases where the ML Node is big enough to download the model, but a large throughput of inference calls can still overload the system if not configured properly. Increase size, ensure your allocatoin uses all avialable CPUs, or use smaller data batches to mitigate. |
Model Configuration
Larger node sizes also allow for more flexibility when choosing the number of allocations and threads for your models.
You need one CPU or vCPU per thread, so for example 8 CPUs would allow you to have 1 allocation with up to 8 threads, up to 8 alloctions with 1 thread each, or other permutations as long as:
number_of_allocations * threads_per_allocation <= number of available CPUs.Multiple models deployed on the same ML node will be sharing these resources, therefore you can allocate your CPUs amongst them as needed by configuring each model's maximum access.
Additionally, each allocation of a model deployment has a limited queue for inference requests. When too many calls to the same deployment are made and the queue fills up, all following requests are rejected. Consider using dedicated deployments to prevent this situation.
For each deployment and use case you should consider the following parameters:
| Parameter | Function | Value |
|---|---|---|
| number_of_allocations | Increases throughput by allowing more inference requests that can be performed in parallel. This will in turn improve ingest performance. | Defaults to 1; but you should change this so you use all available CPUs. |
| threads_per_allocation | Improves the speed of each inference request, and therefore search. | Defaults to 1; but you should change this so you use all available CPUs. |
| queue_capacity | Controls how many inference requests are allowed in the queue at a time. When the number of requests exceeds the total value, new requests are rejected with a 429 error. | Defaults to 1024. Max allowed value is 1000000. |
The value of this setting must not exceed the number of available allocated processors per node.
See benchmarking information on how performance increases for ELSER with the number of allocations as an example.
While deploying the model
Once the model has been downloaded on your cluster, you can start deploying it, taking into account the previously discussed parameters. At this stage, you can consider using a unique deployment_id, if you're planning on deploying multiple instances of the same model.
Some potential bottlenecks or errors you can encounter at this stage:
| Bottleneck | Explanation / Error message | Solution |
|---|---|---|
| Timeouts during deployment | Without specifying the wait_for parameter, it defaults to started, which means you will only get a response when the model has finished downloading and is successfully deployed. However, this process will be quite lengthy, depending on model size, and since the timeout parameter also defaults to only 30s, this can often result in an error. | Use wait_for="starting" instead, and/or increase the waiting time before throwing an error: timeout="3m" |
| Not running the steps sequentially (see rows below for specific examples) | Running commands before the previous step has finished running will result in errors: | Check on the status of your model with status = client.ml.get_trained_models(model_id=".elser_model_2", include="definition_status") |
| Trying to deploy model before it has been fully downloaded | Model definition truncated. Unable to deserialize trained model definition [.elser_model_2] | You should only attempt to deploy the model when status["trained_model_configs"][0]["fully_defined"] == True |
| Trying to run inference on a model that has not been fully deployed | 404, 'resource_not_found_exception', 'Could not find trained model [.elser_model_2]' | You can start making calls to the model when status["trained_model_stats"][0]["deployment_stats"]["state"] == "started" |
Before running inference
Once the model is deployed, you can start making inference calls to it. This can be done via the Inference API:
This inference command also has a default timeout of 10 seconds, which is sufficient when generating embeddings for a few documents at once.
However, for most real use cases there will be a lot of documents that need to be processed; for example, creating embeddings for each document in a large index to enable semantic search capabilities.
You can increase the timeout:
However, as mentioned in the previous sections, the model will also have a maximum queue of documents it will accept, depending on the number of allocations, or how many different tasks are sent to the same deployment. So even with a bigger timeout, this method might still not be sufficient for large throughputs.
Another alternative, is to create ingestion pipelines for the inference process. You can also use different deployments for different pipelines: one for generating embeddings when ingesting new data, and one for running inference while searching.
Pipelines also allow you to set custom actions such as renaming fields or using multiple models for different tasks by adding elements in the processors list. You can also run longer tasks in the background or on a recurring schedule.
| Bottleneck | Solution |
|---|---|
| Timeout | Similarily to the previous steps, the lengthy pipeline process can cause a timeout. Use the wait_for_completion = False parameter. |
| Waiting for pipeline to finish | You can use the task_id you get as a response from the reindex function to track the pipeline progress later via client.tasks.get(task_id=task_id). This ID is generated when the wait_for_completion argument is used. |
Monitoring and adjusting
Once you deployed the model and start using the inference service, you can look at the performance of your configuration. Often, this is the best way to determine the appropriate parameters for your particular use case, and adjust as needed until achieving the desired performance.
Taking a simple example, if you deploy a model without configuring any of the settings discussed above, these will be the default values assigned:
Let's say that after sending a large queue of documents to this model via an inference pipeline, we notice some warning signs in the thread allocation. The endpoint
GET _nodes/hot_threads
responds with
ml.allocated_processors=16
100.0% [cpu=3.5%, other=96.5%] cpu usage by thread
The ML node has 16 allocated processors, but we are only leveraging 1 of them with our one instance of the model. Furthermore, the high percentage of utilization reported under other rather than cpu related tasks means there is a lot of waiting and redundancy in the process, and our documents are spending most of the time being queued.
To optimize performance, you should use all available cores.
You can see more metrics in the Trained Models UI as well or through the command:
GET _ml/trained_models/_stats
Here you can see more useful information like average_inference_time_ms, number_of_pending_requests, or peak_throughput_per_minute.
As an ilustration, here are two models deployed on the same ML node, running inference on the same pipeline and data, but with different allocation strategies. You can see the inference time is almost halved for the configured model.
| Model ID | Allocation | Average Inference time |
|---|---|---|
| elser_inference_configured | 3 * 8 | 67.80 milliseconds |
| .elser_model_2 | 1 * 1 | 115.58 milliseconds |
Conclusion
As both a good and potentially hard thing, there are multiple flexible and modular ways to build up your inference architecture to suit your project. Building the best approach for each use case will also go beyond choosing the right configuration or infrastructure setup. You can read more about how a models's retrieval optimization or even data processing decisions such as chunking strategies also influence performance.
Elasticsearch brings together amazing out-of-the-box capabilities and provides the customization options and guidance to help you build the best semantic search solution.
Related Content
July 16, 2026
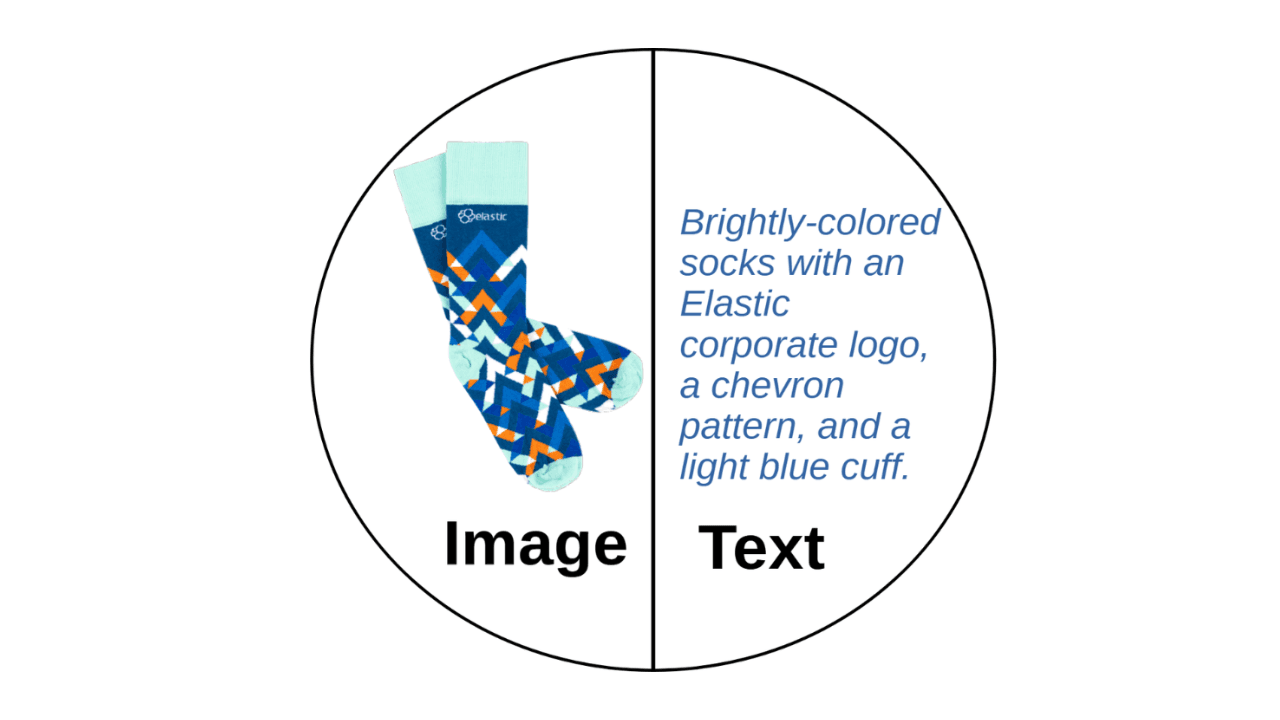
A picture is worth 1.5x the words: What we learned benchmarking product search embeddings
We benchmarked two embedding models on 5,000 real products and found that combining image and text beats either alone by up to 50%. Here's the data and the model that won.

July 13, 2026
The disk that never woke up: what actually decided our Qdrant vector search benchmark rematch
On the same hardware, Elasticsearch and Qdrant land in the same range at 56 QPS. The io_uring disk scorer and memory claims turned out to be the two things that mattered least.

July 21, 2026
4 NVIDIA AI tasks, 1 Elasticsearch API: Embeddings, chat, completion, and rerank
Set up NVIDIA hosted models in Elasticsearch with one API key and a model ID. No custom integration code needed.
July 10, 2026
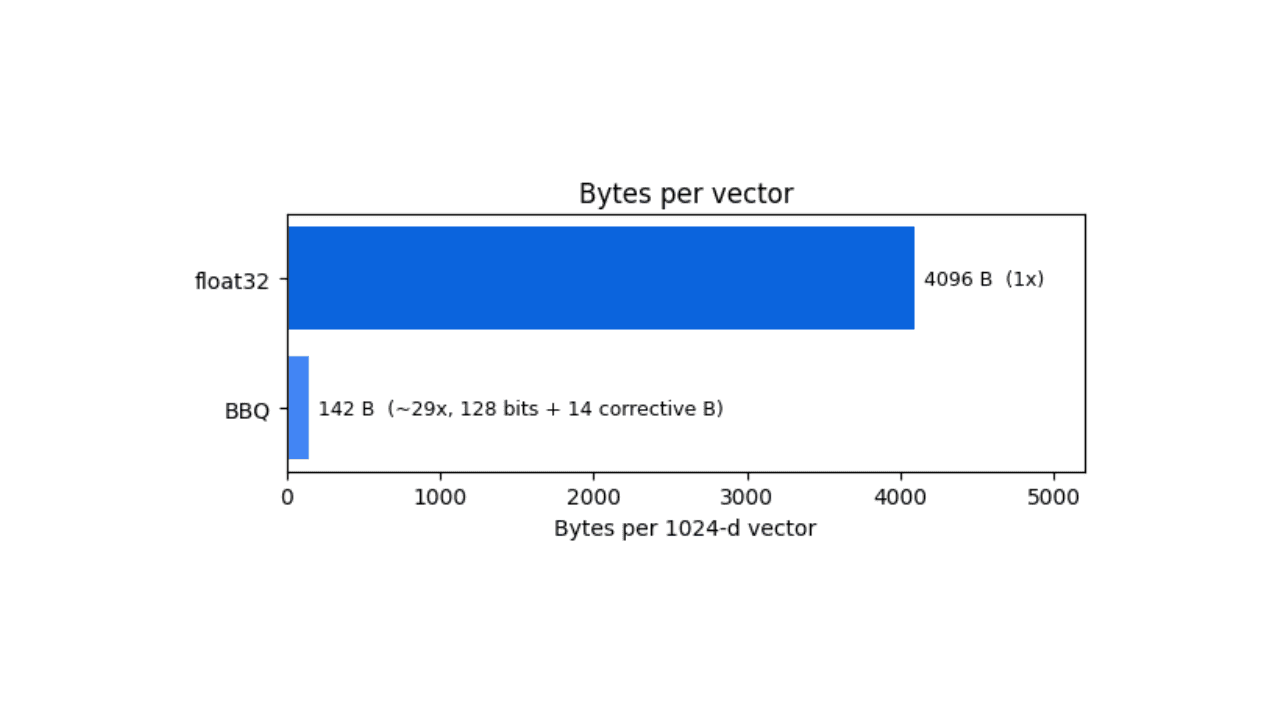
How BBQ shrinks Jina v5 embeddings by 29x without losing recall in Elasticsearch
A hands-on test comparing BBQ and float32 vector indices in Elasticsearch, measuring memory, disk and recall@10 across five languages.
July 7, 2026
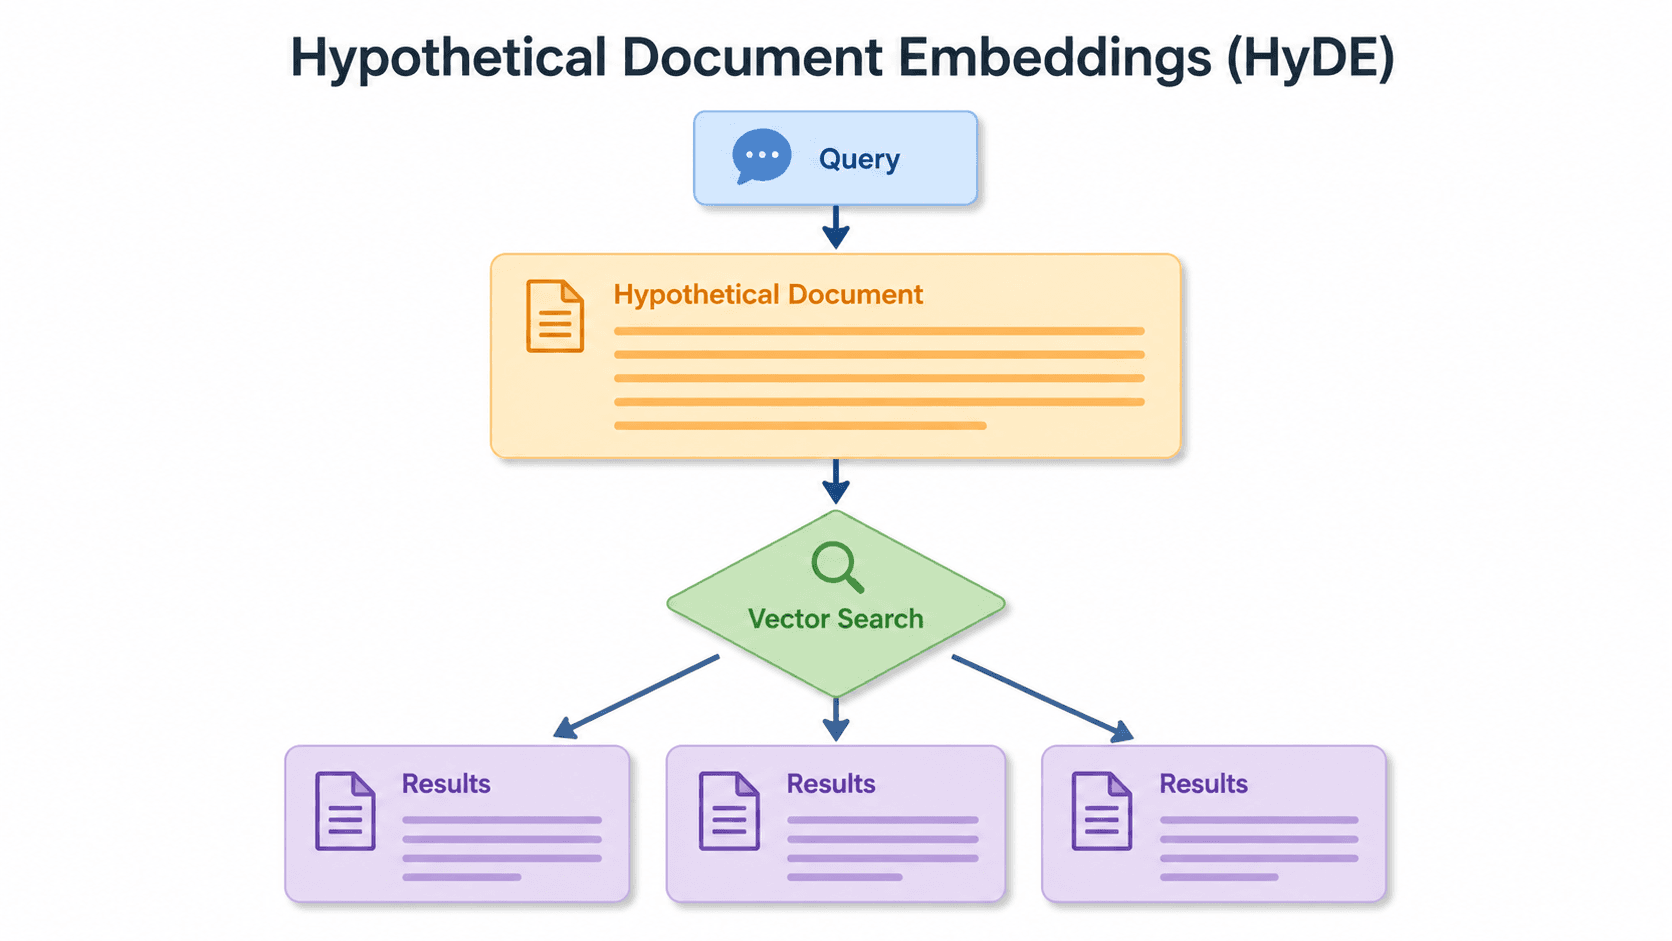
Short queries, formal documents: how HyDE improved semantic search precision by 50% in Elasticsearch
HyDE boosts semantic search precision and recall by 50% on short queries. Here's how to implement it in Elasticsearch with the Inference API and semantic_text.