What’s new in 7.16
editWhat’s new in 7.16
editHere are the highlights of what’s new and improved in 7.16.
Other versions: 7.15 | 7.14 | 7.13 | 7.12 | 7.11 | 7.10 | 7.9 | 7.8 | 7.7 | 7.6 | 7.5 | 7.4
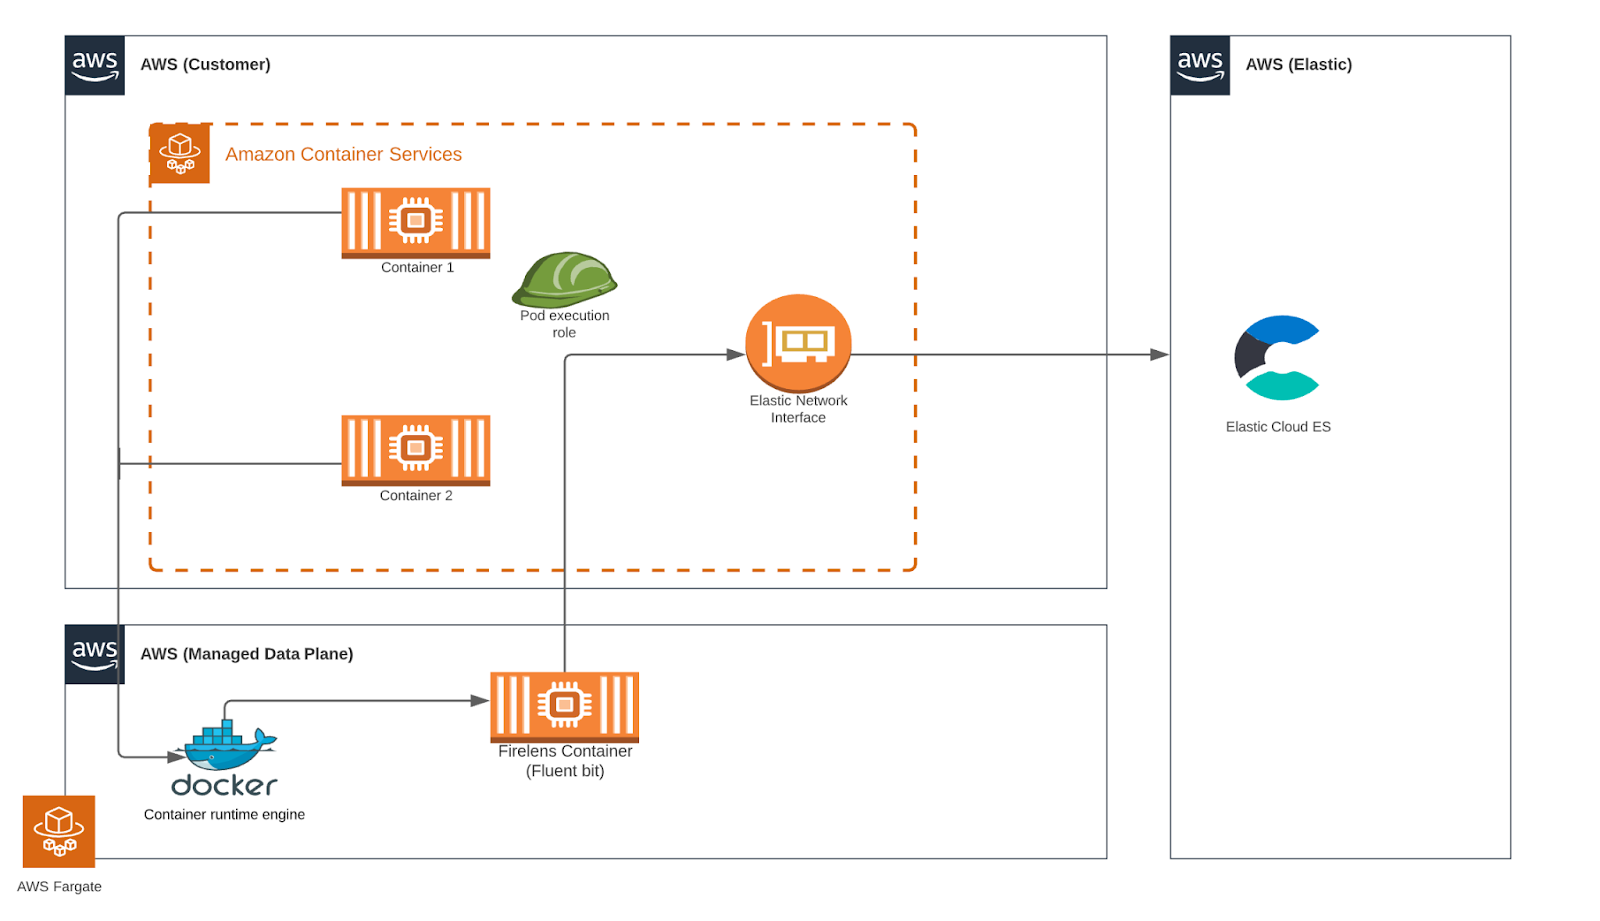
Turnkey data onboarding from AWS Fargate with FireLens
editWe are excited to announce the first native integration with Amazon Web Services (AWS) on Elastic Cloud, via AWS FireLens, a container log router for Amazon EC2 and AWS Fargate. You can now quickly and easily ingest container logs into Elastic Cloud within seconds using FireLens and Fluent Bit without needing to install and manage standalone data shippers (see amazon-ecs-firelens-examples). The simplified data architecture also reduces operational complexities.
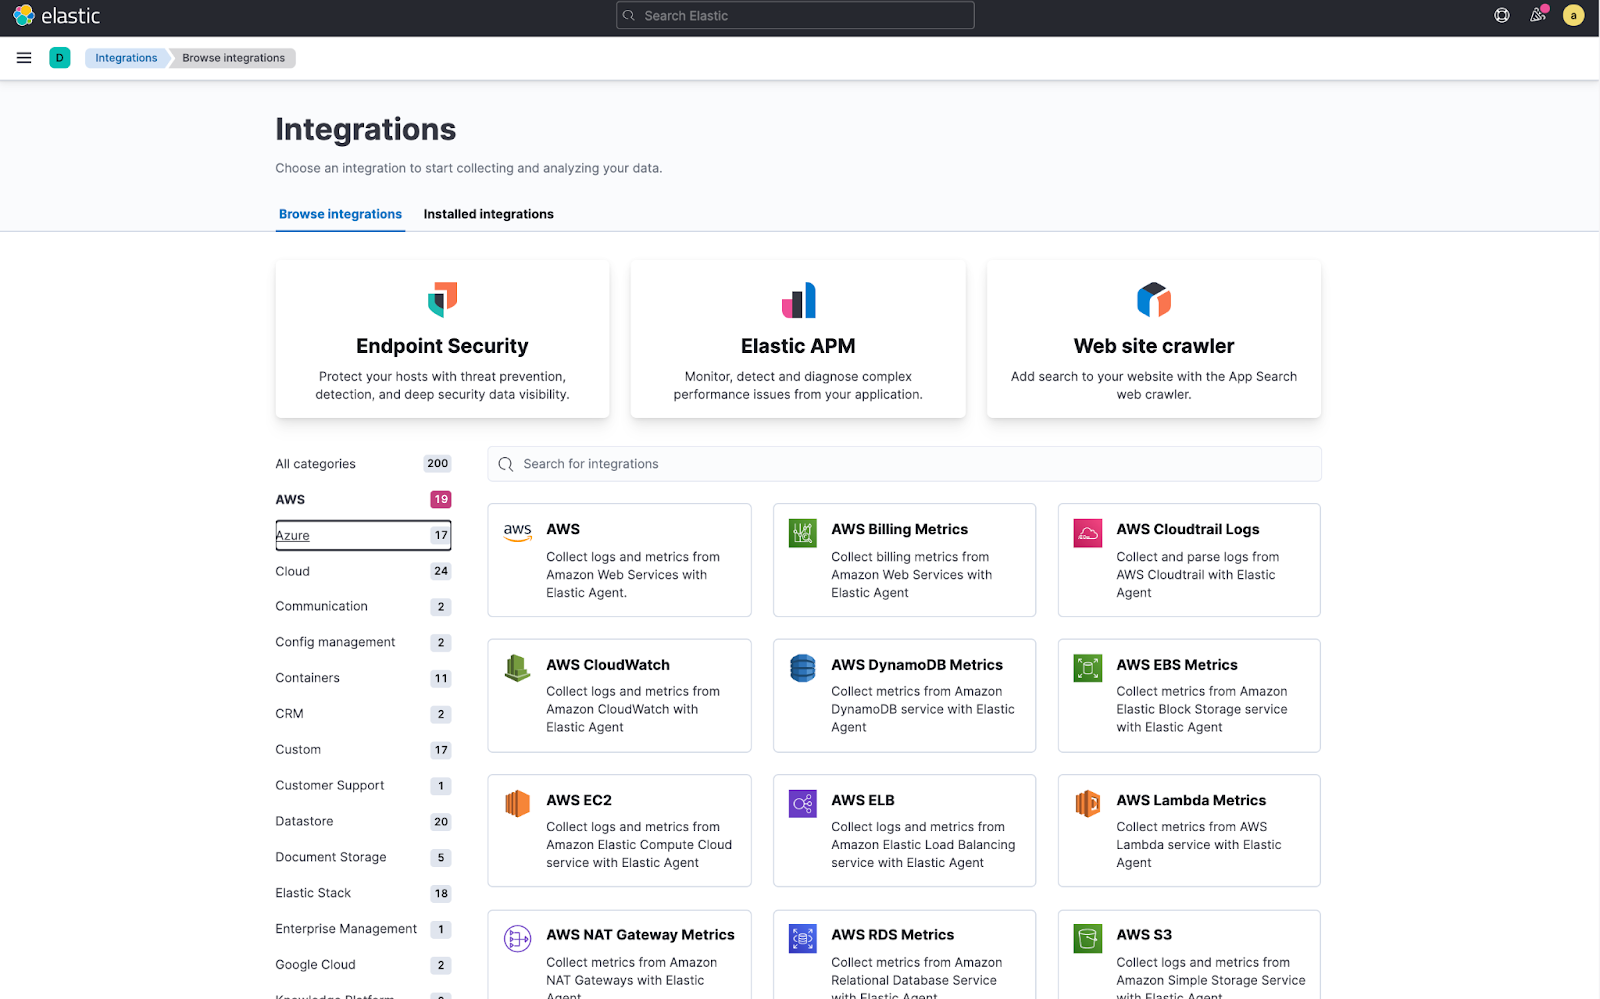
Unified integrations
editWith 7.16 it is now much easier to discover the 200+ integrations we offer and use them to onboard data, regardless of the underlying technology behind the integrations.
Key Observability integrations are now GA
editYou can now start using Elastic Agent integrations for the majority of key Observability use cases, with the benefits of central management, scalability, security, and one-click integration.
Integrations which are now generally available (GA) include:
- GCP
- Docker, Kubernetes, Zookeeper
- Apache, Apache Tomcat
- Cassandra, MongoDB, MySQL, Postgres, Redis
- NATS, RabbitMQ
- Nginx, Nginx Ingress Controller, Traefik
- STAN
Self-managed Elastic Package Registry is now GA
editWe are pleased to announce the general availability (GA) of our self-managed Elastic Package Registry (EPR), an OCI compliant Docker image. The Elastic Stack needs to understand the external data sources and available data formats to integrate, collect, and visualize data using Elastic Agents. Today, Kibana receives this knowledge in the form of packages from a SaaS EPR endpoint. Self-managed EPR is a standalone server that will enable the distribution of integration packages just like the existing SaaS EPR in any infrastructure setting of your choice. We know you wanted to ensure that each component of your Elastic Stack is compliant with your organization’s policies, which may include:
- Operating in an air-gapped environment
- Not adopting software unless it is officially supported
- Discarding any software that cannot use custom certificates for communications
To remove all the hurdles from your integration journey with Fleet server and Elastic Agent, we are promoting our self-managed EPR to an officially supported GA status. It can now use your custom certificates to talk to Kibana and provide the out-of-box assets and documentation for all your desired integrations.
APM Server Integration in Fleet is now GA
editThis Fleet integration enables you to run an APM Server managed by Elastic Agent and Fleet. This integration uses the new data stream standard to store data.
Support span events in OpenTelemetry traces
editOpenTelemetry span events are now available in our APM traces. Span events (distinct from spans) are structured logs that execute too quickly to be worth capturing in a traditional span, but are nevertheless important to record, such as an application exception. You can now view these exceptions, and events attached to OpenTelemetry traces, bringing greater insight to application troubleshooting.
Introducing APM compressed spans (technical preview)
editThis improvement significantly reduces network and storage costs associated with storing APM spans for applications with excessive database or backend calls.
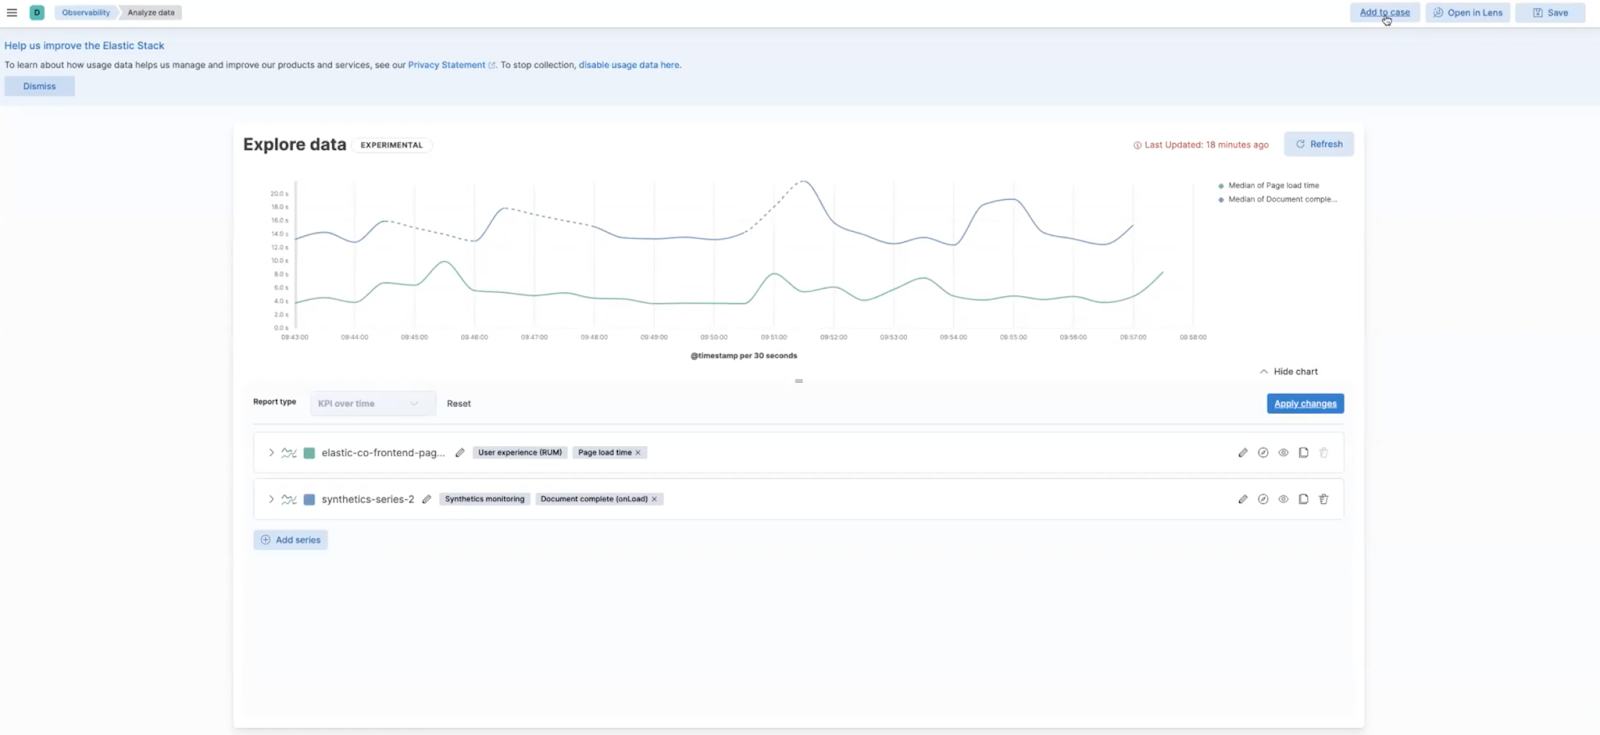
Observability Explore Data view is now GA
editHave you ever had a question that you wanted to use your raw data to answer? Whether you’re trying to validate a hypothesis or simply looking for “interesting” insights in your data, having a rich tool that enables this type of data visualization and manipulation is a critical part of any analytics solution. With an initial focus on RUM, Synthetics, and Mobile APM use cases, our new Exploratory View provides a focused data exploration experience for Observability users, removing the cognitive load and complexity from performing ad-hoc analysis.
Improvements in 7.16:
- User workflow improvements based on beta feedback
- Compare different time periods, different cohorts and even different data types
- Add visualisations to a case or open in Lens
- Open Case from Explore Data view
ServiceNow connector certification
editBy integrating Elastic Observability with ServiceNow, users can standardize and streamline incident management workflows to facilitate robust collaboration within and across ITOps and DevOps teams.
This is now easier than ever, thanks to newly certified apps on the ServiceNow Store for the ITSM, SecOps, and ITOM (new ITOM connecter just added for 7.16) workflow platforms. Upon connecting with one or more of these apps, Elastic users have two ways to automate incident generation:
- Case management integration (in technical preview for Observability) enables practitioners to escalate Elastic cases (including case details, data observables, analyst notes, and associated alarms) into ServiceNow incidents with just one click.
- Alerting integration enables admins to configure forwarding of individual Elastic alerts to ServiceNow and automate the creation of corresponding ServiceNow incidents.
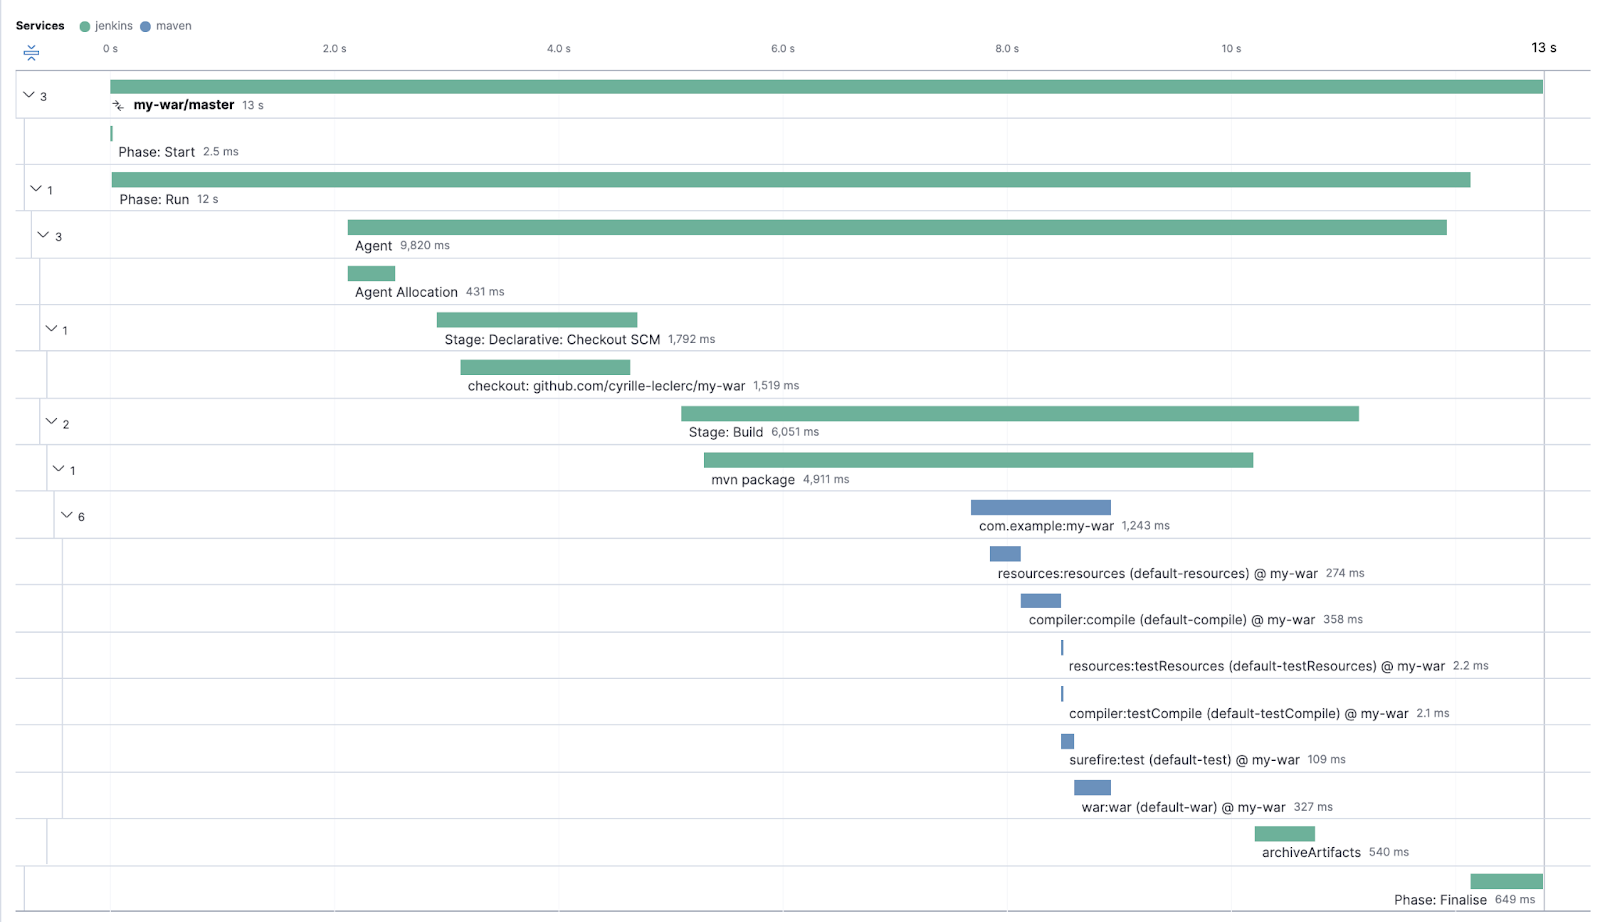
Introducing CI/CD Observability with Jenkins, Maven, and Ansible OpenTelemetry visibility
editAs part of Elastic’s commitment to innovation and leadership within the open source community, we have contributed OpenTelemetry-based CI/CD (Continuous Integration / Continuous Deployment) integration for Jenkins (GA), Ansible (GA), and Maven (technical preview).
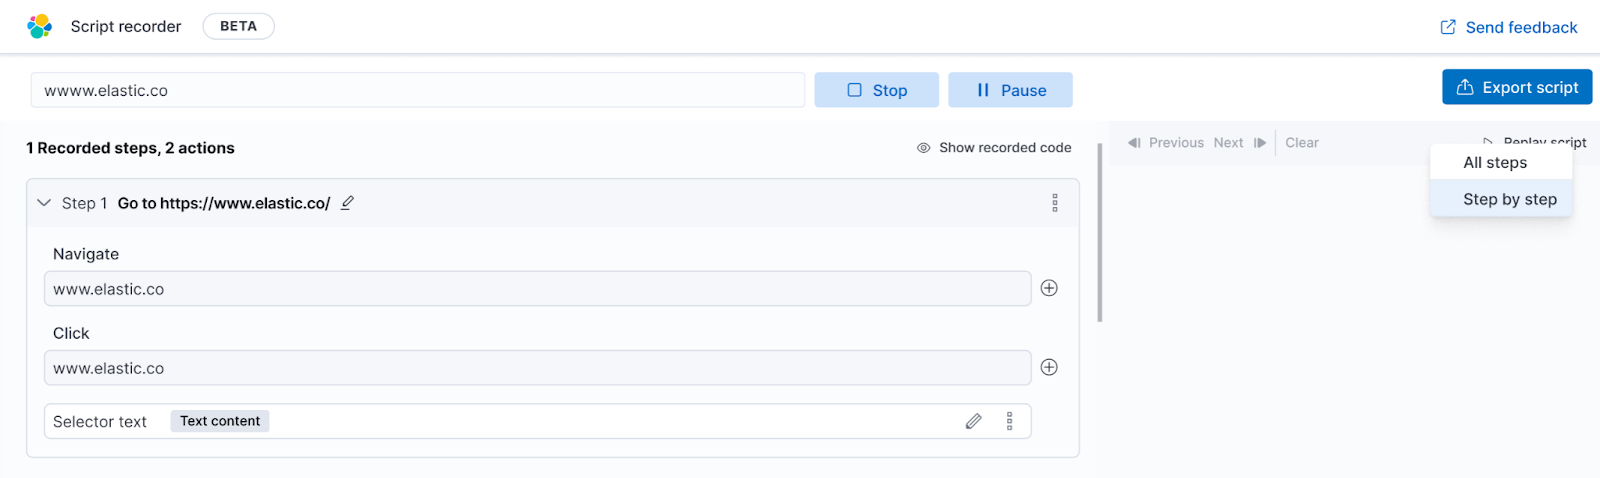
Introducing point-and-click script recorder for synthetics (technical preview)
editUsers with no coding experience can create synthetic monitoring scripts, and more advanced users can rapidly increase the pace of scripting by creating a framework with the recorder and then continuing to edit it in their local IDE.
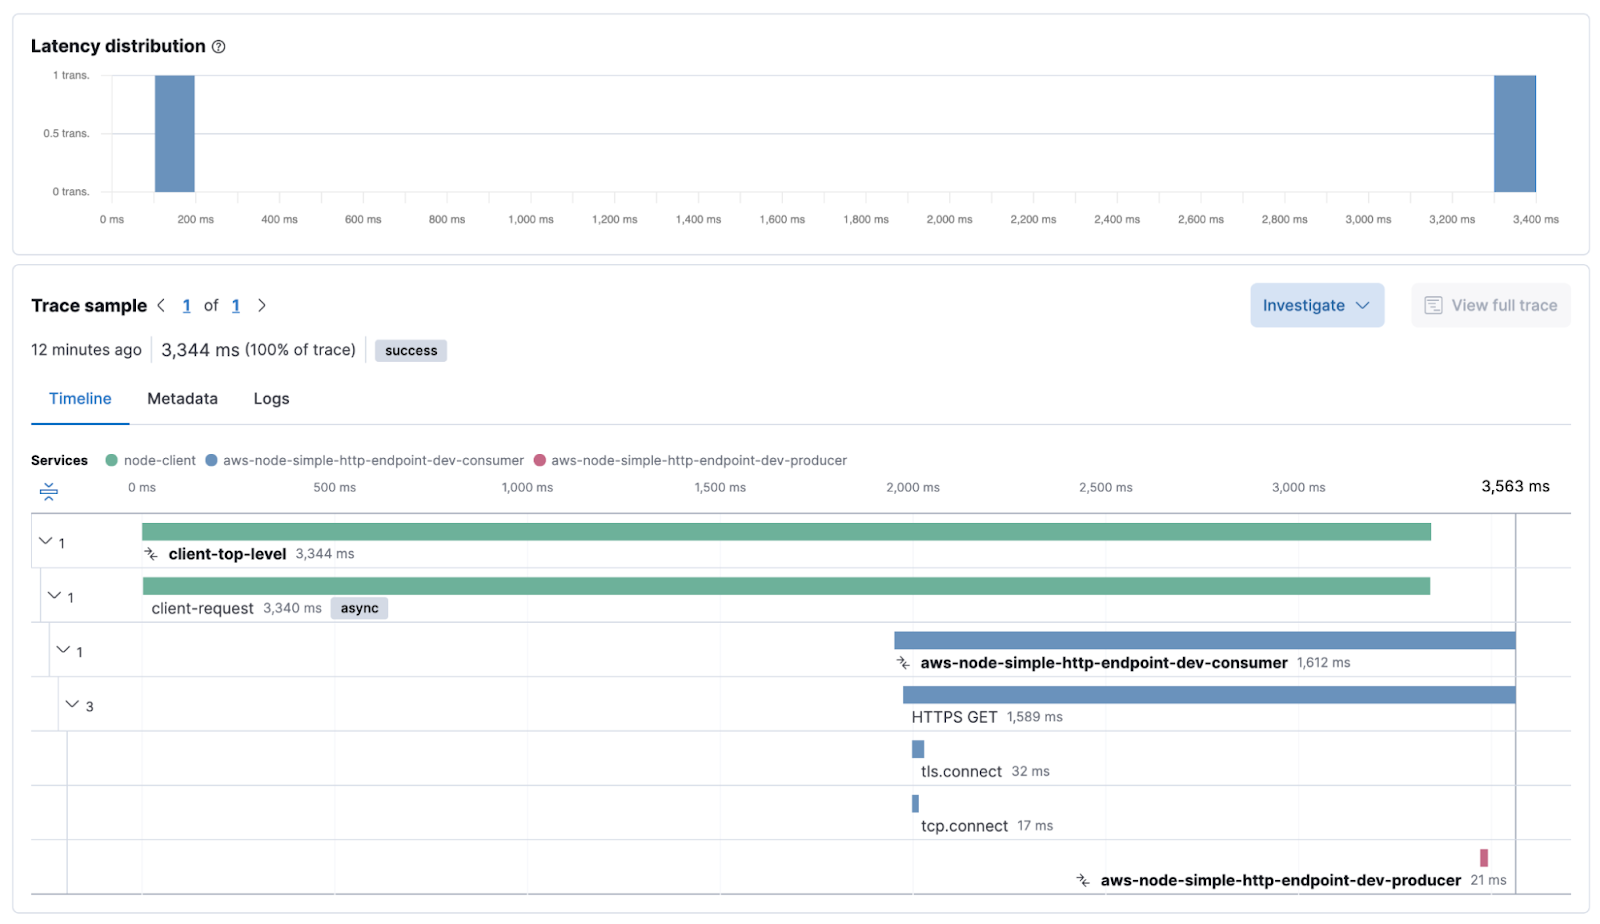
Introducing end-to-end tracing from serverless functions with AWS Lambda support in Elastic APM (technical preview)
editServerless applications are increasingly critical in modern cloud-native architectures. In 7.16 we introduced the ability to track the end-to-end performance of AWS Lambda functions as part of Elastic APM.
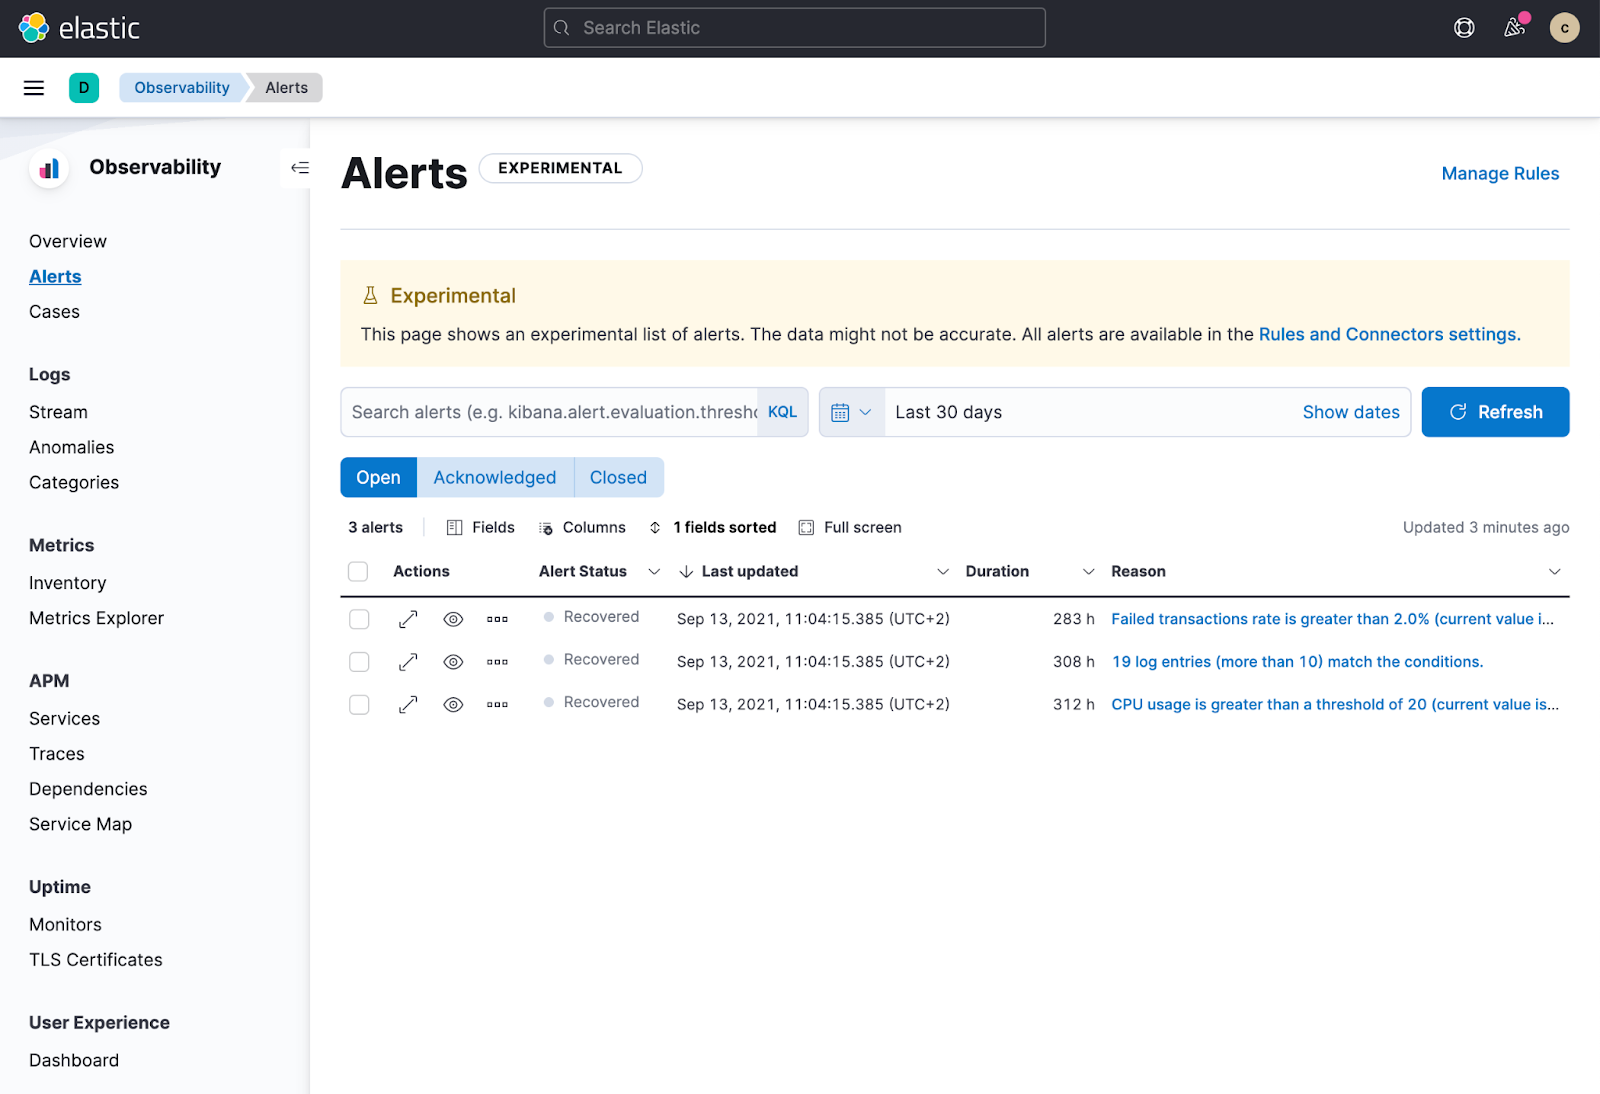
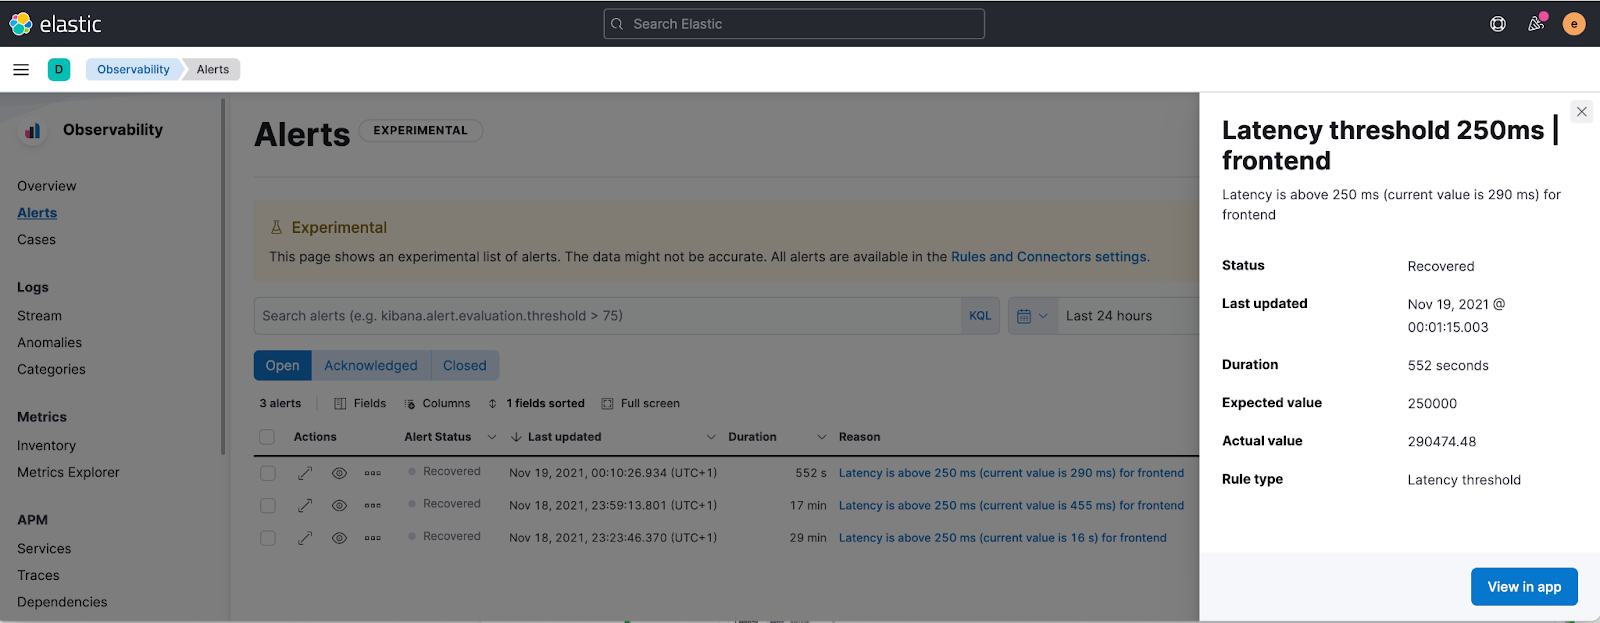
Introducing incident management workflow with Observability Alerts View (technical preview)
editIncident management is an important aspect of making observability data actionable. In 7.16 you can now perform alert triaging and investigation without having to use a separate user interface for this part of the workflow.
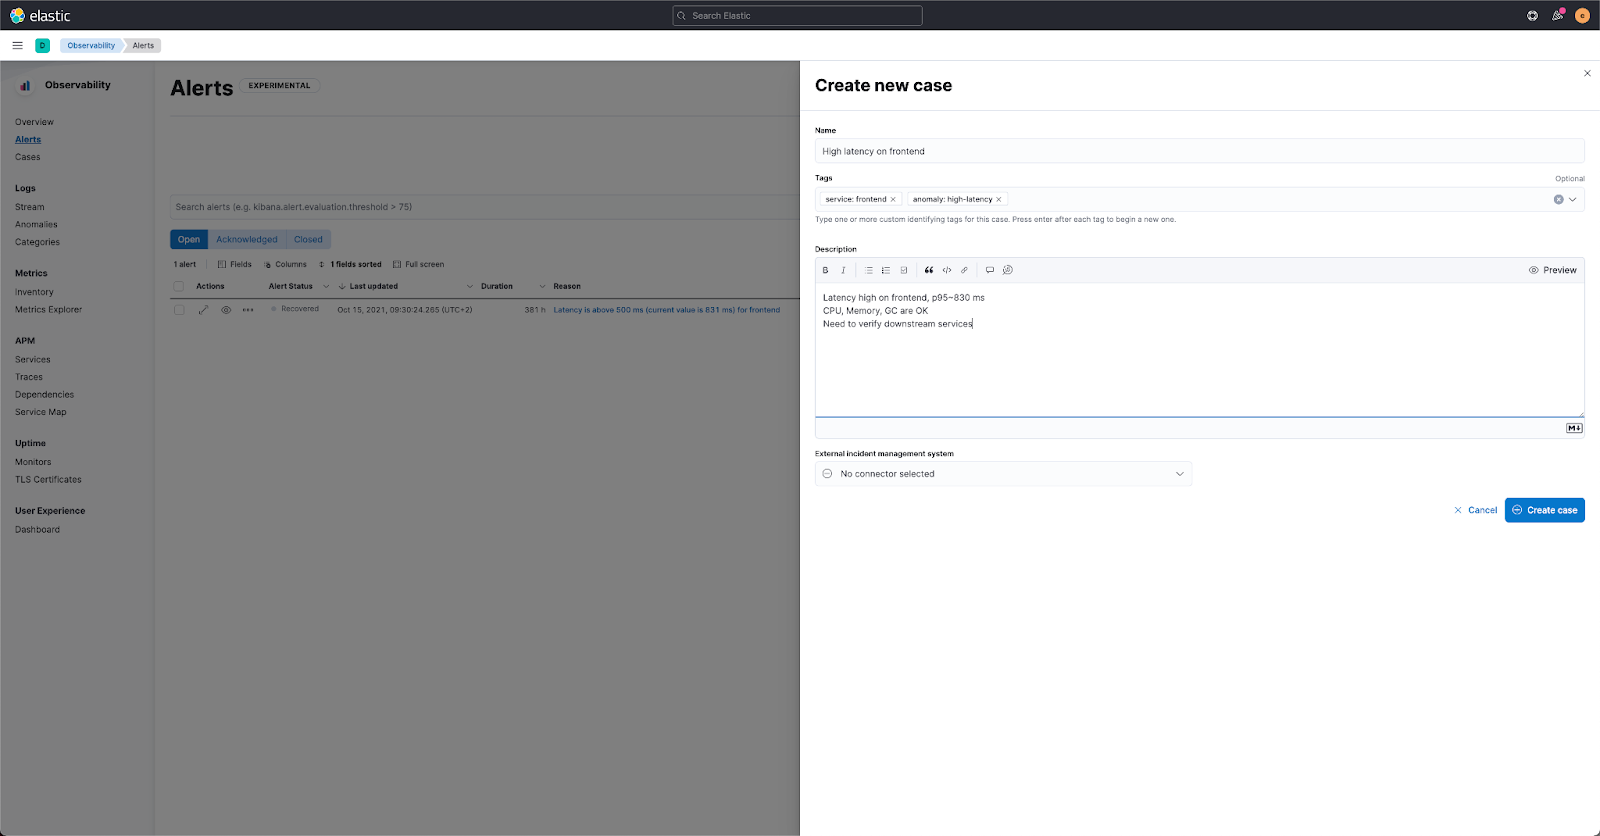
Introducing collaboration with Observability Cases (technical preview)
editCollaboration is an important part of troubleshooting and root cause analysis. In 7.16 Elastic Observability users can now collaborate using Cases without having to use a separate user interface for this part of the workflow.
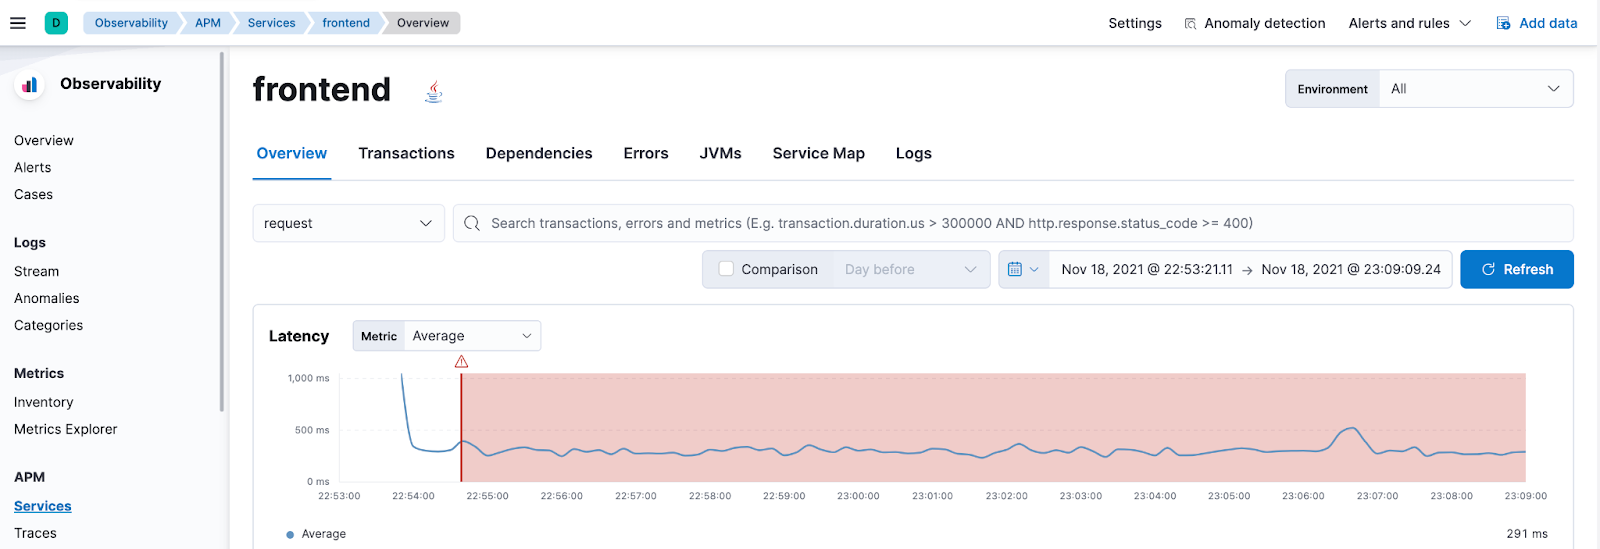
Introducing alerts in context in APM UI (technical preview)
editShowing alerts with better context makes them more actionable, and enables users to start troubleshooting the issue with greater ease. With 7.16 you can click View in app on an APM alert to be taken directly to the APM UI, with the alert annotating the time series chart at the point of occurrence. Users can click the annotation in the APM UI to view further details about the alert.
Alert annotations are displayed by default in the APM UI charts at the point of their occurrence. Regardless of whether users have previously seen those alerts, the annotations help provide richer context and ready reference on alerts in the time range they are currently viewing.

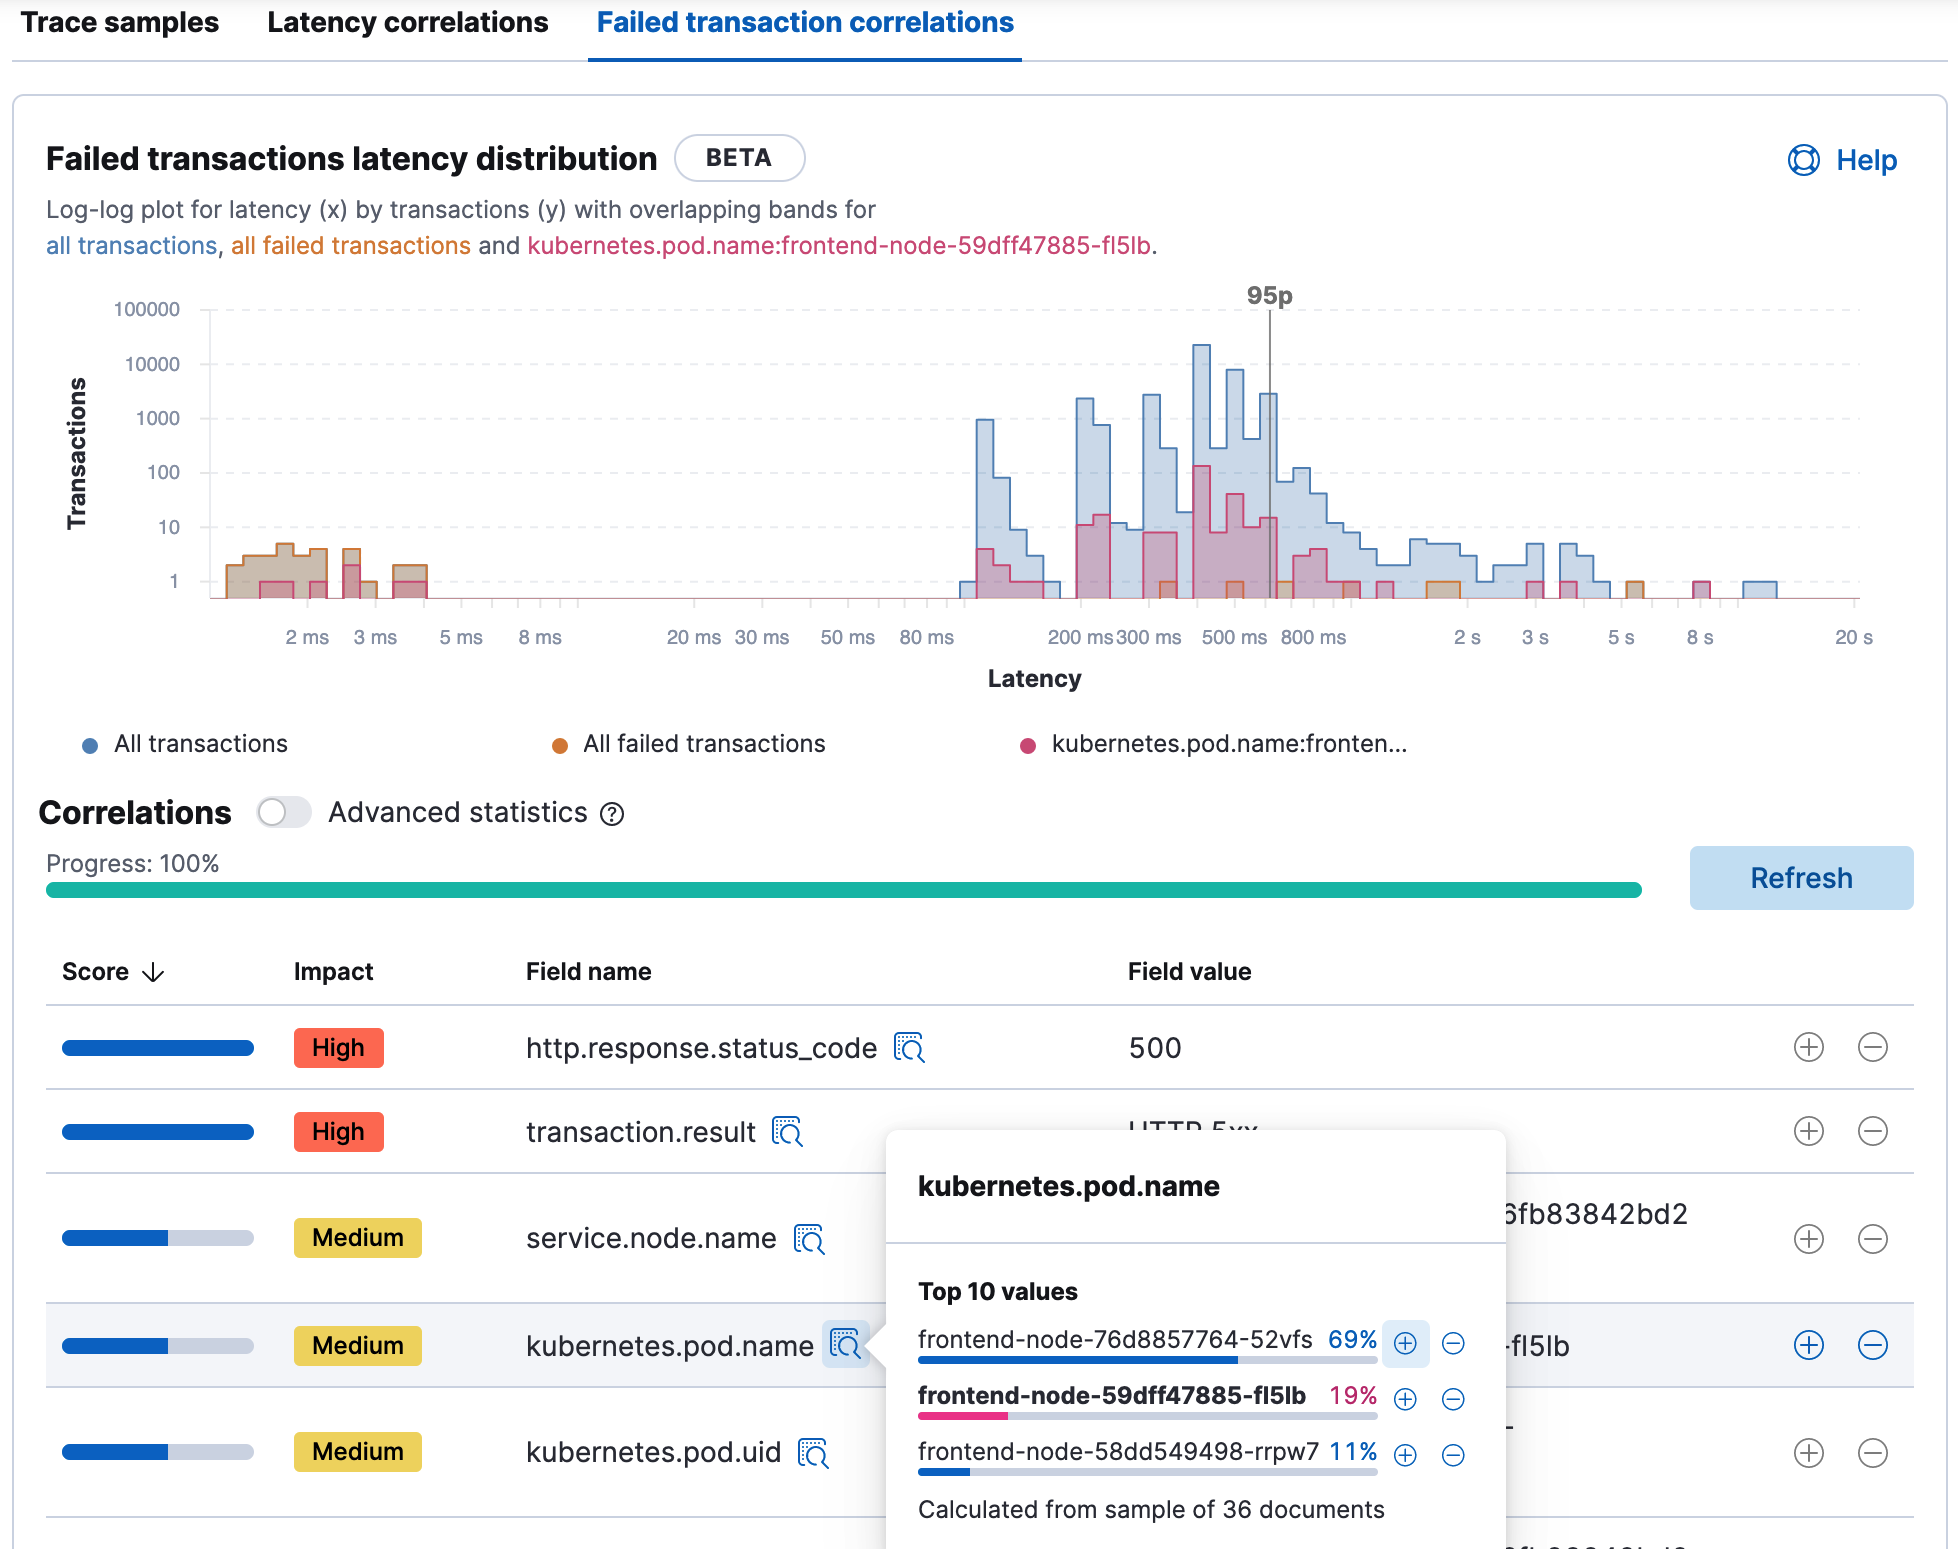
APM failed transactions correlation charts and top values (beta)
editIn 7.16 you can view a chart for failed transaction correlations, which shows the transactions in the overall latency distribution for the transaction group. Both the latency and failed transaction correlation tables also have a new option to view and add filters for the most popular field values. To learn more, see Correlations.