What’s new in 8.12
editWhat’s new in 8.12
editHere are the highlights of what’s new and improved in 8.12. For detailed information about this release, check the release notes.
Previous versions: 8.11 | 8.10 | 8.9 | 8.8 | 8.7 | 8.6 | 8.5 | 8.4 | 8.3 | 8.2 | 8.1 | 8.0
Dashboard
editEdit ES|QL in a dashboard
editWe are introducing editing of an ES|QL query on a dashboard and allows the users to select among different chart suggestions. This is quite powerful since users don’t need to go back to Discover to edit the query and recreate the chart, they can simply adjust the query right there on a dashboard.
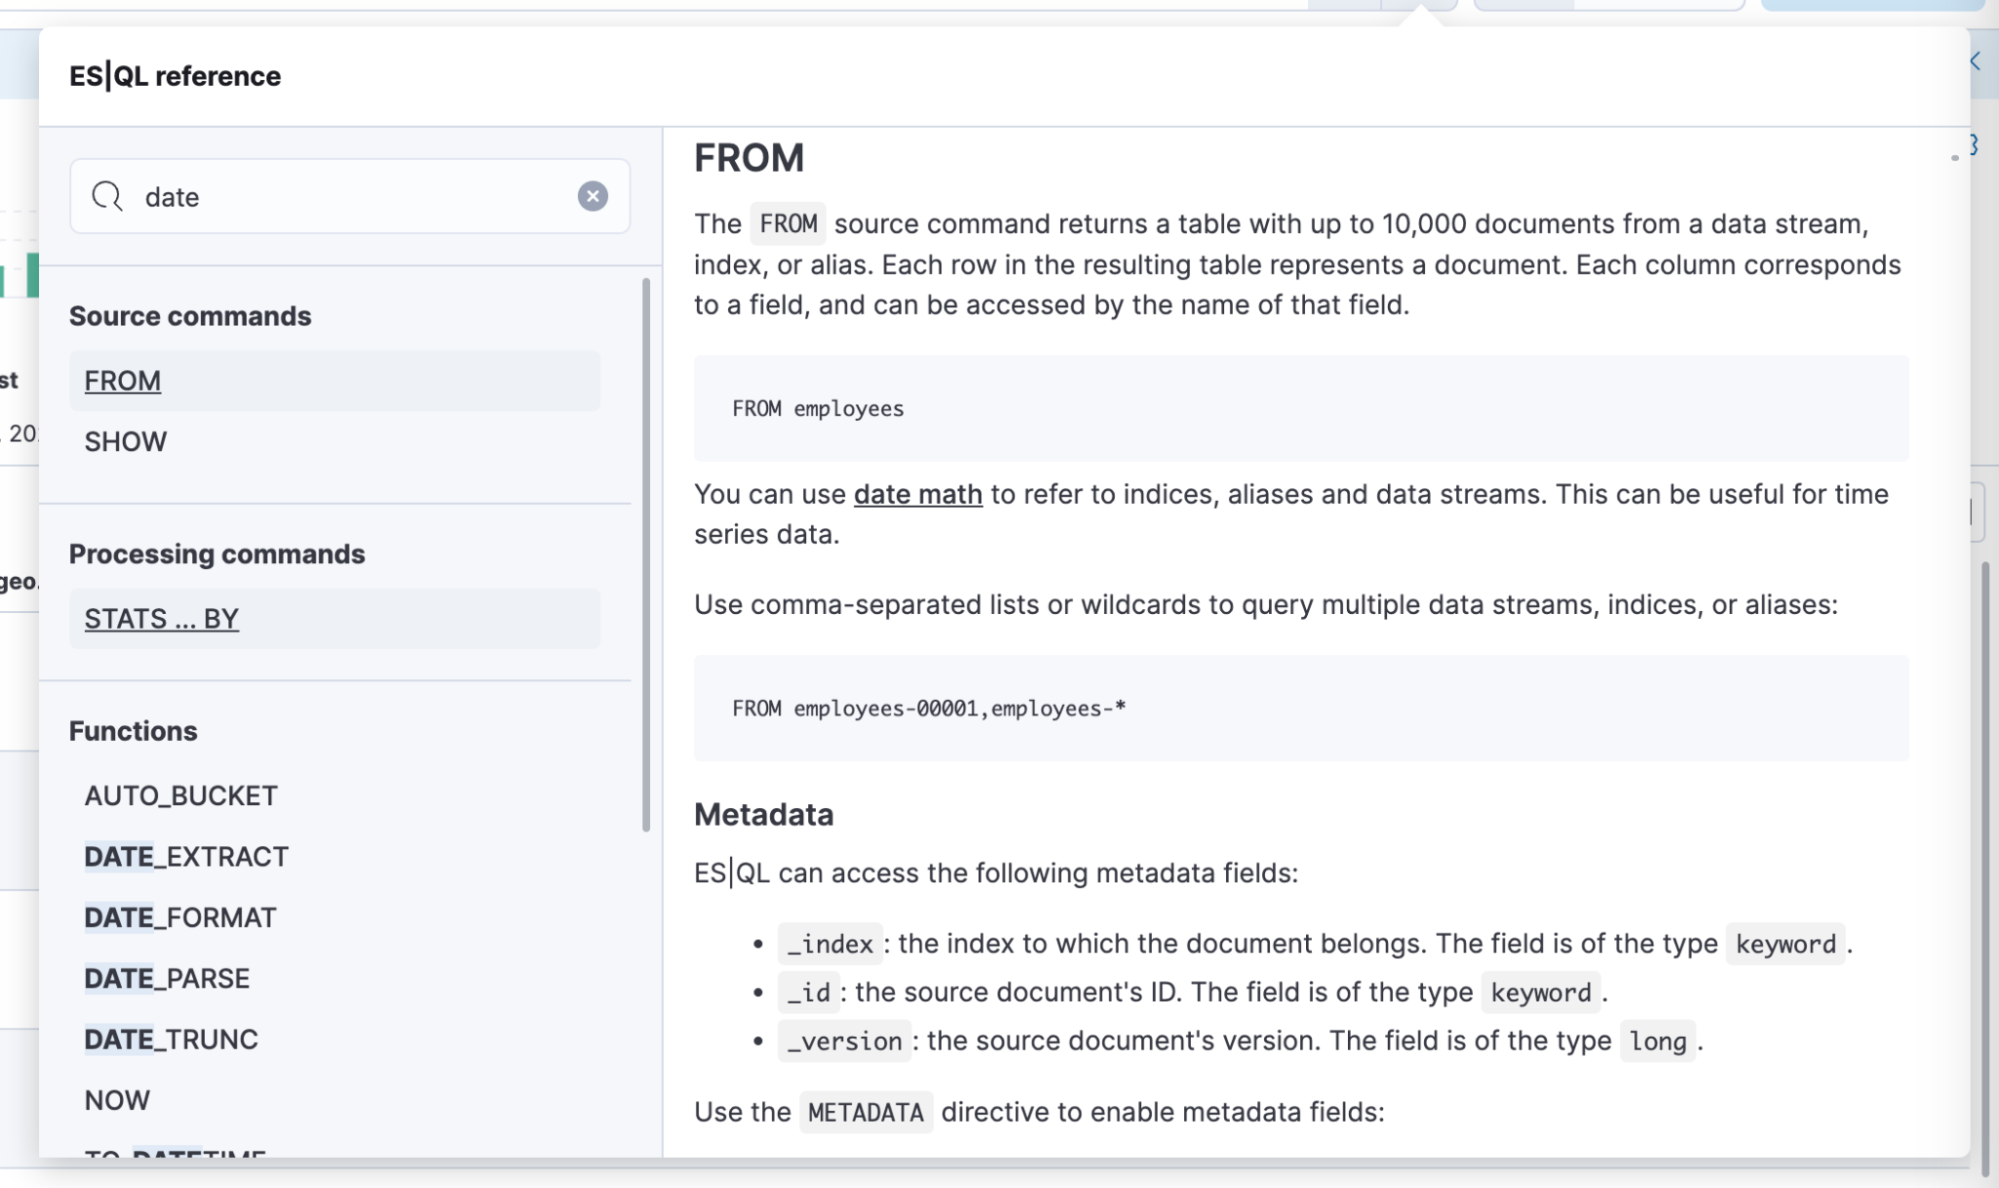
Improved ES|QL in-app documentation search
editMany users open the ES|QL editor’s documentation popover to familiarize themselves with the commands and find examples. Our search input was searching only on the titles of the commands/functions and not the description of each. As a result users were failing to find what they wanted. For example, if they searched for IP then CIDR_MATCH would not appear, but only TO_IP. This change helps users learn ES|QL faster by improving the search.
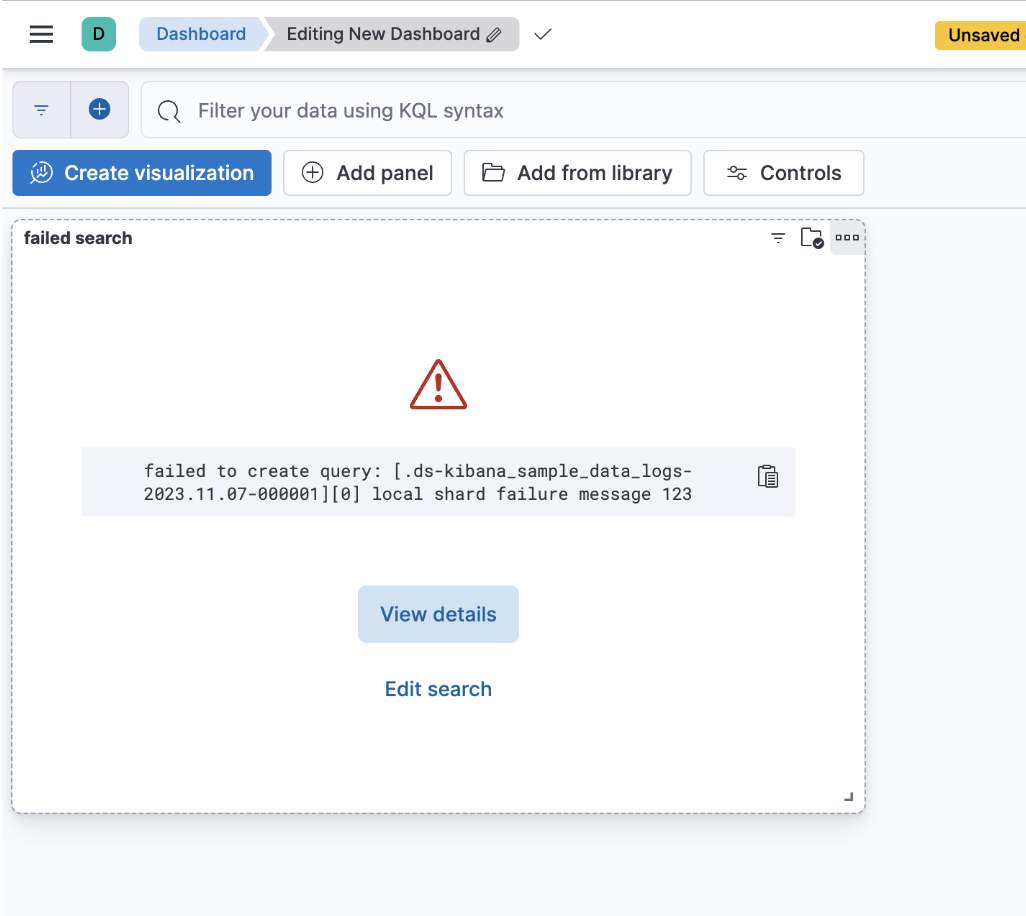
Improved error messages for cross-cluster search
editCustomers querying data from multiple clusters (CCS queries) will get more information on why their search failed for each of the visualizations in a dashboard as well as in the Discover application.
Discover
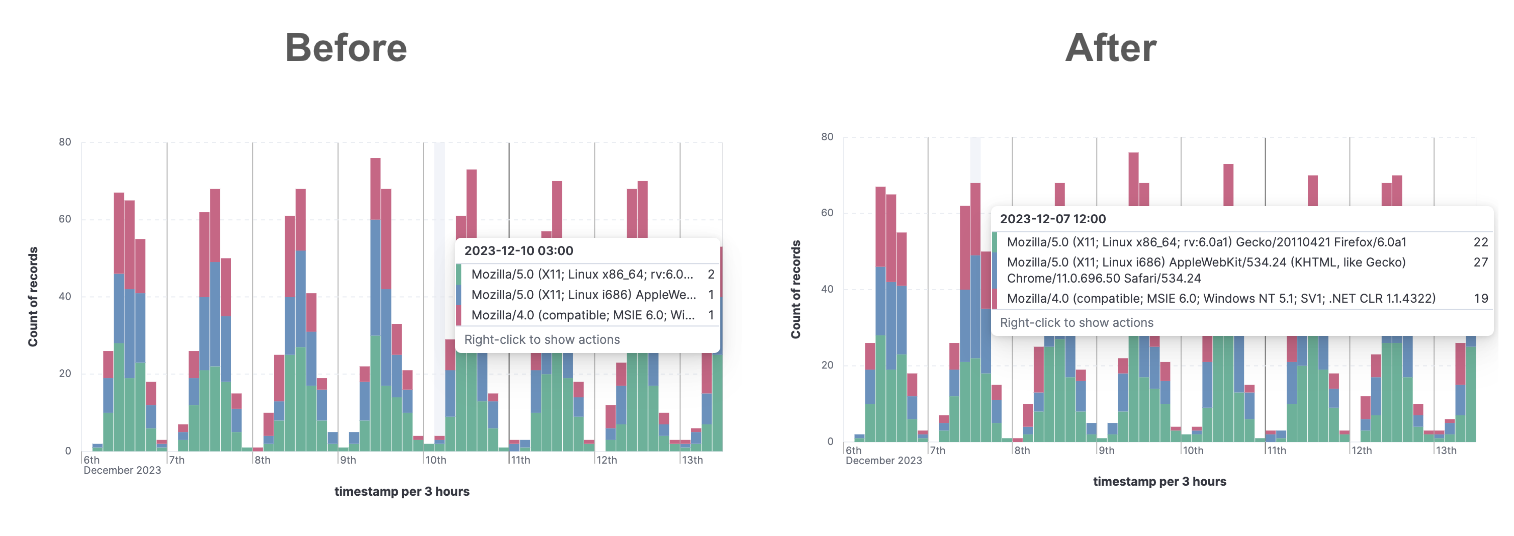
editImproved long field names handling in Kibana
editLong field names are very normal in Observability and Security datasets. That’s why we adapted multiple elements in Discover, Dashboards, Maps, and Lens such as field selectors, table headers, filter pills, and chart tooltips amongst others to handle long field names. For example, you will notice it when you select a field to set some filters or when you mouse over a chart.
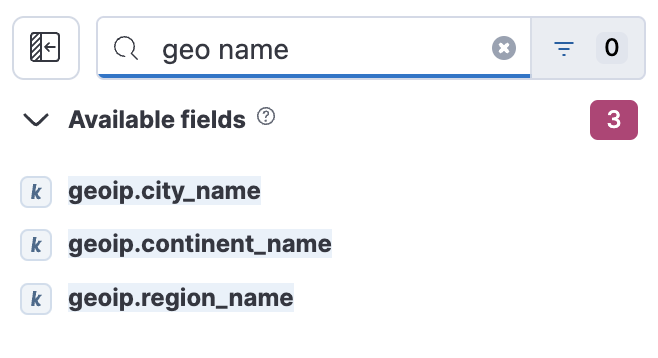
Improved search for field names by handling spaces like wildcards
editTo improve data exploration, we improved the search within the field list by allowing users to do a more flexible search in the fields sidebar with terms containing spaces.
Machine Learning
editUnified inference API now integrates OpenAI and HuggingFace
editIn 8.11 we introduced a unified inference API that abstracts away the complexity of performing inference on different models for different tasks.
We released an MVP iteration of this framework in technical preview which initially supported ELSER in an Elastic deployment and we hinted that in future releases, the inference API will support both internal and external models and will integrate with the LLM ecosystem.
And so in 8.12 Elastic’s Inference API is extended to integrate with external models to perform AI search inference using:
- OpenAI embeddings
- HuggingFace embeddings and
- ELSER on HuggingFace
AI search with embeddings achieves superior contextual relevance and captures user intent. Inference using these new capabilities involves external calls to the corresponding endpoints on OpenAI and HuggingFace. The power of the inference API lies in its simple, unified syntax that abstracts away the underlying complexity of using different internal and external models for different tasks.
Performing inference on the newly supported models and services is as simple as a call with the simple syntax introduced in 8.11:
PUT /_inference/<task_type>/<model_id>
Concretely, this is how this syntax shapes up for inference with OpenAI embeddings, showcasing the power of Elastic’s unified inference API:
PUT _inference/text_embedding/openai_embeddings
For a detailed example, see this tutorial. Bear in mind that you will need an OpenAI account and the corresponding API key, as well as to choose the specific OpenAI embeddings that you want to use.
HuggingFace enables access to many open source models while also providing granular control over how the models are deployed. Tailor the deployment environment to your needs by configuring the number of replicas and whether to run the model on a CPU or GPU.
We will continue enhancing Elastic’s inference API with more capabilities and support for more models and tasks for our users to have the most powerful AI effortlessly and seamlessly.
First-class support for E5 multilingual embeddings
editELSER is Elastic’s text expansion language model for AI search in English. It offers superior relevance out of the box, without the need for retraining on in-domain data. ELSER is the AI search model of choice for the English language. ELSER v2 is Generally Available as of 8.11.
For AI search in languages other than English, you can now use E5 multilingual embeddings straight from the Trained Models UI. Like ELSER, E5 has two versions: an Intel-optimized one and a cross-platform one (which runs on any hardware). The Model Management > Trained Models UI shows you which version of E5 is recommended to deploy based on your cluster’s hardware (also see the next section for the redesigned Trained Models UI). The supported model version of E5 is multilingual-e5-small. For more details, see our documentation. Note that E5 is used under the MIT license.
A redesigned trained models UI that brings together our AI search capabilities
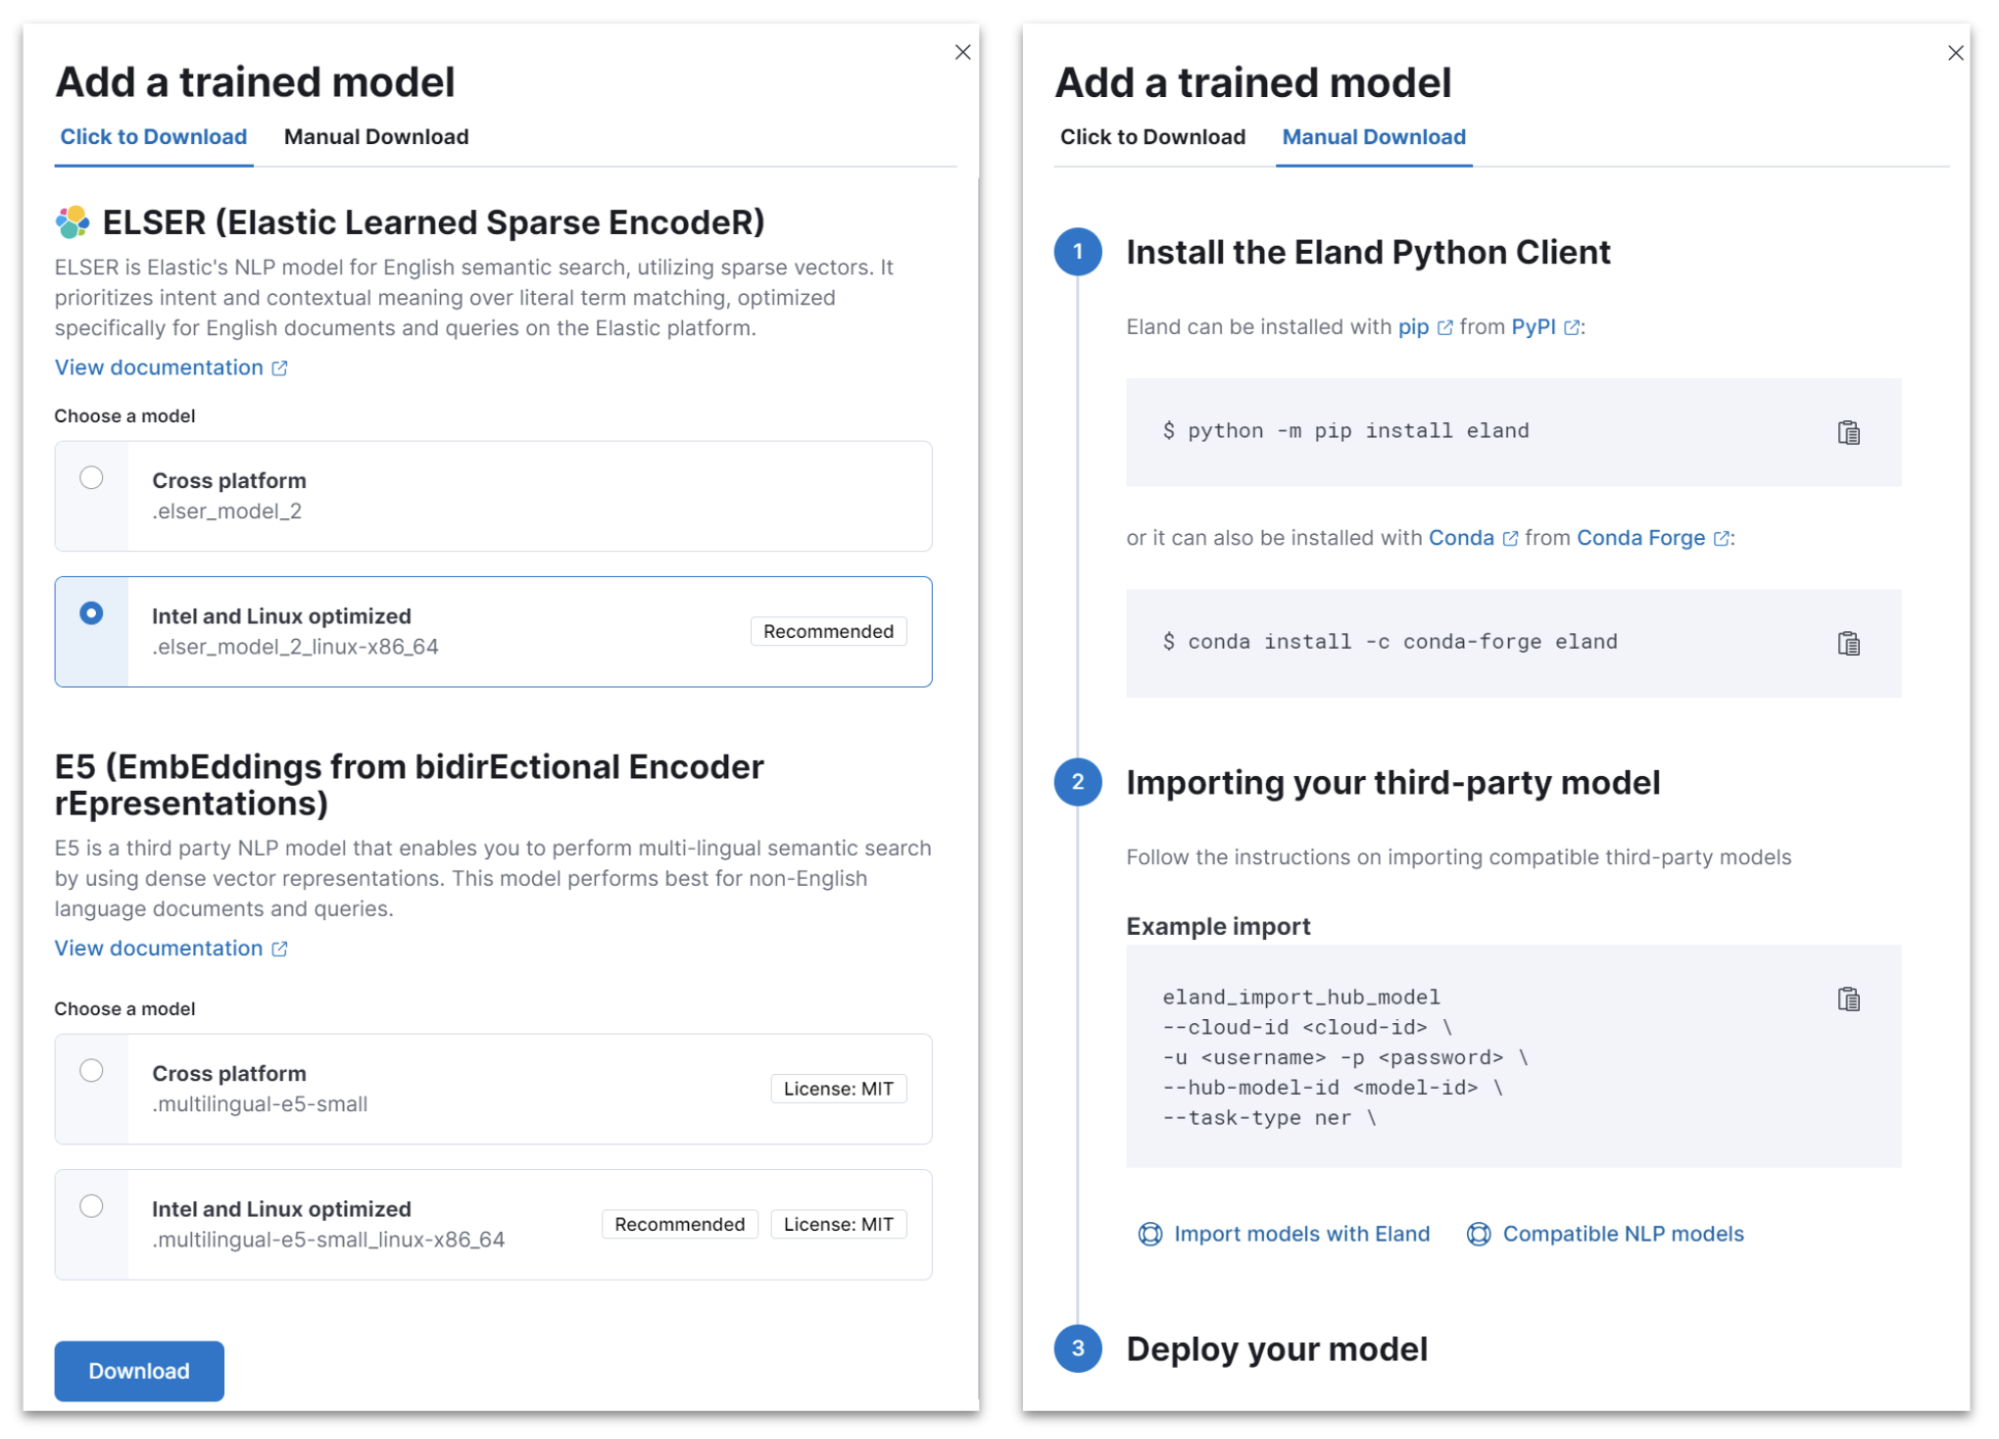
editIn 8.12, we have redesigned the way you can add trained models to your deployment through the Trained Models UI for better guidance and usability.
The flyout to add a trained model includes a tab for ELSER and E5 which can be deployed with one click. The UI also guides you as to the recommended version of each model (Intel-optimized or cross-platform), depending on your underlying hardware. A second tab guides you through deploying any other model on Elastic using the Eland Python client.
AIOps: Log Rate Analysis is GA
editLog Rate Analysis helps you investigate significant increases or decreases of your log rates fast and easy. It helps you identify the reasons behind these changes. Just click on a spike or dip and it will show you the fields (or combinations of fields) that contribute to these changes and, if it helps, continue your investigation by inspecting your selected field in Discover. We consistently enhanced Log Rate Analysis during the past few releases to support both spikes and dips analysis, support for text fields by leveraging Log Pattern Analysis, integration with Discover and more. In 8.12 we added the ability to easily create a categorization anomaly detection job from the pattern analysis flyout in Discover and importantly Log Rate Analysis becomes GA.
Alerts in Anomaly Explorer
editIn 8.12 we have enhanced the Anomaly Explorer UI to include insights about alerts generated by rules that use your anomaly detection jobs.
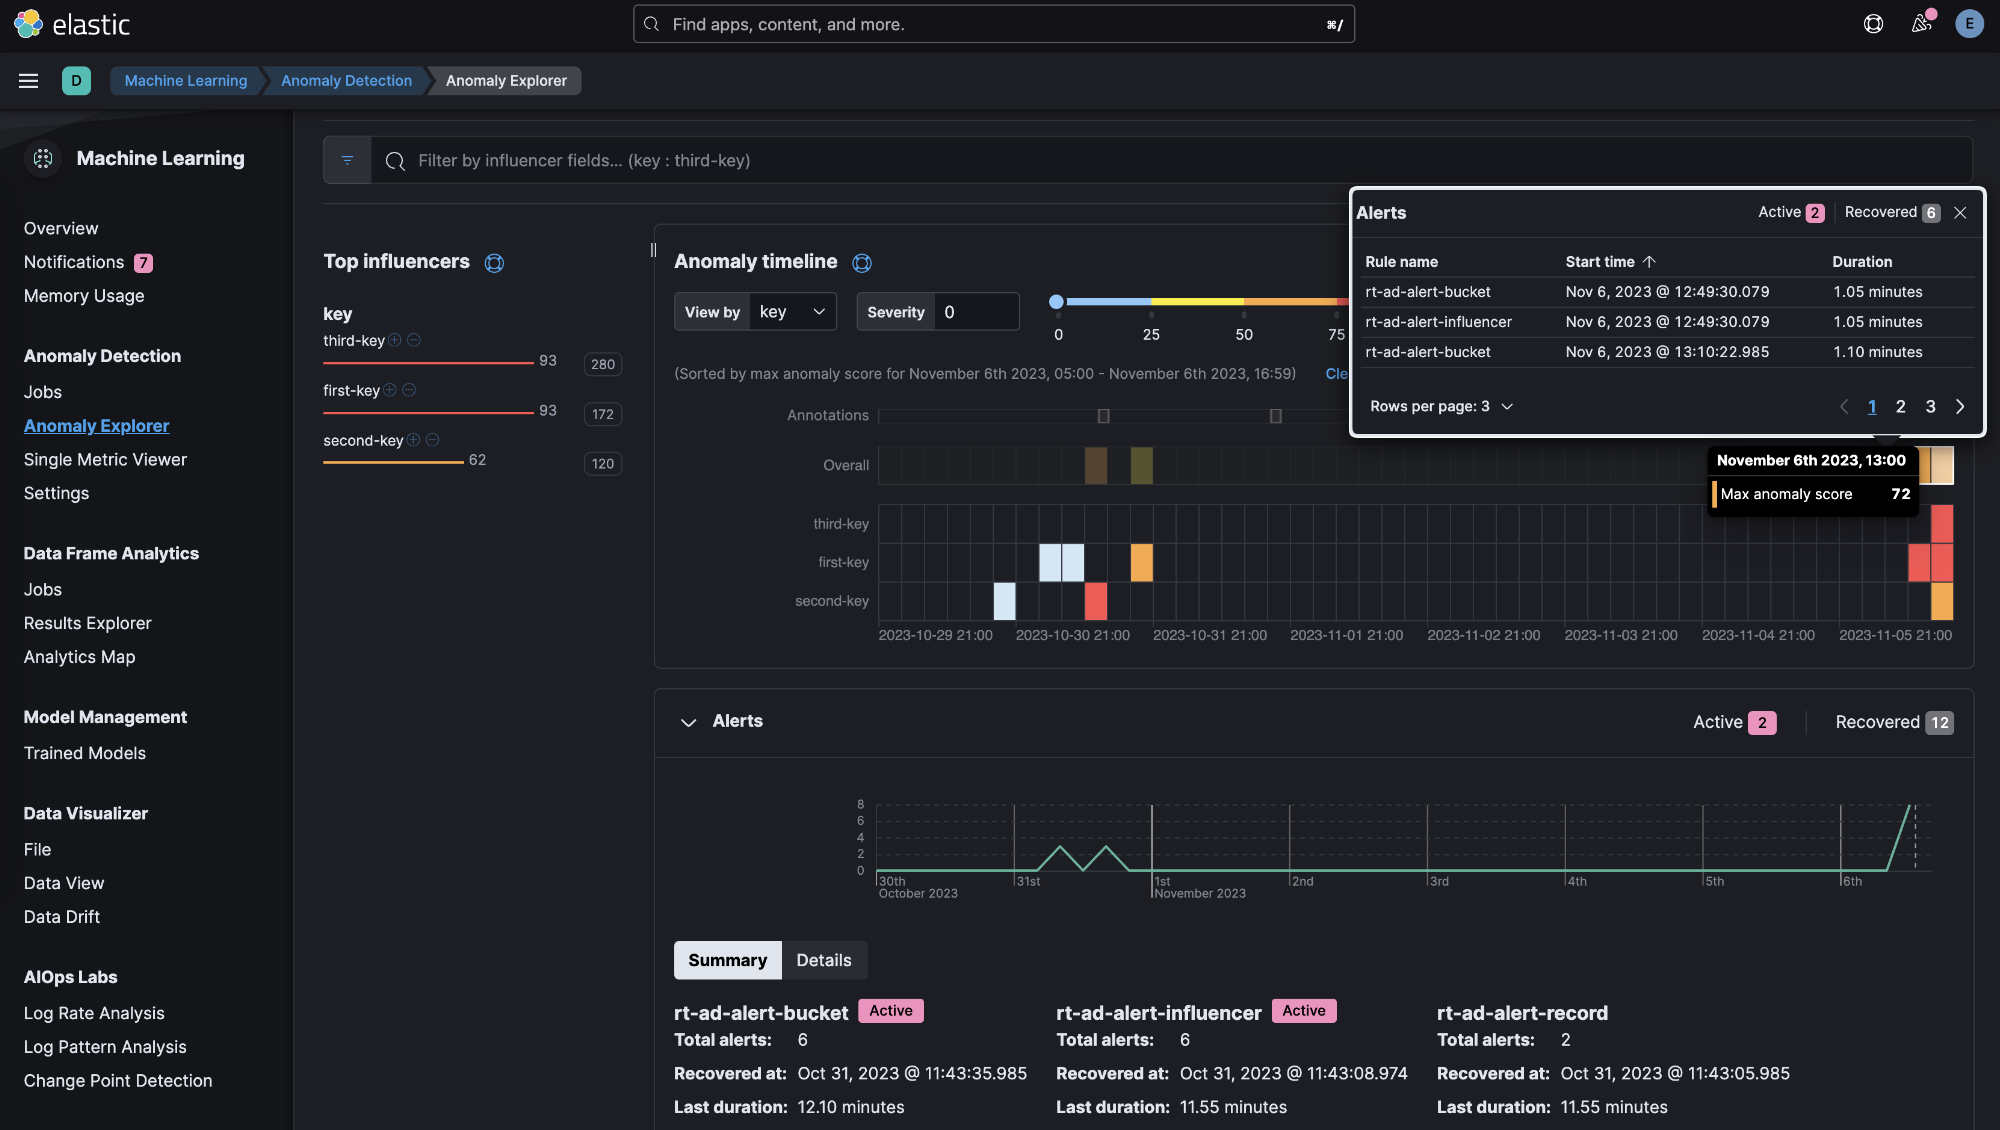
These insights include:
- a line chart of the alerts count and their correlation with the anomalies detected,
- an alert context menu when an anomaly swimlane cell is selected,
- a summary section including the alert duration, start and recovery time and more information and a
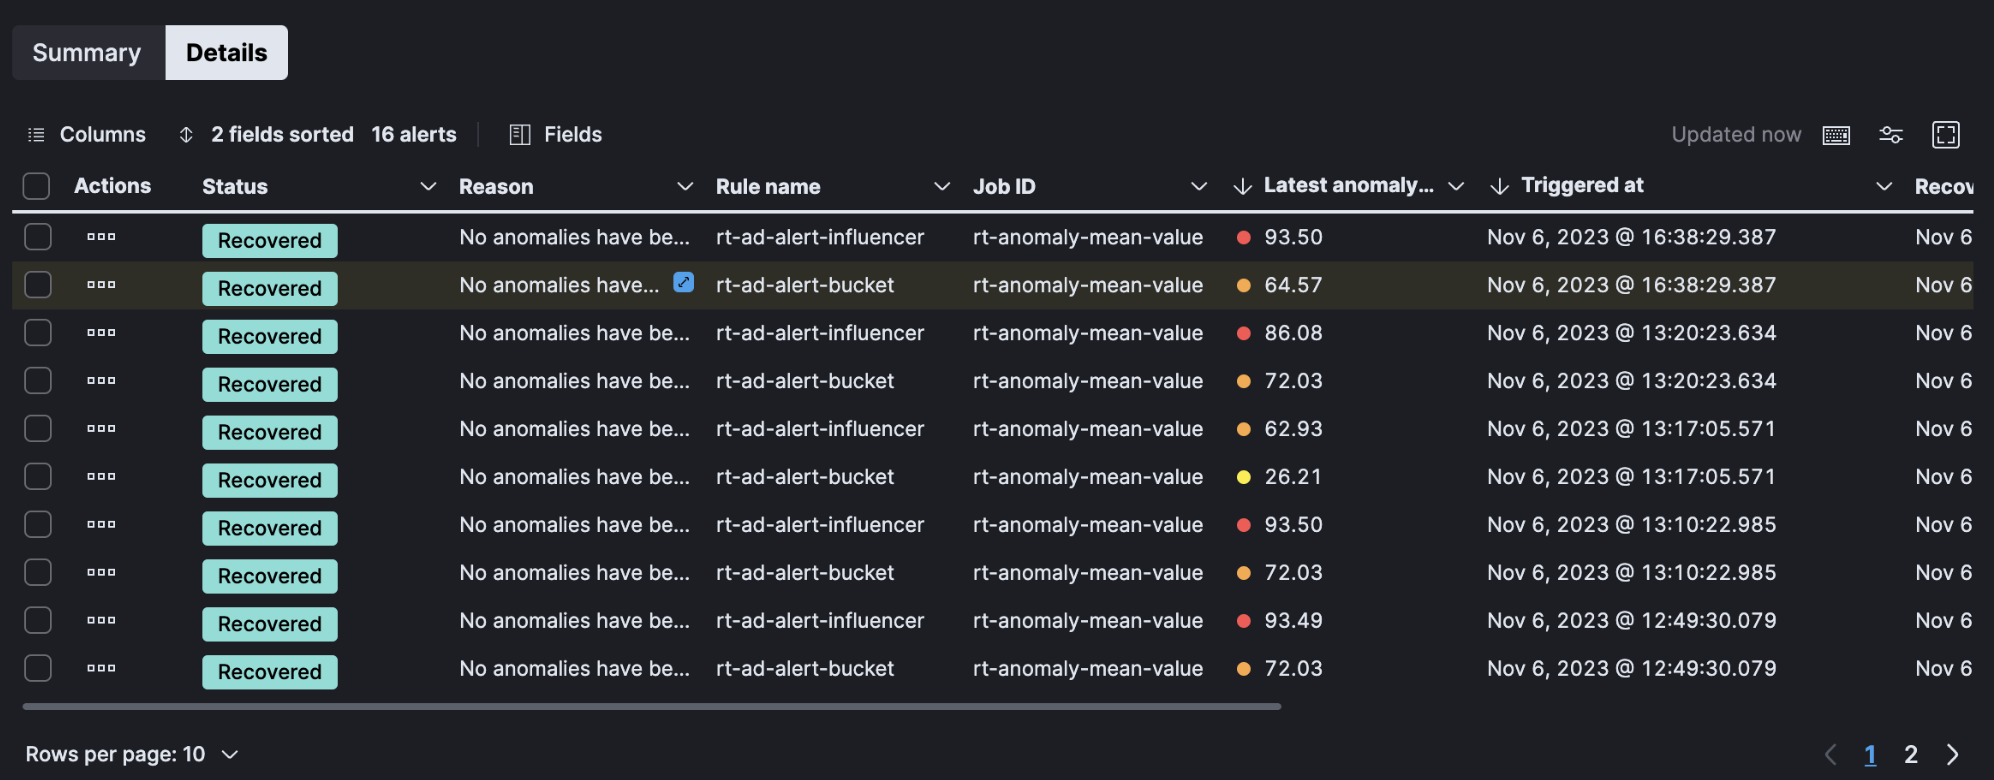
- Details tab from which the user can select to open an alert’s detail page and attach an alert to a new or existing case.
ResponseOps
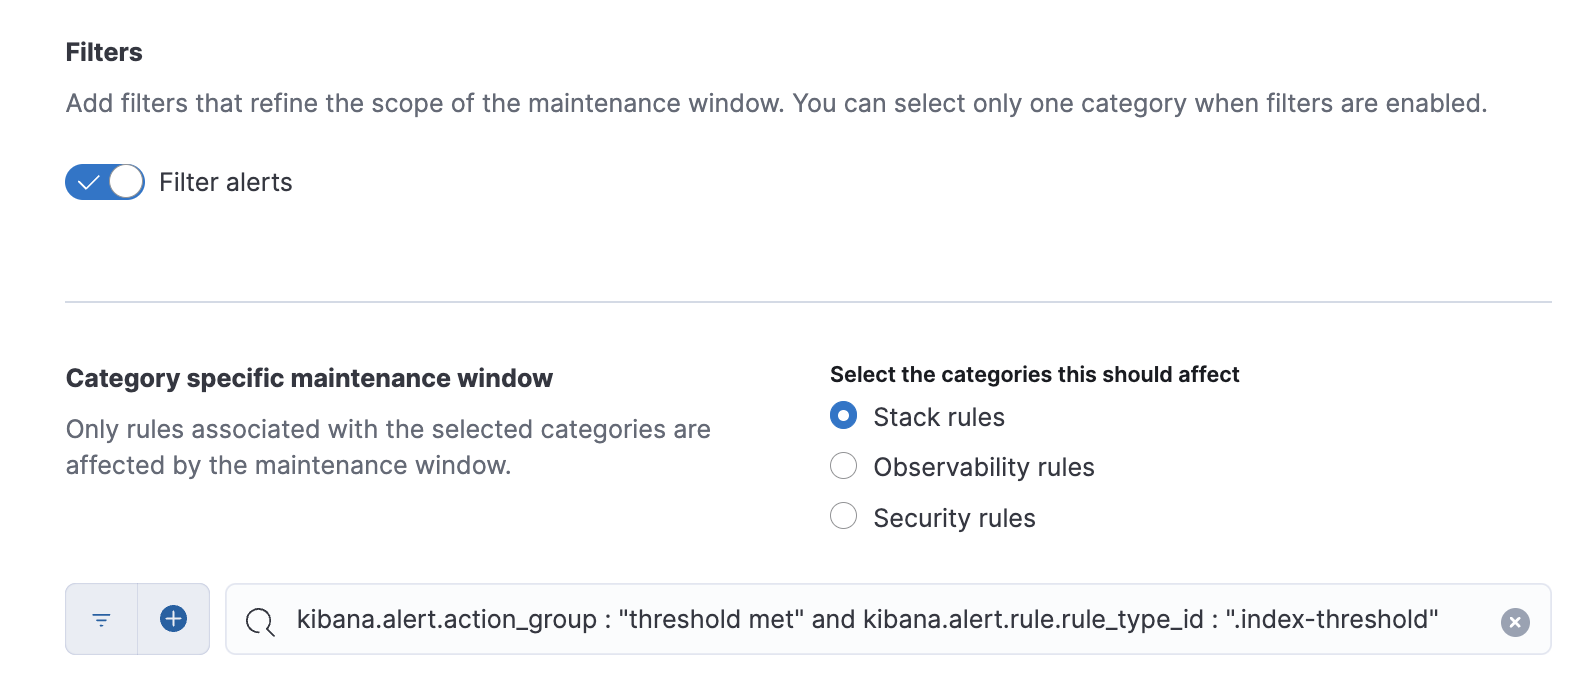
editMaintenance window filters
editIn 8.12 you can add KQL filters to your maintenance windows to further refine their scope:
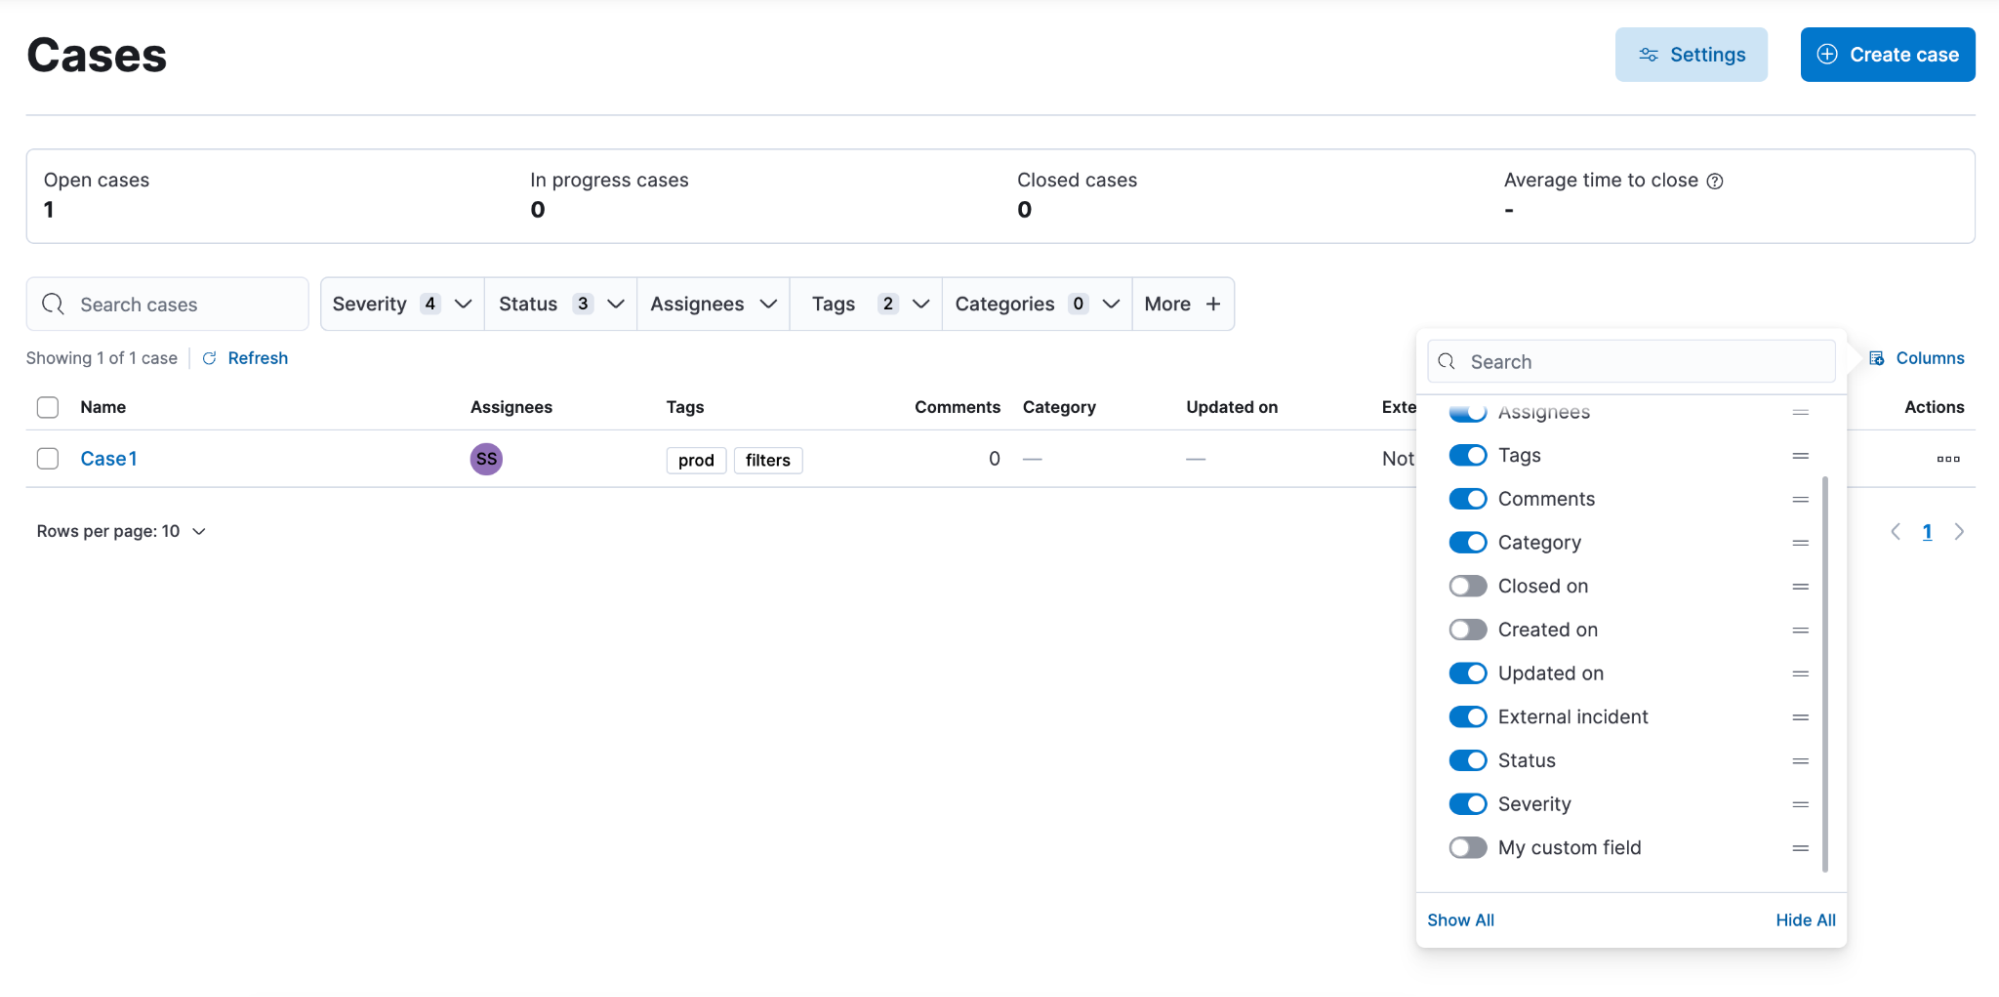
Case improvements
editThe enhanced case view is now supported by any field filter and any change to the view is saved to local cache to ensure your data won’t be lost.
There is also a new Kibana sub-feature privilege that enables you to customize access to case settings.
If you add files to cases, there is a new option to copy the file hash to your clipboard. File hashes are crucial for incident investigation and for verification of file integrity. The supported hash functions for case files are MD5, SHA-1, and SHA-256.
Connector improvements
editPagerDuty alert action is now supported by 2 new fields links and custom_details.
ServiceNow ITSM alert action allows users to define incident resolution when alert is recovered to ensure bi-directional sync between the Elastic Alerts and ServiceNow Incidents.