Elastic Security overview
editElastic Security overview
editElastic Security combines SIEM threat detection features with endpoint prevention and response capabilities in one solution. These analytical and protection capabilities, leveraged by the speed and extensibility of Elasticsearch, enable analysts to defend their organization from threats before damage and loss occur.
Elastic Security provides the following security benefits and capabilities:
- A detection engine to identify attacks and system misconfigurations
- A workspace for event triage and investigations
- Interactive visualizations to investigate process relationships
- Inbuilt case management with automated actions
- Detection of signatureless attacks with prebuilt machine learning anomaly jobs and detection rules
Elastic Security components and workflow
editThe following diagram provides a comprehensive illustration of the Elastic Security workflow.
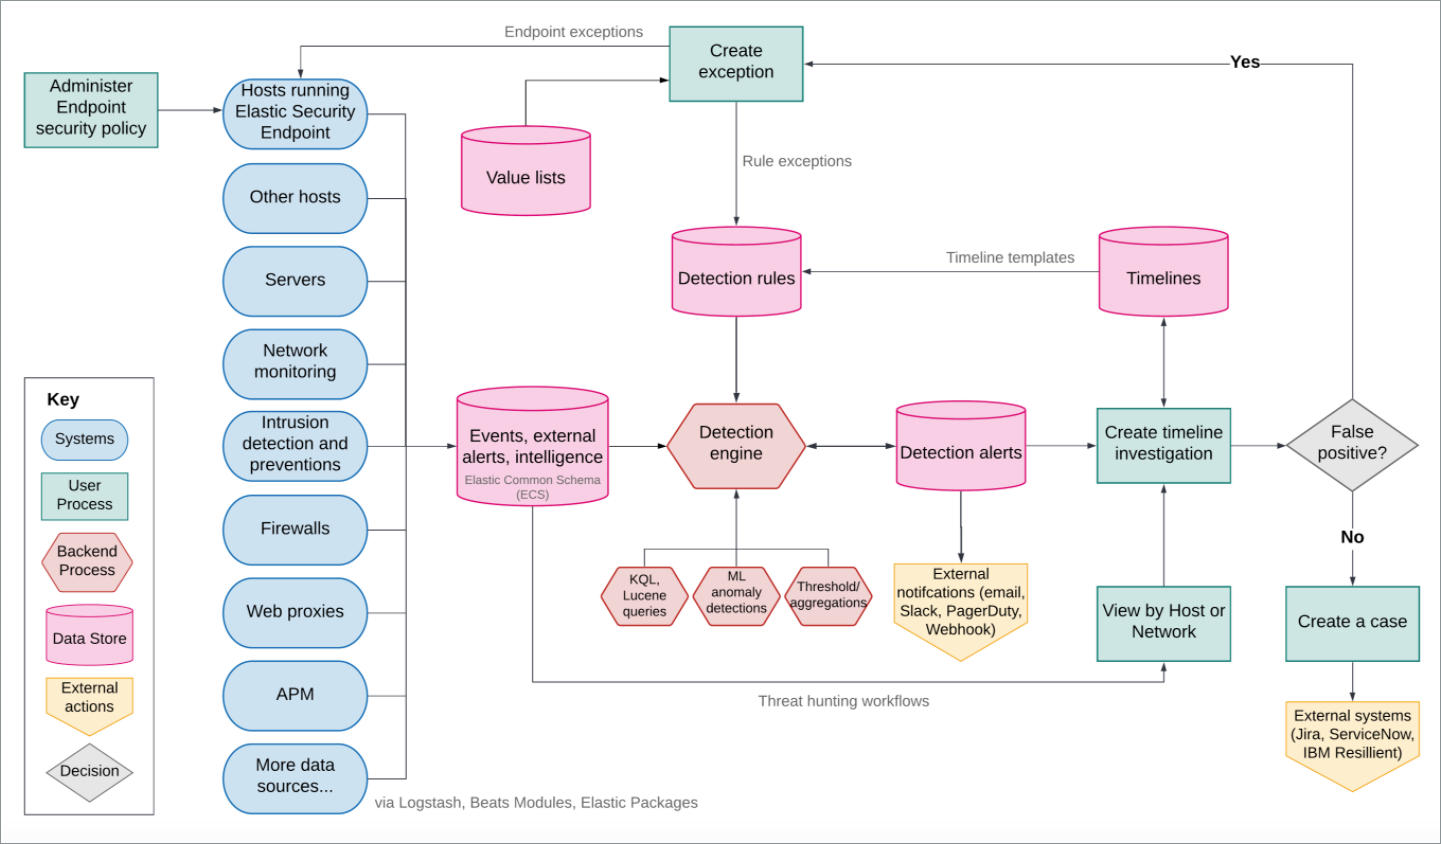
Here’s an overview of the flow and its components:
-
Data is shipped from your hosts to Elasticsearch via beat modules and the Elastic Endpoint Security agent integration. This integration provides capabilities such as collecting events, detecting and preventing malicious activity, and artifact delivery. The Fleet app is used to install and manage agents and integrations on your hosts.
The Endpoint Security integration ships the following data sets:
- Windows: Process, network, file, DNS, registry, DLL and driver loads, malware security detections
- Linux/macOS: Process, network, file
- Beat modules: Beats are lightweight data shippers. Beat modules provide a way of collecting and parsing specific data sets from common sources, such as cloud and OS events, logs, and metrics. Common security-related modules are listed here.
-
The Elastic Security app in Kibana is used to manage the Detection engine, Cases, and Timeline, as well as administer hosts running Endpoint Security:
-
Detection engine: Automatically searches for suspicious host and network activity via the following:
- Detection rules: Periodically search the data (Elasticsearch indices) sent from your hosts for suspicious events. When a suspicious event is discovered, a detection alert is generated. External systems, such as Slack and email, can be used to send notifications when alerts are generated. You can create your own rules and make use of our prebuilt ones.
- Exceptions: Reduce noise and the number of false positives. Exceptions are associated with rules and prevent alerts when an exception’s conditions are met. Value lists contain source event values that can be used as part of an exception’s conditions. When Elastic Endpoint Security is installed on your hosts, you can add malware exceptions directly to the endpoint from the Security app.
- Machine learning jobs: Automatic anomaly detection of host and network events. Anomaly scores are provided per host and can be used with detection rules.
- Timeline: Workspace for investigating alerts and events. Timelines use queries and filters to drill down into events related to a specific incident. Timeline templates are attached to rules and use predefined queries when alerts are investigated. Timelines can be saved and shared with others, as well as attached to Cases.
- Cases: An internal system for opening, tracking, and sharing security issues directly in the Security app. Cases can be integrated with external ticketing systems.
- Administration: View and manage hosts running Endpoint Security.
-
Ingest data to Elastic Security and Configure and install the Elastic Endpoint integration describe how to ship security-related data to Elasticsearch.
For more background information, see:
- Elasticsearch: A real-time, distributed storage, search, and analytics engine. Elasticsearch excels at indexing streams of semi-structured data, such as logs or metrics.
- Kibana: An open-source analytics and visualization platform designed to work with Elasticsearch. You use Kibana to search, view, and interact with data stored in Elasticsearch indices. You can easily compile advanced data analysis and visualize your data in a variety of charts, tables, and maps.
Compatibility with cold tier nodes
editCold tier is a data tier that holds time-series data that is accessed only occasionally. In Elastic Stack version >=7.11.0, Elastic Security supports cold tier data for the following Elasticsearch indices:
-
Index patterns specified in
securitySolution:defaultIndex - Index patterns specified in the definitions of detection rules, except for indicator match rules
- Index patterns specified in the data sources selector on various Elastic Security app pages
Elastic Security does NOT support cold tier data for the following Elasticsearch indices:
- Index patterns controlled by Elastic Security, including signals and list indices
- Index patterns specified in indicator match rules
Using cold tier data for unsupported indices may result in detection rule timeouts and overall performance degradation.
Elastic Endpoint self-protection
editSelf-protection means that Elastic Endpoint has guards against users and attackers that may try to interfere with its functionality. This protection feature is consistently enhanced to prevent attackers who may attempt to use newer, more sophisticated tactics to interfere with the Elastic Endpoint. Self-protection is enabled by default when Elastic Endpoint installs on supported platforms, listed below.
Self-protection is enabled on the following 64-bit Windows versions:
- Windows 8.1
- Windows 10
- Windows Server 2012 R2
- Windows Server 2016
- Windows Server 2019
And on the following macOS versions:
- macOS 10.15 (Catalina)
- macOS 11 (Big Sur)
Other Windows and macOS variants (and all Linux distributions) do not have self-protection.
For Elastic Stack version >= 7.11.0, self-protection defines the following permissions:
-
Users — even Administrator/root — cannot delete Elastic Endpoint files (located at
c:\Program Files\Elastic\Endpointon Windows, and/Library/Elastic/Endpointon macOS). - Users cannot terminate the Elastic Endpoint program or service.
-
Administrator/root users can read the endpoint’s files. On Windows, the easiest way to read Endpoint files is to start an Administrator
cmd.exeprompt. On macOS, an Administrator can use thesudocommand. -
Administrator/root users can stop the Elastic Agent’s service. On Windows, run the
sc stop "Elastic Agent"command. On macOS, run thesudo launchctl stop elastic-agentcommand.
Integration with other Elastic products
editYou can use Elastic Security with other Elastic products and features to help you identify and investigate suspicious activity:
APM transaction data sources
editBy default, Elastic Security monitors APM
apm-*-transaction* indices. To add additional APM indices, update the
index patterns in the securitySolution:defaultIndex setting (Kibana → Stack Management → Advanced Settings → securitySolution:defaultIndex).
ECS compliance data requirements
editThe Elastic Common Schema (ECS) defines a common set of fields used for storing event data in Elasticsearch. ECS helps users normalize their event data to better analyze, visualize, and correlate the data represented in their events. Elastic Security supports events and indicator index data from any ECS-compliant data source.
Elastic Security requires ECS-compliant data. If you use third-party data collectors to ship data to Elasticsearch, the data must be mapped to ECS. Elastic Security ECS field reference lists ECS fields used in Elastic Security.