Getting started with the Elastic Stack
editGetting started with the Elastic Stack
editLooking for an Elastic Stack ("ELK") guide that shows how to quickly install and configure the Elastic Stack? You’re in the right place! You can install the Elastic Stack on a single VM, or even on your laptop:
After completing the installation process, learn how to implement a system monitoring solution that uses Metricbeat to collect server metrics and ship the data to Elasticsearch, search and visualize the data by using Kibana, and incorporate Logstash for additional parsing.
Implementing security is a critical step in configuring the Elastic Stack. This guide skips security configuration to quickly install a sample installation. Before sending sensitive data across the network, secure the Elastic Stack and enable encrypted communications.
Before you begin
edit- See the Elastic Support Matrix for information about supported operating systems and product compatibility.
- Verify that your system meets the minimum JVM requirements for Logstash and Elasticsearch.
Install Elasticsearch
editElasticsearch is a real-time, distributed storage, search, and analytics engine. It can be used for many purposes, but one context where it excels is indexing streams of semi-structured data, such as logs or decoded network packets.
You can run Elasticsearch on your own hardware, or use our hosted Elasticsearch Service on Elastic Cloud. The Elasticsearch Service is available on both AWS and GCP. Try out the Elasticsearch Service for free.
To download and install Elasticsearch, open a terminal window and use the commands that work with your system (deb for Debian/Ubuntu, rpm for Redhat/Centos/Fedora, mac or brew for OS X, linux for Linux, and win for Windows):
curl -L -O https://artifacts.elastic.co/downloads/elasticsearch/elasticsearch-7.7.1-amd64.deb
sudo dpkg -i elasticsearch-7.7.1-amd64.deb
sudo /etc/init.d/elasticsearch start
curl -L -O https://artifacts.elastic.co/downloads/elasticsearch/elasticsearch-7.7.1-x86_64.rpm
sudo rpm -i elasticsearch-7.7.1-x86_64.rpm
sudo service elasticsearch start
curl -L -O https://artifacts.elastic.co/downloads/elasticsearch/elasticsearch-7.7.1-darwin-x86_64.tar.gz
tar -xzvf elasticsearch-7.7.1-darwin-x86_64.tar.gz
cd elasticsearch-7.7.1
./bin/elasticsearch
brew tap elastic/tap
brew install elastic/tap/elasticsearch-full
elasticsearch
curl -L -O https://artifacts.elastic.co/downloads/elasticsearch/elasticsearch-7.7.1-linux-x86_64.tar.gz
tar -xzvf elasticsearch-7.7.1-linux-x86_64.tar.gz
cd elasticsearch-7.7.1
./bin/elasticsearch
- Download the Elasticsearch 7.7.1 Windows zip file from the Elasticsearch download page.
-
Extract the contents of the zip file to a directory on your computer, for
example,
C:\Program Files. -
Open a command prompt as an Administrator and navigate to the directory that contains the extracted files, for example:
cd C:\Program Files\elasticsearch-7.7.1
-
Start Elasticsearch:
bin\elasticsearch.bat
For other operating systems, go to the Elasticsearch download page.
The default cluster.name and
node.name are elasticsearch and your hostname,
respectively. If you plan to keep using this cluster or add more nodes, it is a
good idea to change these default values to unique names. For details about
changing these and other settings in the elasticsearch.yml file, see
Configuring Elasticsearch.
To learn more about installing, configuring, and running Elasticsearch, read the Elasticsearch Reference.
Make sure Elasticsearch is up and running
editTo test that the Elasticsearch daemon is up and running, try sending an HTTP GET request on port 9200.
curl http://127.0.0.1:9200
On Windows, if you don’t have cURL installed, point your browser to the URL.
You should see a response similar to this:
{
  "name" : "QtI5dUu",
  "cluster_name" : "elasticsearch",
  "cluster_uuid" : "DMXhqzzjTGqEtDlkaMOzlA",
  "version" : {
    "number" : "7.7.1",
    "build_flavor" : "default",
    "build_type" : "tar",
    "build_hash" : "00d8bc1",
    "build_date" : "2018-06-06T16:48:02.249996Z",
    "build_snapshot" : false,
    "lucene_version" : "7.3.1",
    "minimum_wire_compatibility_version" : "5.6.0",
    "minimum_index_compatibility_version" : "5.0.0"
  },
  "tagline" : "You Know, for Search"
}
Install Kibana
editKibana is an open source analytics and visualization platform designed to work with Elasticsearch. You use Kibana to search, view, and interact with data stored in Elasticsearch indices. You can easily perform advanced data analysis and visualize your data in a variety of charts, tables, and maps.
Running our hosted Elasticsearch Service on Elastic Cloud? Kibana is enabled automatically in most templates, or manually with the flick of a switch.
We recommend that you install Kibana on the same server as Elasticsearch,
but it is not required. If you install the products on different servers, you’ll
need to change the URL (IP:PORT) of the Elasticsearch server in the Kibana configuration
file, kibana.yml, before starting Kibana.
To download and install Kibana, open a terminal window and use the commands that work with your system:
deb, rpm, or linux:
curl -L -O https://artifacts.elastic.co/downloads/kibana/kibana-7.7.1-linux-x86_64.tar.gz
tar xzvf kibana-7.7.1-linux-x86_64.tar.gz
cd kibana-7.7.1-linux-x86_64/
./bin/kibana
mac:
curl -L -O https://artifacts.elastic.co/downloads/kibana/kibana-7.7.1-darwin-x86_64.tar.gz
tar xzvf kibana-7.7.1-darwin-x86_64.tar.gz
cd kibana-7.7.1-darwin-x86_64/
./bin/kibana
brew:
brew tap elastic/tap
brew install elastic/tap/kibana-full
kibana
win:
- Download the Kibana 7.7.1 Windows zip file from the Kibana download page.
-
Extract the contents of the zip file to a directory on your computer, for
example,
C:\Program Files. -
Open a command prompt as an Administrator and navigate to the directory that contains the extracted files, for example:
cd C:\Program Files\kibana-7.7.1-windows
-
Start Kibana:
bin\kibana.bat
For other operating systems, go to the Kibana download page.
To learn more about installing, configuring, and running Kibana, read the Kibana Reference.
Launch the Kibana web interface
editTo launch the Kibana web interface, point your browser to port 5601. For example, http://127.0.0.1:5601.
Install Beats
editThe Beats are open source data shippers that you install as agents on your servers to send operational data to Elasticsearch. Beats can send data directly to Elasticsearch or via Logstash, where you can further process and enhance the data.
Each Beat is a separately installable product. In this guide, you learn how
to install and run Metricbeat with the system module enabled to collect system
metrics.
To learn more about installing and configuring other Beats, see the Getting Started documentation:
| Elastic Beats | To capture |
|---|---|
Audit data |
|
Log files |
|
Cloud data |
|
Availability monitoring |
|
Systemd journals |
|
Metrics |
|
Network traffic |
|
Windows event logs |
Install Metricbeat
editTo download and install Metricbeat, open a terminal window and use the commands that work with your system:
deb:
curl -L -O https://artifacts.elastic.co/downloads/beats/metricbeat/metricbeat-7.7.1-amd64.deb
sudo dpkg -i metricbeat-7.7.1-amd64.deb
rpm:
curl -L -O https://artifacts.elastic.co/downloads/beats/metricbeat/metricbeat-7.7.1-x86_64.rpm
sudo rpm -vi metricbeat-7.7.1-x86_64.rpm
mac:
curl -L -O https://artifacts.elastic.co/downloads/beats/metricbeat/metricbeat-7.7.1-darwin-x86_64.tar.gz
tar xzvf metricbeat-7.7.1-darwin-x86_64.tar.gz
brew:
brew tap elastic/tap
brew install elastic/tap/metricbeat-full
linux:
curl -L -O https://artifacts.elastic.co/downloads/beats/metricbeat/metricbeat-7.7.1-linux-x86_64.tar.gz
tar xzvf metricbeat-7.7.1-linux-x86_64.tar.gz
win:
- Download the Metricbeat Windows zip file from the Metricbeat download page.
-
Extract the contents of the zip file into
C:\Program Files. -
Rename the
metricbeat-7.7.1-windowsdirectory toMetricbeat. - Open a PowerShell prompt as an Administrator (right-click the PowerShell icon and select Run As Administrator).
-
From the PowerShell prompt, run the following commands to install Metricbeat as a Windows service:
PS > cd 'C:\Program Files\Metricbeat'
PS C:\Program Files\Metricbeat> .\install-service-metricbeat.ps1
If script execution is disabled on your system, set the execution policy for the current session to allow the script to run. For example:
PowerShell.exe
-ExecutionPolicy UnRestricted -File .\install-service-metricbeat.ps1
.
For other operating systems, go to the Beats download page.
Ship system metrics to Elasticsearch
editMetricbeat provides pre-built modules that you can use to rapidly implement and deploy a system monitoring solution, complete with sample dashboards and data visualizations, in about 5 minutes.
In this section, you learn how to run the system module to collect metrics
from the operating system and services running on your server. The system module
collects system-level metrics, such as CPU usage, memory, file system, disk IO,
and network IO statistics, as well as top-like statistics for every process
running on your system.
Before you begin: Verify that Elasticsearch and Kibana are running and that Elasticsearch is ready to receive data from Metricbeat.
To set up the system module and start collecting system metrics:
-
From the Metricbeat install directory, enable the
systemmodule:deb and rpm:
sudo metricbeat modules enable system
mac and linux:
./metricbeat modules enable system
brew:
metricbeat modules enable system
win:
PS C:\Program Files\Metricbeat> .\metricbeat.exe modules enable system
-
Set up the initial environment:
deb and rpm:
sudo metricbeat setup -e
mac and linux:
./metricbeat setup -e
brew:
metricbeat setup -e
win:
PS C:\Program Files\Metricbeat> metricbeat.exe setup -e
The
setupcommand loads the Kibana dashboards. If the dashboards are already set up, omit this command. The-eflag is optional and sends output to standard error instead of syslog. -
deb and rpm:
sudo service metricbeat start
mac and linux:
./metricbeat -e
brew:
metricbeat -e
win:
PS C:\Program Files\Metricbeat> Start-Service metricbeat
Metricbeat runs and starts sending system metrics to Elasticsearch.
Visualize system metrics in Kibana
editTo visualize system metrics, open your browser and navigate to the Metricbeat system overview dashboard: http://localhost:5601/app/kibana#/dashboard/Metricbeat-system-overview-ecs
If you don’t see data in Kibana, try changing the date range to a larger range. By default, Kibana shows the last 15 minutes. If you see errors, make sure Metricbeat is running, then refresh the page.
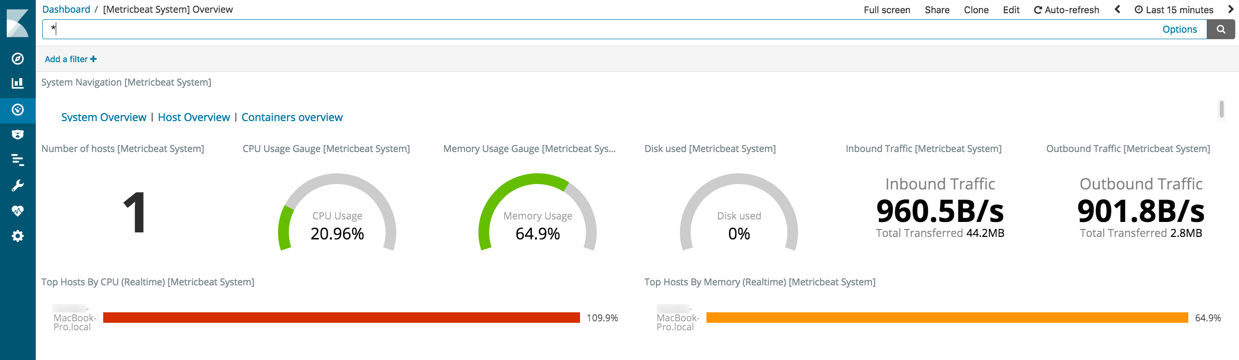
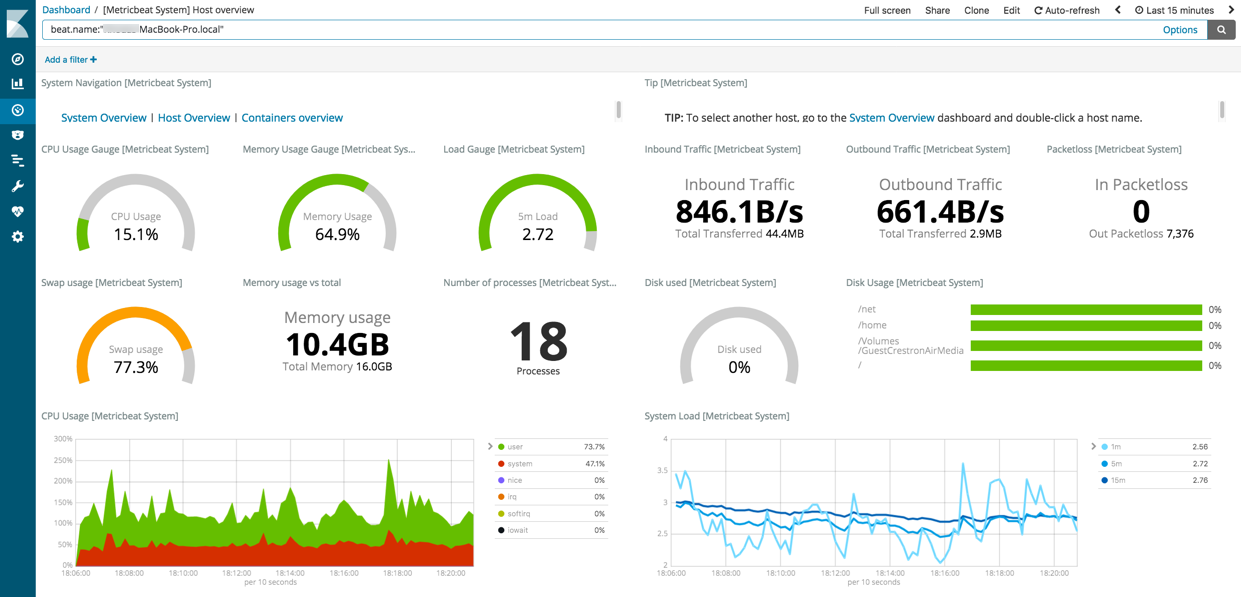
Click Host Overview to see detailed metrics about the selected host.
Now that you know how to set up the simplest architecture for the Elastic Stack—one or more Beats sending event data directly to an Elasticsearch instance running on the same server—let’s add Logstash.
Install Logstash (optional)
editLogstash is a powerful tool that integrates with a wide variety of deployments. It offers a large selection of plugins to help you parse, enrich, transform, and buffer data from a variety of sources. If your data requires additional processing that is not available in Beats, then you need to add Logstash to your deployment.
To download and install Logstash, open a terminal window and use the commands that work with your system:
deb:
curl -L -O https://artifacts.elastic.co/downloads/logstash/logstash-7.7.1.deb
sudo dpkg -i logstash-7.7.1.deb
rpm:
curl -L -O https://artifacts.elastic.co/downloads/logstash/logstash-7.7.1.rpm
sudo rpm -i logstash-7.7.1.rpm
mac and linux:
curl -L -O https://artifacts.elastic.co/downloads/logstash/logstash-7.7.1.tar.gz
tar -xzvf logstash-7.7.1.tar.gz
brew:
brew tap elastic/tap
brew install elastic/tap/logstash-full
win:
- Download the Logstash 7.7.1 Windows zip file from the Logstash download page.
-
Extract the contents of the zip file to a directory on your computer, for
example,
C:\Program Files. Use a short path (fewer than 30 characters) to avoid running into file path length limitations on Windows.
For other operating systems, go to the Logstash download page.
To learn more about installing, configuring, and running Logstash, read the Logstash Reference.
Configure Logstash to listen for Beats input
editLogstash provides input plugins for reading from a variety of inputs. In this guide, you create a Logstash pipeline configuration that listens for Beats input and sends the received events to the Elasticsearch output.
To configure Logstash:
-
Create a new Logstash pipeline configuration file called
demo-metrics-pipeline.conf. If you installed Logstash as a deb or rpm package, create the file in the Logstashconfigdirectory. The file must contain:- An input stage that configures Logstash to listen on port 5044 for incoming Beats connections.
- An output stage that indexes events into Elasticsearch. The output stage also configures Logstash to write to the Metricbeat index.
For example:
input {
  beats {
    port => 5044
  }
}

# The filter part of this file is commented out to indicate that it
# is optional.
# filter {
#
# }

output {
  elasticsearch {
    hosts => "localhost:9200"
    manage_template => false
    index => "%{[@metadata][beat]}-%{[@metadata][version]}-%{+YYYY.MM.dd}"
  }
}
When you start Logstash with this pipeline configuration, Beats events are routed through Logstash, where you have full access to Logstash capabilities for collecting, enriching, and transforming data.
Start Logstash
editUse the command that works with your system. If you installed Logstash as a deb or
rpm package, make sure the config file is in the config directory.
For other platforms, a config directory isn’t required, but it’s a best
practice to be consistent.
deb:
sudo /etc/init.d/logstash start
rpm:
sudo service logstash start
mac and linux:
cd logstash-7.7.1
./bin/logstash -f path/to/config/demo-metrics-pipeline.conf
brew:
logstash -f path/to/config/demo-metrics-pipeline.conf
win:
bin\logstash.bat -f path\to\config\demo-metrics-pipeline.conf
If you receive JVM error messages, check your Java version as shown in Installing Logstash.
Logstash starts listening for events from the Beats input. Next you need to configure Metricbeat to send events to Logstash.
Configure Metricbeat to send events to Logstash
editMetricbeat sends events to Elasticsearch by default. To send events to Logstash, modify the
Metricbeat configuration file, metricbeat.yml. You’ll find this file under
the Metricbeat install directory, /etc/metricbeat for rpm and deb, or
/usr/local/etc/metricbeat for brew.
Disable the output.elasticsearch section by commenting it out, then enable
the output.logstash section by uncommenting it:
#-------------------------- Elasticsearch output ------------------------------
#output.elasticsearch:
  # Array of hosts to connect to.
  #hosts: ["localhost:9200"]
.
.
.
#----------------------------- Logstash output --------------------------------
output.logstash:
  # The Logstash hosts
  hosts: ["localhost:5044"]
Save the file, then restart Metricbeat to apply the configuration changes.
Logstash reads from the Beats input and indexes events into Elasticsearch. You haven’t defined a filter section yet, so Logstash simply forwards events to Elasticsearch without additional processing. Next, you learn how to define the filter stage.
Define a filter to extract data from a field
editThe system metrics collected by Metricbeat include a field called cmdline
that contains the full command-line arguments used to start system processes.
For example:
"cmdline": "/Applications/Firefox.app/Contents/MacOS/plugin-container.app/Contents/MacOS/plugin-container -childID 3
-isForBrowser -boolPrefs 36:1|299:0| -stringPrefs 285:38;{b77ae304-9f53-a248-8bd4-a243dbf2cab1}| -schedulerPrefs
0001,2 -greomni /Applications/Firefox.app/Contents/Resources/omni.ja -appomni
/Applications/Firefox.app/Contents/Resources/browser/omni.ja -appdir
/Applications/Firefox.app/Contents/Resources/browser -profile
/Users/dedemorton/Library/Application Support/Firefox/Profiles/mftvzeod.default-1468353066634
99468 gecko-crash-server-pipe.99468 org.mozilla.machname.1911848630 tab"
Rather than sending the whole command-line argument to Elasticsearch, you might want to send just the command’s path. One way to do that is by using a Grok filter. Learning Grok is beyond the scope of this getting started guide, but if you want to learn more, see the Grok filter plugin documentation.
To extract the path, add the following Grok filter between the input and output sections in the Logstash config file that you created earlier:
filter {
  if [system][process] {
    if [system][process][cmdline] {
      grok {
        match => {
          "[system][process][cmdline]" => "^%{PATH:[system][process][cmdline_path]}"
        }
        remove_field => "[system][process][cmdline]"
      }
    }
  }
}
|
Uses a pattern to match the path, then stores the path in a field called
|
|
|
Removes the original field, |
When you’re done, the full configuration file should look like this:
input {
  beats {
    port => 5044
  }
}

filter {
  if [system][process] {
    if [system][process][cmdline] {
      grok {
        match => {
          "[system][process][cmdline]" => "^%{PATH:[system][process][cmdline_path]}"
        }
        remove_field => "[system][process][cmdline]"
      }
    }
  }
}

output {
  elasticsearch {
    hosts => "localhost:9200"
    manage_template => false
    index => "%{[@metadata][beat]}-%{[@metadata][version]}-%{+YYYY.MM.dd}"
  }
}
Restart Logstash to pick up the changes. The event now includes a field called
cmdline_path that contains the command path:
"cmdline_path": "/Applications/Firefox.app/Contents/MacOS/plugin-container.app/Contents/MacOS/plugin-container"
What’s next?
editCongratulations! You’ve successfully set up the Elastic Stack. You learned how to stream system metrics to Elasticsearch and visualize the data in Kibana. You also learned how to use Logstash to filter events collected by Metricbeat.
Next, you’ll want to set up the Elastic Stack security features and activate your trial license so you can unlock the full capabilities of the Elastic Stack. To learn how, read:
Want to get up and running quickly with metrics monitoring and centralized log analytics? Try out the Metrics app and the Logs app in Kibana. For more details, see the Metrics Monitoring Guide and the Logs Monitoring Guide.
Later, when you’re ready to set up a production environment, also see the Elastic Stack Installation and Upgrade Guide.