Quick start
editQuick start
editThis guide describes how to:
- Collect Application Performance Monitoring (APM) data
- Send APM data to the Elastic Stack
- Explore and visualize the data in real-time
For feedback and questions, please contact us in the discuss forum.
Prerequisites
edit-
You need Elasticsearch for storing and searching your data, and Kibana for visualizing and managing it. You can use our hosted Elasticsearch Service on Elastic Cloud (recommended), or self-manage the Elastic Stack on your own hardware.
Here’s what you need for each deployment type:
- Access to a deployment of our hosted Elasticsearch Service on Elastic Cloud. The Elasticsearch Service is available on AWS, GCP, and Azure. Try it out for free. This deployment must include an APM & Fleet node.
- User with the superuser role. See Built-in roles.
- Access to an Elasticsearch cluster and Kibana (version 7.17) with a basic license. Learn how to install the Elastic Stack on your own hardware.
- Secure, encrypted connection between Kibana and Elasticsearch. For more information, see Configure security for the Elastic Stack.
- User with the superuser role. See Built-in roles.
-
In the Elasticsearch configuration, the
built-in API key
service must be enabled.
(
xpack.security.authc.api_key.enabled: true) -
In the Kibana configuration, the saved objects encryption key
must be set. Fleet requires this setting in order to save API keys and encrypt
them in Kibana. You can either set
xpack.encryptedSavedObjects.encryptionKeyto an alphanumeric value of at least 32 characters, or run thekibana-encryption-keyscommand to generate the key.
Example security settings
For testing purposes, you can use the following settings to get started quickly, but make sure you properly secure the Elastic Stack before sending real data.
elasticsearch.yml example:
xpack.security.enabled: true
xpack.security.authc.api_key.enabled: true
kibana.yml example:
elasticsearch.username: "kibana_system"
xpack.security.enabled: true
xpack.encryptedSavedObjects.encryptionKey: "something_at_least_32_characters"
The password should be stored in the Kibana keystore as described in the Elasticsearch security documentation.
-
An internet connection is required for Kibana to download integration packages
from the Elastic Package Registry. Make sure the Kibana server can connect to
https://epr.elastic.coon port443. - Fleet is currently only available to users with the superuser role.
Step 1: Set up Fleet
editUse Fleet in Kibana to get APM data into the Elastic Stack.
The first time you use Fleet, you might need to set it up and add a Fleet Server:
Elastic Cloud runs a hosted version of Fleet Server. No extra setup is required unless you want to scale your deployment.
To confirm that Fleet Server is available in your deployment:
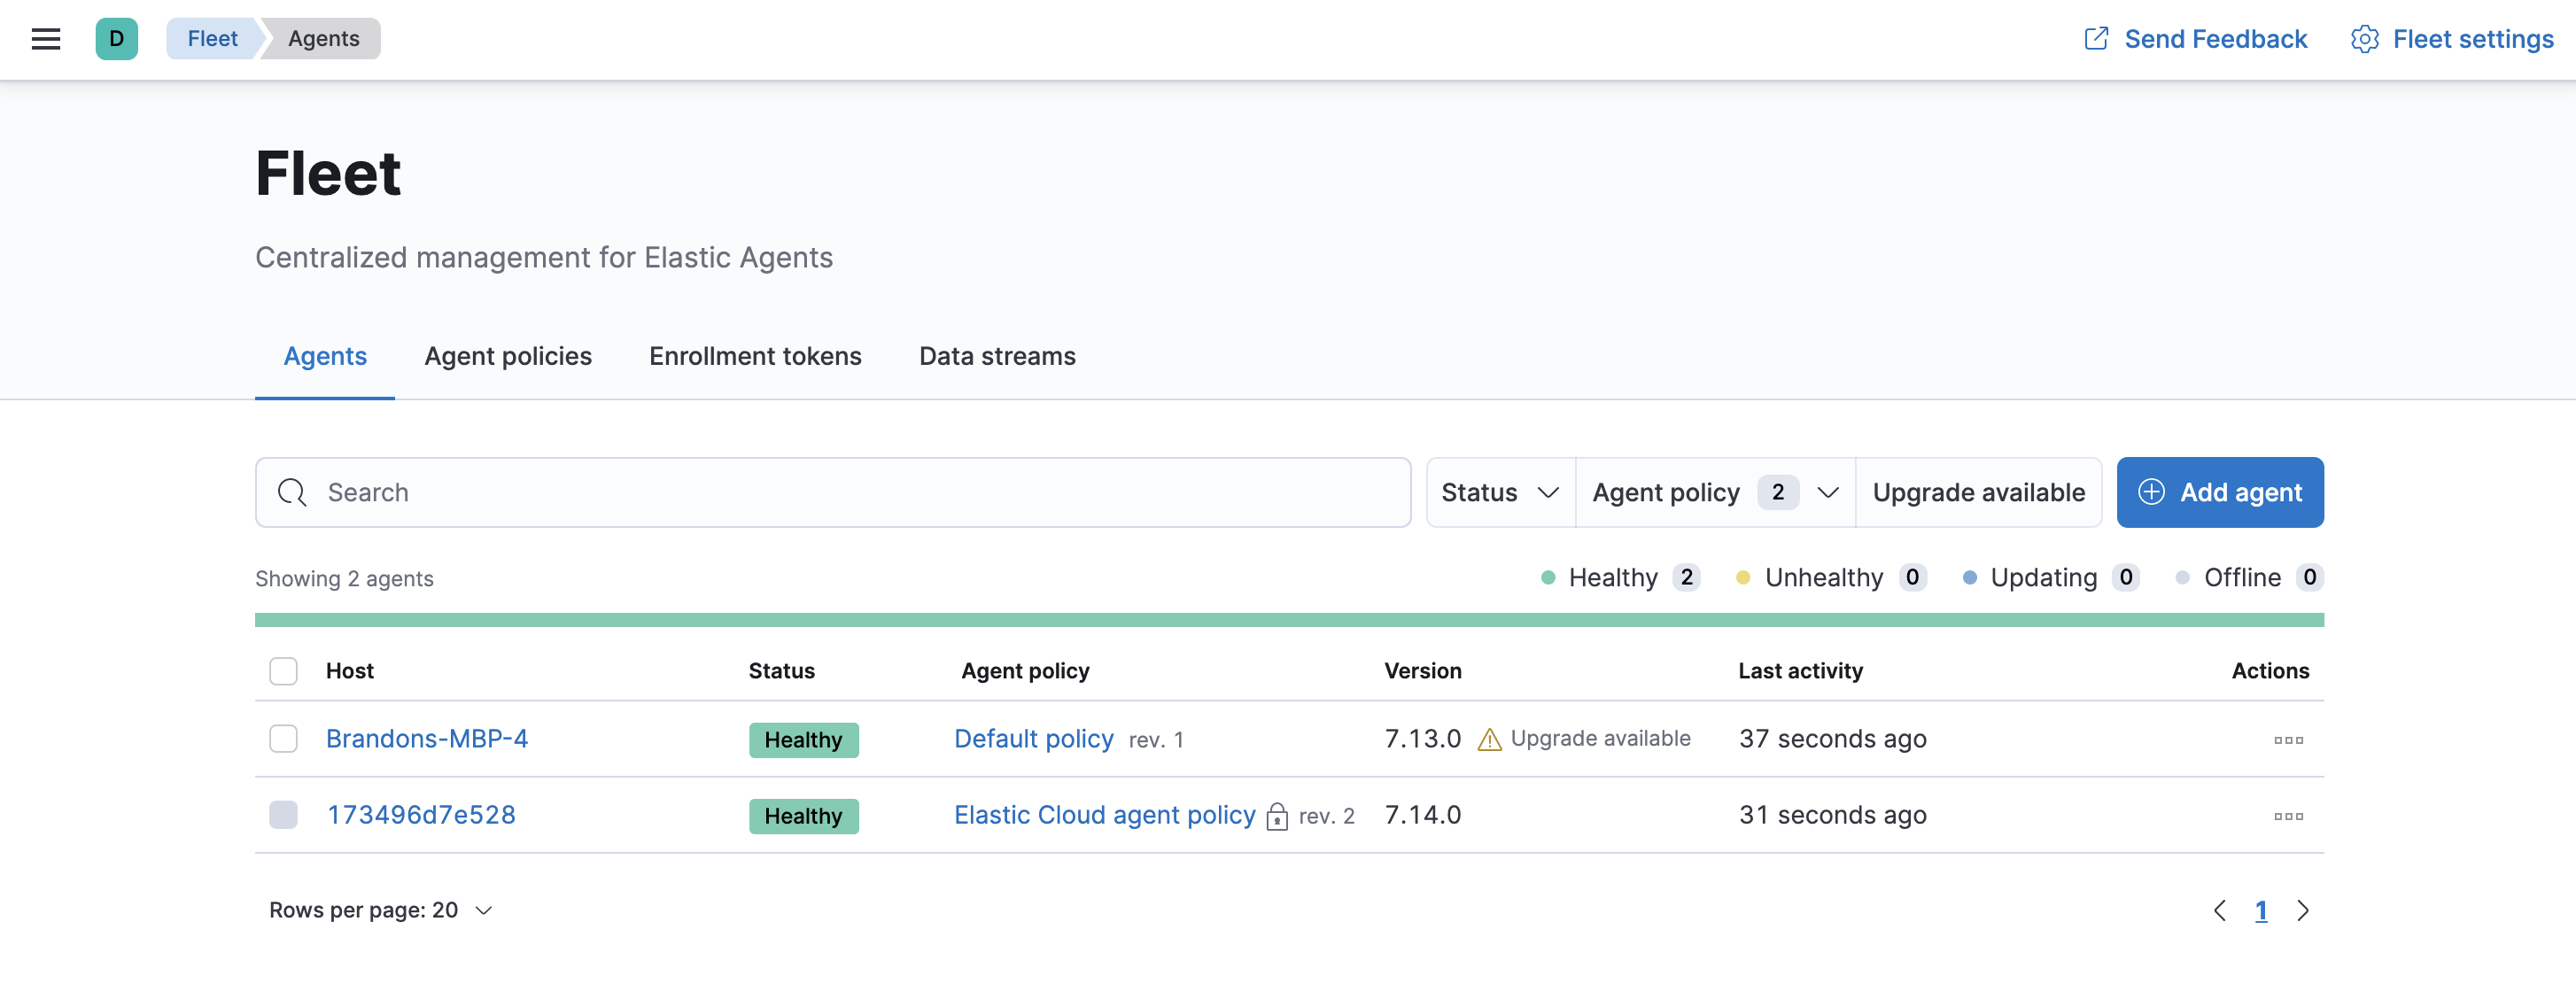
- Log in to Kibana and go to Management > Fleet.
- Click the Agents tab.
- Under Agent policy, look for Elastic Cloud agent policy — Fleet Server is the agent enrolled in the Elastic Cloud agent policy. This policy is managed by Elastic Cloud. You cannot modify it. Confirm that the agent status is Healthy.
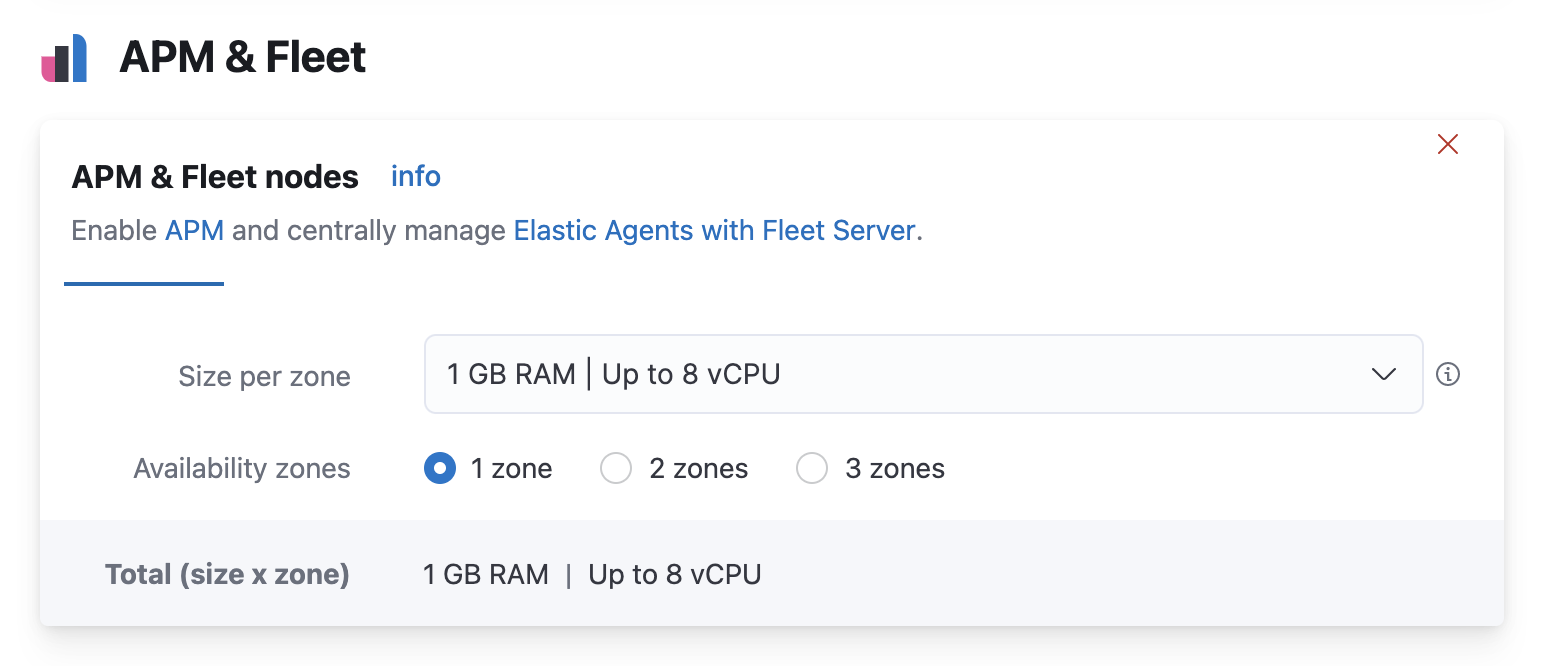
Don’t see the Fleet Server agent? Make sure your deployment includes an APM & Fleet node. This node is required to use Fleet Server.
When using our hosted Elasticsearch Service, it’s recommended that you use our hosted version of Fleet Server. However, you can choose to deploy and self-manage Fleet Servers.
To deploy a self-managed Fleet Server, install an Elastic Agent and enroll it in an agent policy containing the Fleet Server integration.
You can install only a single Elastic Agent per host, which means you cannot run Fleet Server and another Elastic Agent on the same host unless you deploy a containerized Fleet Server.
- Log in to Kibana and go to Management > Fleet. The first time you visit this page, it might take a minute to load.
-
Click Fleet settings, and in the Fleet Server hosts field, specify the
URLs Elastic Agents will use to connect to Fleet Server. For example,
https://192.0.2.1:8220, where192.0.2.1is the host IP where you will install Fleet Server. -
In the Elasticsearch hosts field, specify the Elasticsearch URLs where Elastic Agents will send data. For example,
https://192.0.2.0:9200.For more information about these settings, see Fleet settings.
- Save and apply the settings.
-
Click the Agents tab and follow the in-product instructions to add a Fleet server:
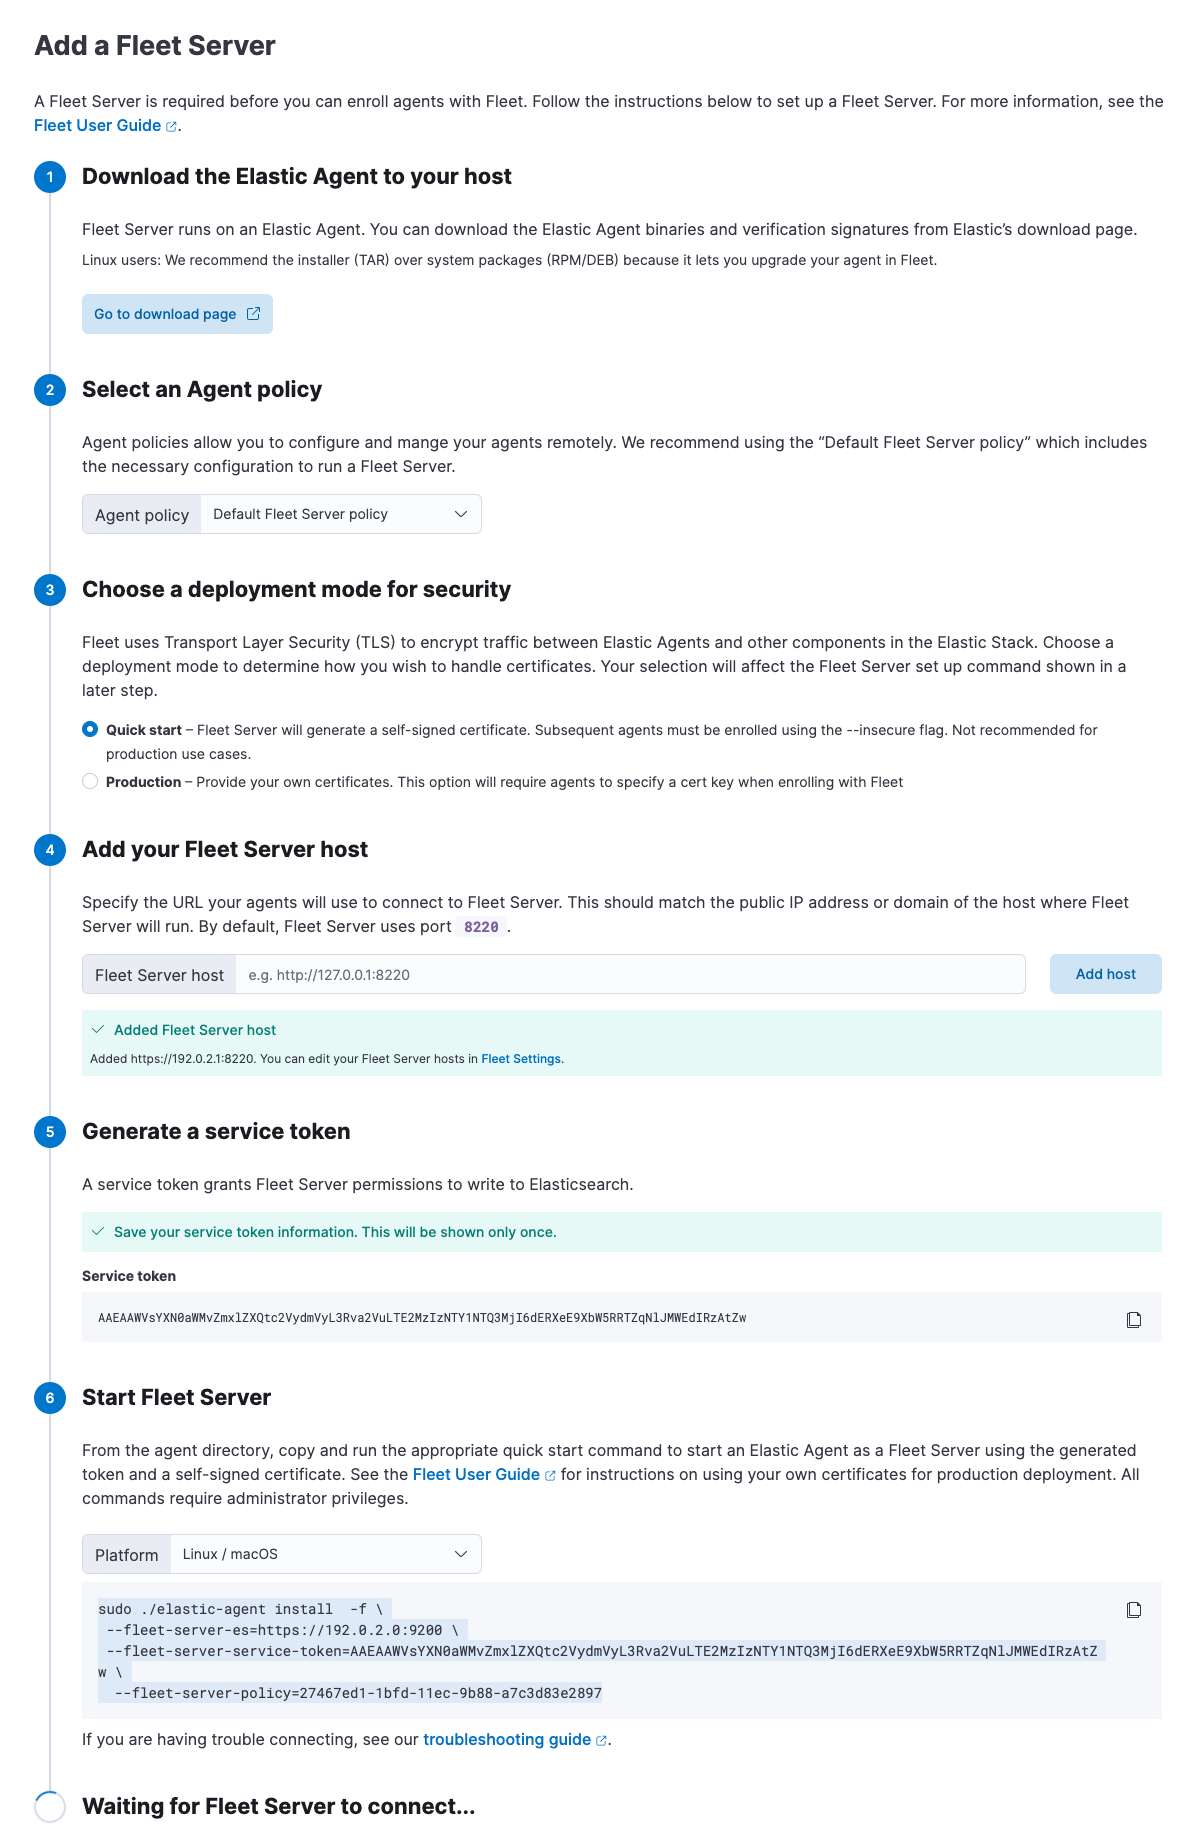
Notes:
- Make sure you download an x64 architecture installation package.
-
For the agent policy, choose one with a Fleet Server integration. If one doesn’t exist, create it.
- If you choose Production deployment mode, learn how to generate certs in Encrypt traffic in clusters with a self-managed Fleet Server.
-
It’s recommended you generate a unique service token for each
Fleet Server. For other ways to generate service tokens, see
elasticsearch-service-tokens. -
The
installcommand installs the Elastic Agent as a managed service and enrolls it in a Fleet Server policy. For example, the following command installs a Fleet Server and uses self-signed certs:sudo ./elastic-agent install -f \ --fleet-server-es=http://localhost:9200 \ --fleet-server-service-token=AAEbAWVsYXN0aWMvZmxlaXQtc2VydmVzL3Rva2VuLTE2MeIzNTY1NTQ3Mji6dERXeE9XbW5RRTZqNlJMWEdIRzAtZw \ --fleet-server-policy=27467ed1-1bfd-11ec-9b88-a7c3d83e2897 --fleet-server-insecure-http
The following command installs a Fleet Server and uses certificates you provide. Make sure you replace the values in angle brackets.
sudo ./elastic-agent install --url=https://192.0.2.1:8220 \
 -f \
 --fleet-server-es=https://192.0.2.0:9200 \
 --fleet-server-service-token=AAEAaWVsYXN0aWcvZmxlZXQtc2VydmVyL3rva2VuLTE2MzIzNTYcNTQ3MjI6dER1eE9XbW5RRTZqNlJMWEdIRzAtZw \
  --fleet-server-policy=27467ed1-1bfd-11ec-9b88-a7c3d83e2897 \
  --certificate-authorities=<PATH_TO_CA> \
  --fleet-server-es-ca=<PATH_TO_ES_CERT> \
  --fleet-server-cert=<PATH_TO_FLEET_SERVER_CERT> \
  --fleet-server-cert-key=<PATH_TO_FLEET_SERVER_CERT_KEY>
For more Fleet Server commands, see Elastic Agent command reference.
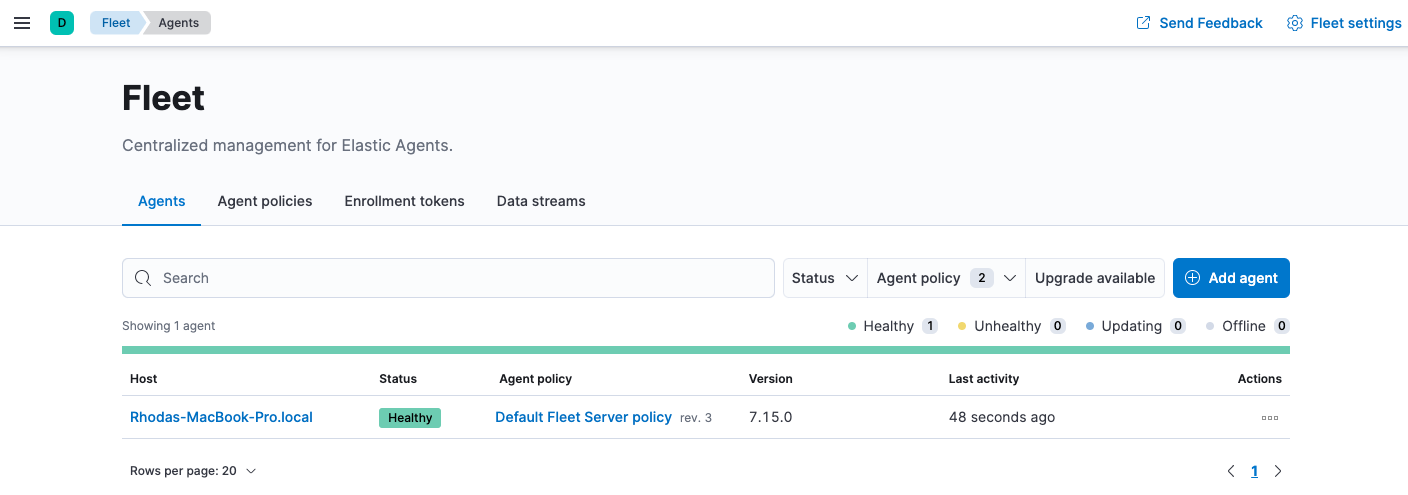
If installation is successful, you’ll see the Fleet Server Elastic Agent on the Agents tab in Fleet. Notice that the Default Fleet Server Policy is assigned to the Elastic Agent. This policy is created when you run Fleet for the first time.
For more information, refer to Fleet Server.
Step 2: Add an Elastic Agent to Fleet
editElastic Agent is a single, unified agent that you can deploy to hosts or containers to collect data and send it to the Elastic Stack. Behind the scenes, Elastic Agent runs the Beats shippers or Elastic Endpoint required for your configuration.
Don’t confuse Elastic Agent with APM agents–they are different components. In a later step, you’ll instrument your code with APM agents and send the data to an APM Server instance that Elastic Agent spins up.
If you plan on enabling Real User Monitoring (RUM), you must run Elastic Agent centrally. If RUM is disabled, you should run Elastic Agent on edge machines.
To send APM data to the Elastic Stack:
-
On the machine where you’ll run Elastic Agent, download and extract the installation package.
curl -L -O https://artifacts.elastic.co/downloads/beats/elastic-agent/elastic-agent-7.17.29-darwin-x86_64.tar.gz
tar xzvf elastic-agent-7.17.29-darwin-x86_64.tar.gz
curl -L -O https://artifacts.elastic.co/downloads/beats/elastic-agent/elastic-agent-7.17.29-linux-x86_64.tar.gz
tar xzvf elastic-agent-7.17.29-linux-x86_64.tar.gz
# PowerShell 5.0+
wget https://artifacts.elastic.co/downloads/beats/elastic-agent/elastic-agent-7.17.29-windows-x86_64.zip -OutFile elastic-agent-7.17.29-windows-x86_64.zip
Expand-Archive .\elastic-agent-7.17.29-windows-x86_64.zip
Or manually:
- Download the Elastic Agent Windows zip file from the download page.
- Extract the contents of the zip file.
To simplify upgrading to future versions of Elastic Agent, we recommended that you use the tarball distribution instead of the DEB distribution.
curl -L -O https://artifacts.elastic.co/downloads/beats/elastic-agent/elastic-agent-7.17.29-amd64.deb
sudo dpkg -i elastic-agent-7.17.29-amd64.deb
To simplify upgrading to future versions of Elastic Agent, we recommended that you use the tarball distribution instead of the RPM distribution.
curl -L -O https://artifacts.elastic.co/downloads/beats/elastic-agent/elastic-agent-7.17.29-x86_64.rpm
sudo rpm -vi elastic-agent-7.17.29-x86_64.rpm
See the download page for other installation options.
- On the Agents tab in Fleet, click Add agent.
-
Under Enroll in Fleet, follow the in-product installation steps (skip the download step if you’ve already done it).
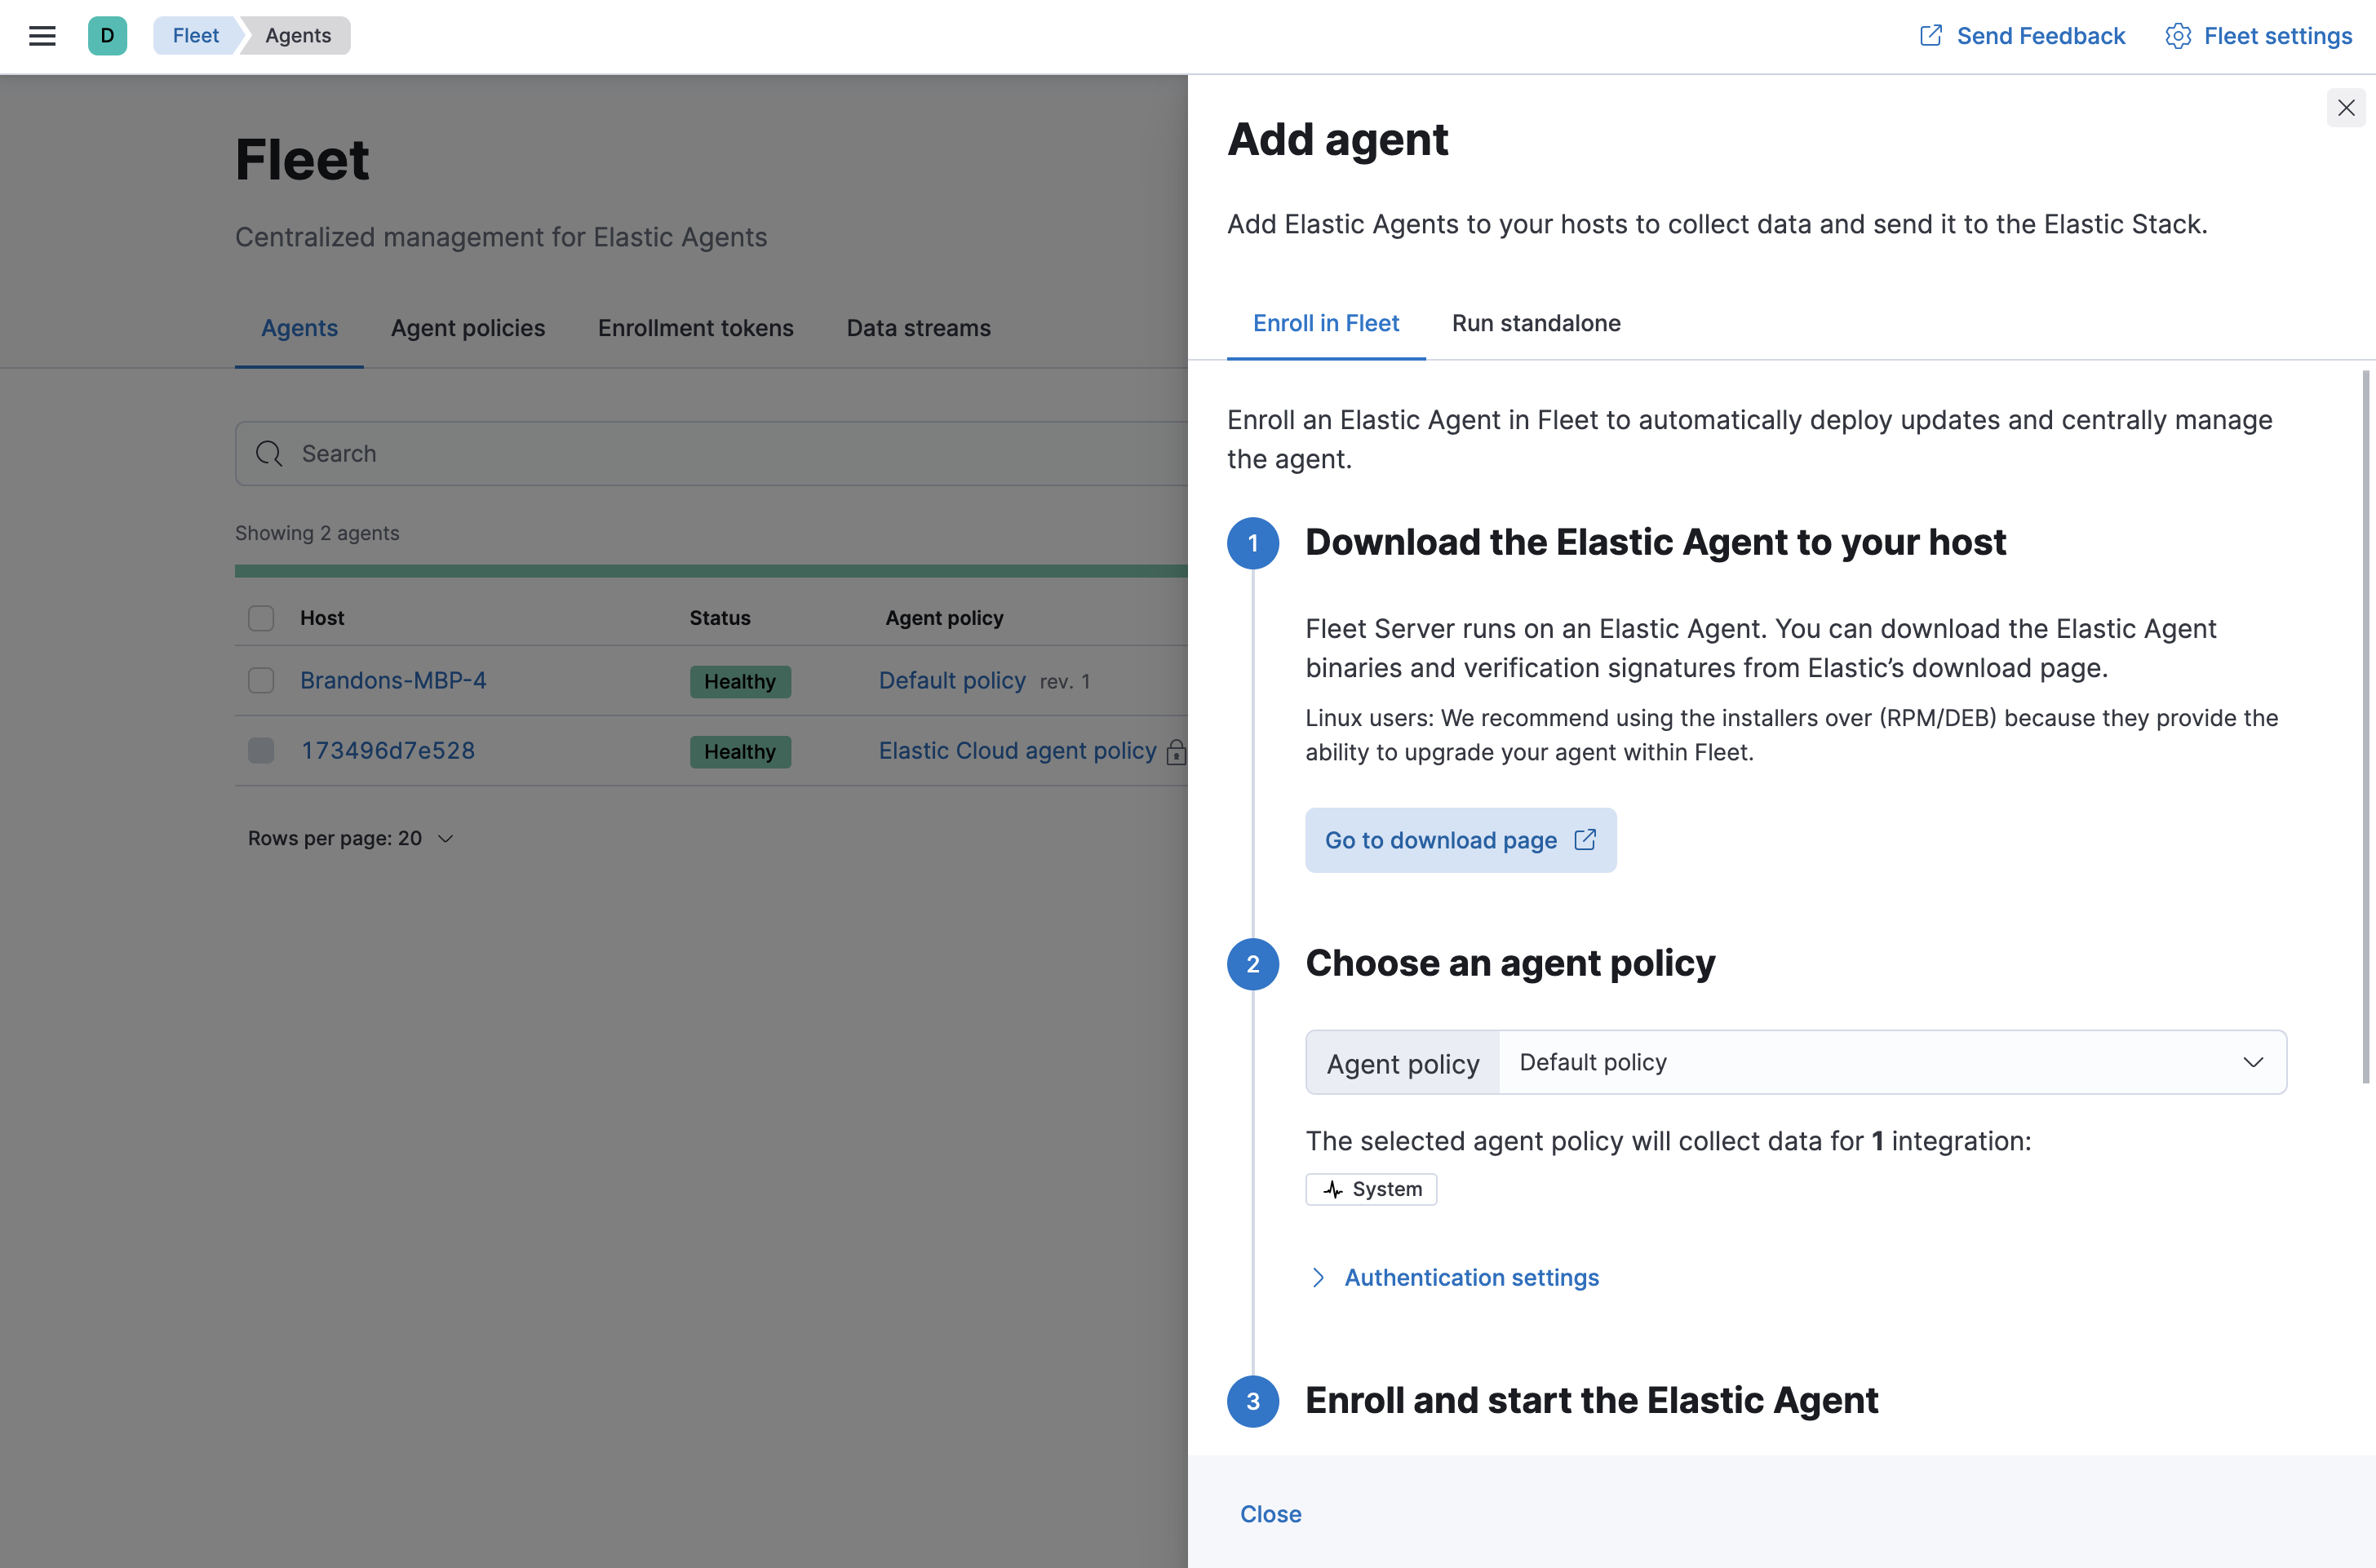
See the download page for other installation options.
Notes:
- Use the default agent policy to get started quickly. This policy includes a system integration for collecting logs and metrics from the host system. You can change the policy later.
-
On macOS, Linux (tar package), and Windows, run the
installcommand to install Elastic Agent as a managed service, enroll it in Fleet, and start the service. The DEB and RPM packages include a service unit for Linux systems with systemd, so use theenrollcommand instead ofinstall.You must run this command as the root user because some integrations require root privileges to collect sensitive data.
You must run this command as the root user because some integrations require root privileges to collect sensitive data.
Open a PowerShell prompt as an Administrator (right-click the PowerShell icon and select Run As Administrator).
From the PowerShell prompt, change to the directory where you installed Elastic Agent, and run:
You must run this command as the root user because some integrations require root privileges to collect sensitive data.
sudo elastic-agent enroll --url=<fleet_server_url> --enrollment-token=<enrollment_token>
sudo systemctl enable elastic-agent
sudo systemctl start elastic-agent
fleet_server_urlis the host and IP where Fleet Server is running, andenrollment_tokenis the enrollment token acquired from Fleet. Not sure where Fleet Server is running? Look at the Fleet settings in Kibana.The DEB package includes a service unit for Linux systems with systemd. On these systems, you can manage Elastic Agent by using the usual systemd commands. If you don’t have systemd, run
sudo service elastic-agent start.You must run this command as the root user because some integrations require root privileges to collect sensitive data.
sudo elastic-agent enroll --url=<fleet_server_url> --enrollment-token=<enrollment_token>
sudo systemctl enable elastic-agent
sudo systemctl start elastic-agent
fleet_server_urlis the host and IP where Fleet Server is running, andenrollment_tokenis the enrollment token acquired from Fleet.The RPM package includes a service unit for Linux systems with systemd. On these systems, you can manage Elastic Agent by using the usual systemd commands. If you don’t have systemd, run
sudo service elastic-agent start.If you see an "x509: certificate signed by unknown authority" error, you might be trying to enroll in a Fleet Server that uses self-signed certs. To fix this problem in a non-production environment, pass the
--insecureflag. For more information, refer to the troubleshooting guide.Refer to Installation layout for the location of installed Elastic Agent files.
Because Elastic Agent is installed as an auto-starting service, it will restart automatically if the system is rebooted.
To confirm that Elastic Agent is installed and running, go to the Agents tab in Fleet. Notice that the Default policy is assigned to the agent.
If the status hangs at Enrolling, make sure the elastic-agent process
is running.
If you run into problems:
- Check the Elastic Agent logs. If you use the default policy, agent logs and metrics are collected automatically unless you change the default settings. For more information, refer to View Elastic Agent logs in Fleet.
- Refer to the troubleshooting guide.
For information about managing Elastic Agent in Fleet, refer to Centrally manage Elastic Agents in Fleet.
Step 3: Add the APM integration
editNext, add the APM integration to the default policy used by your Elastic Agent. Policies manage settings across a group of Elastic Agents and may contain any number of integrations for collecting observability data from the various services running on your host.
-
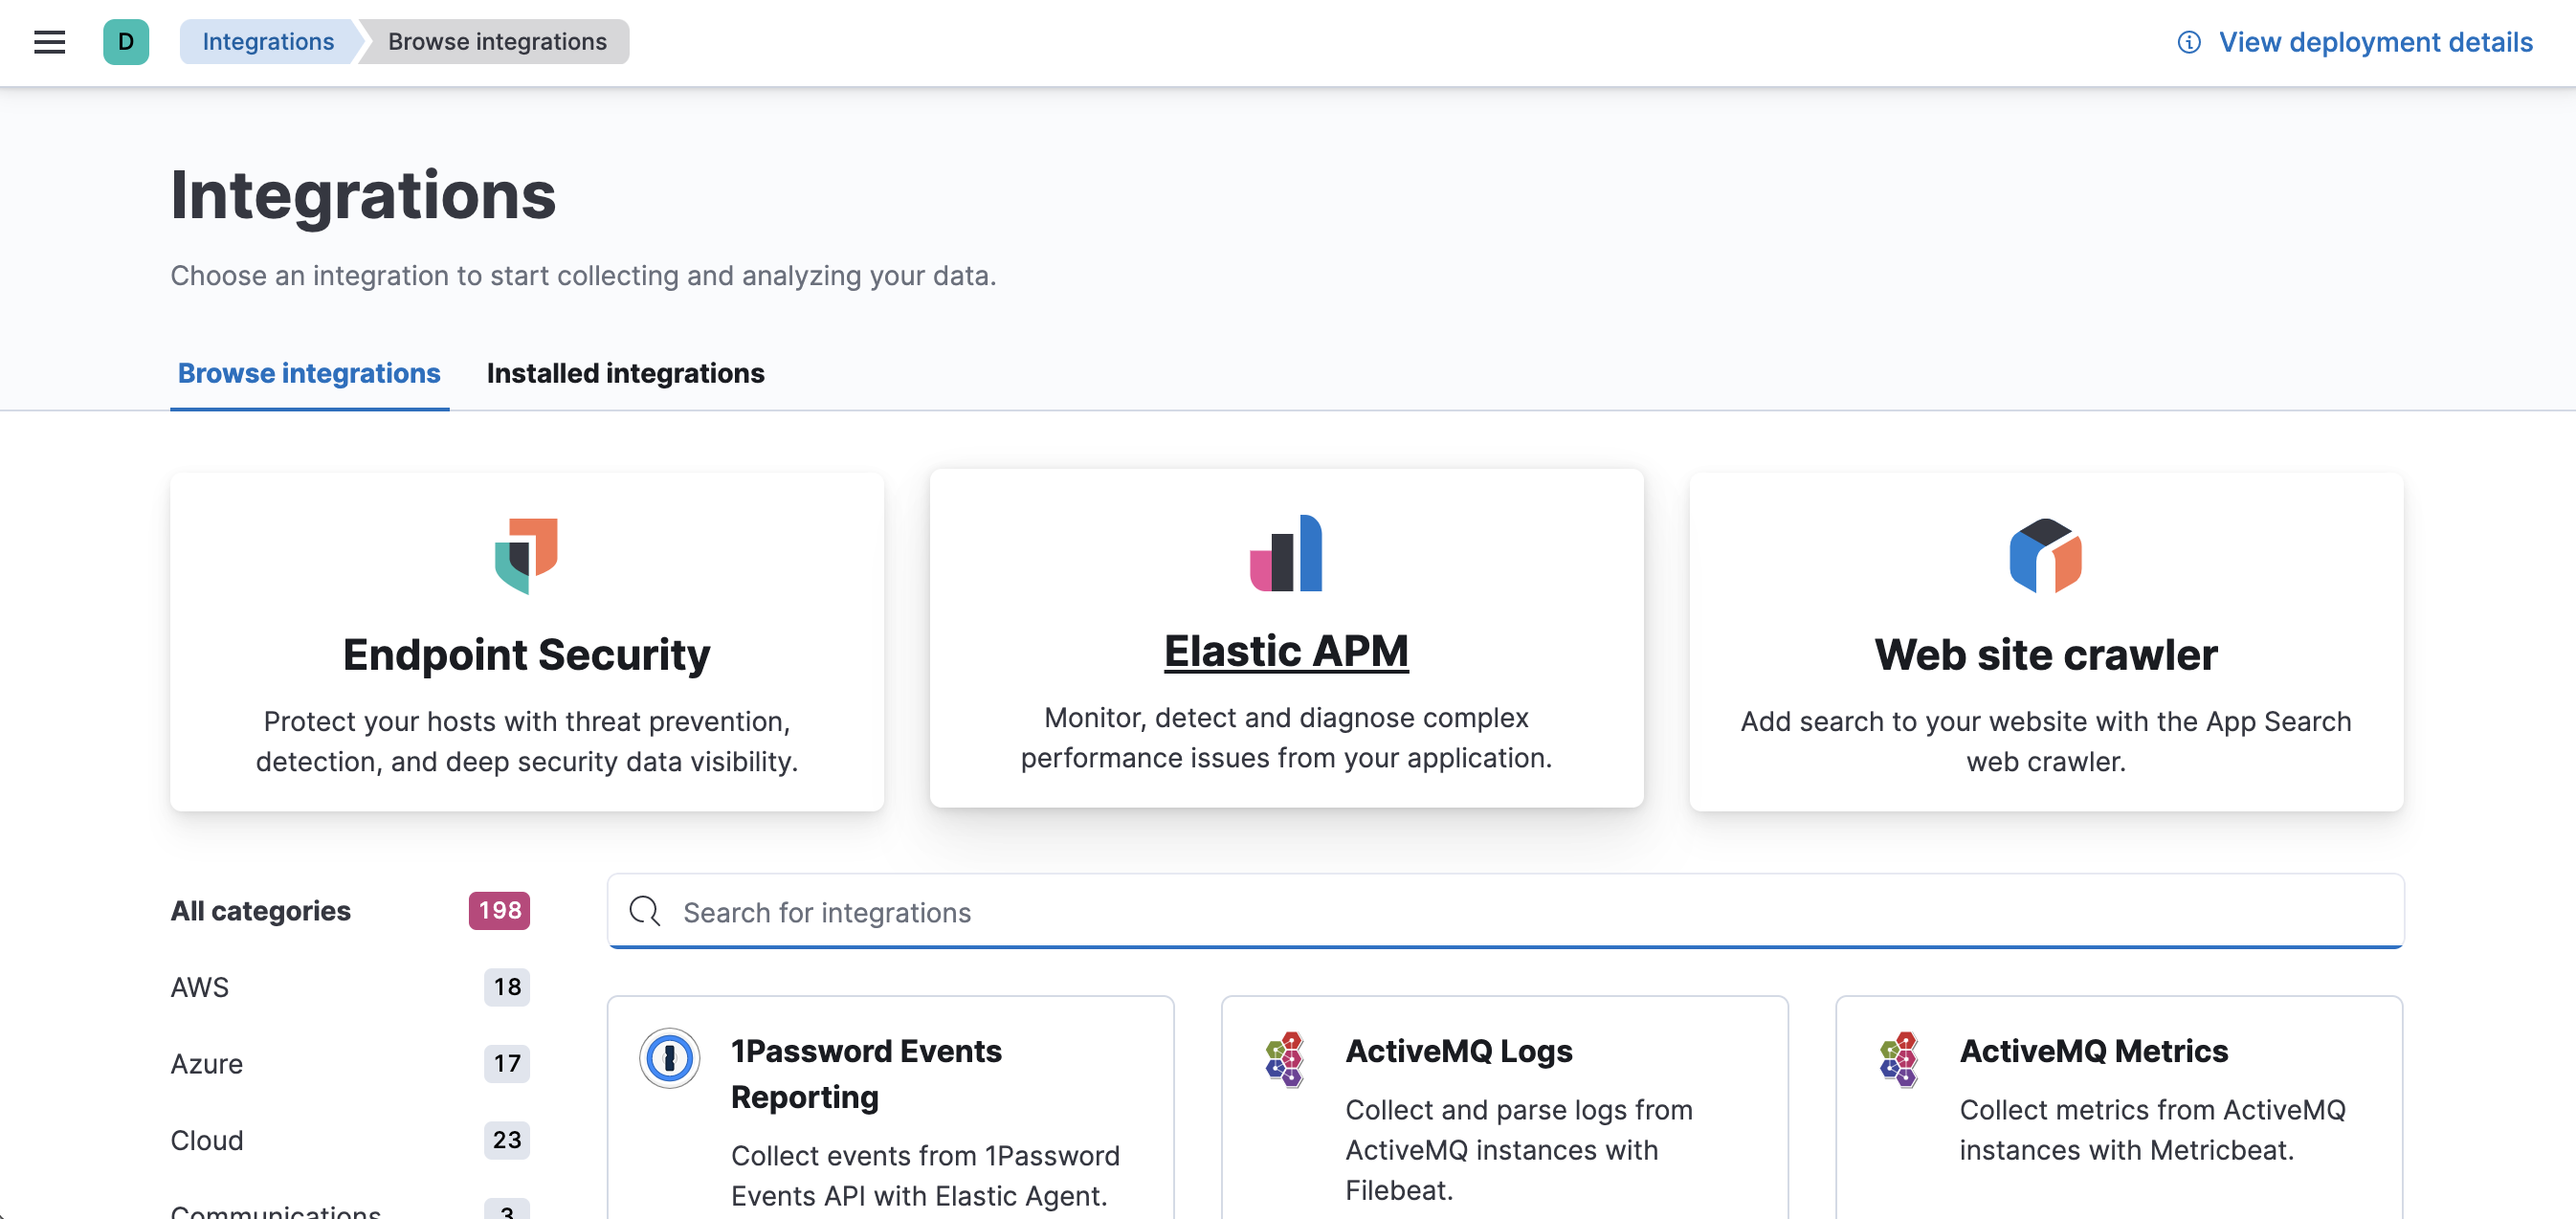
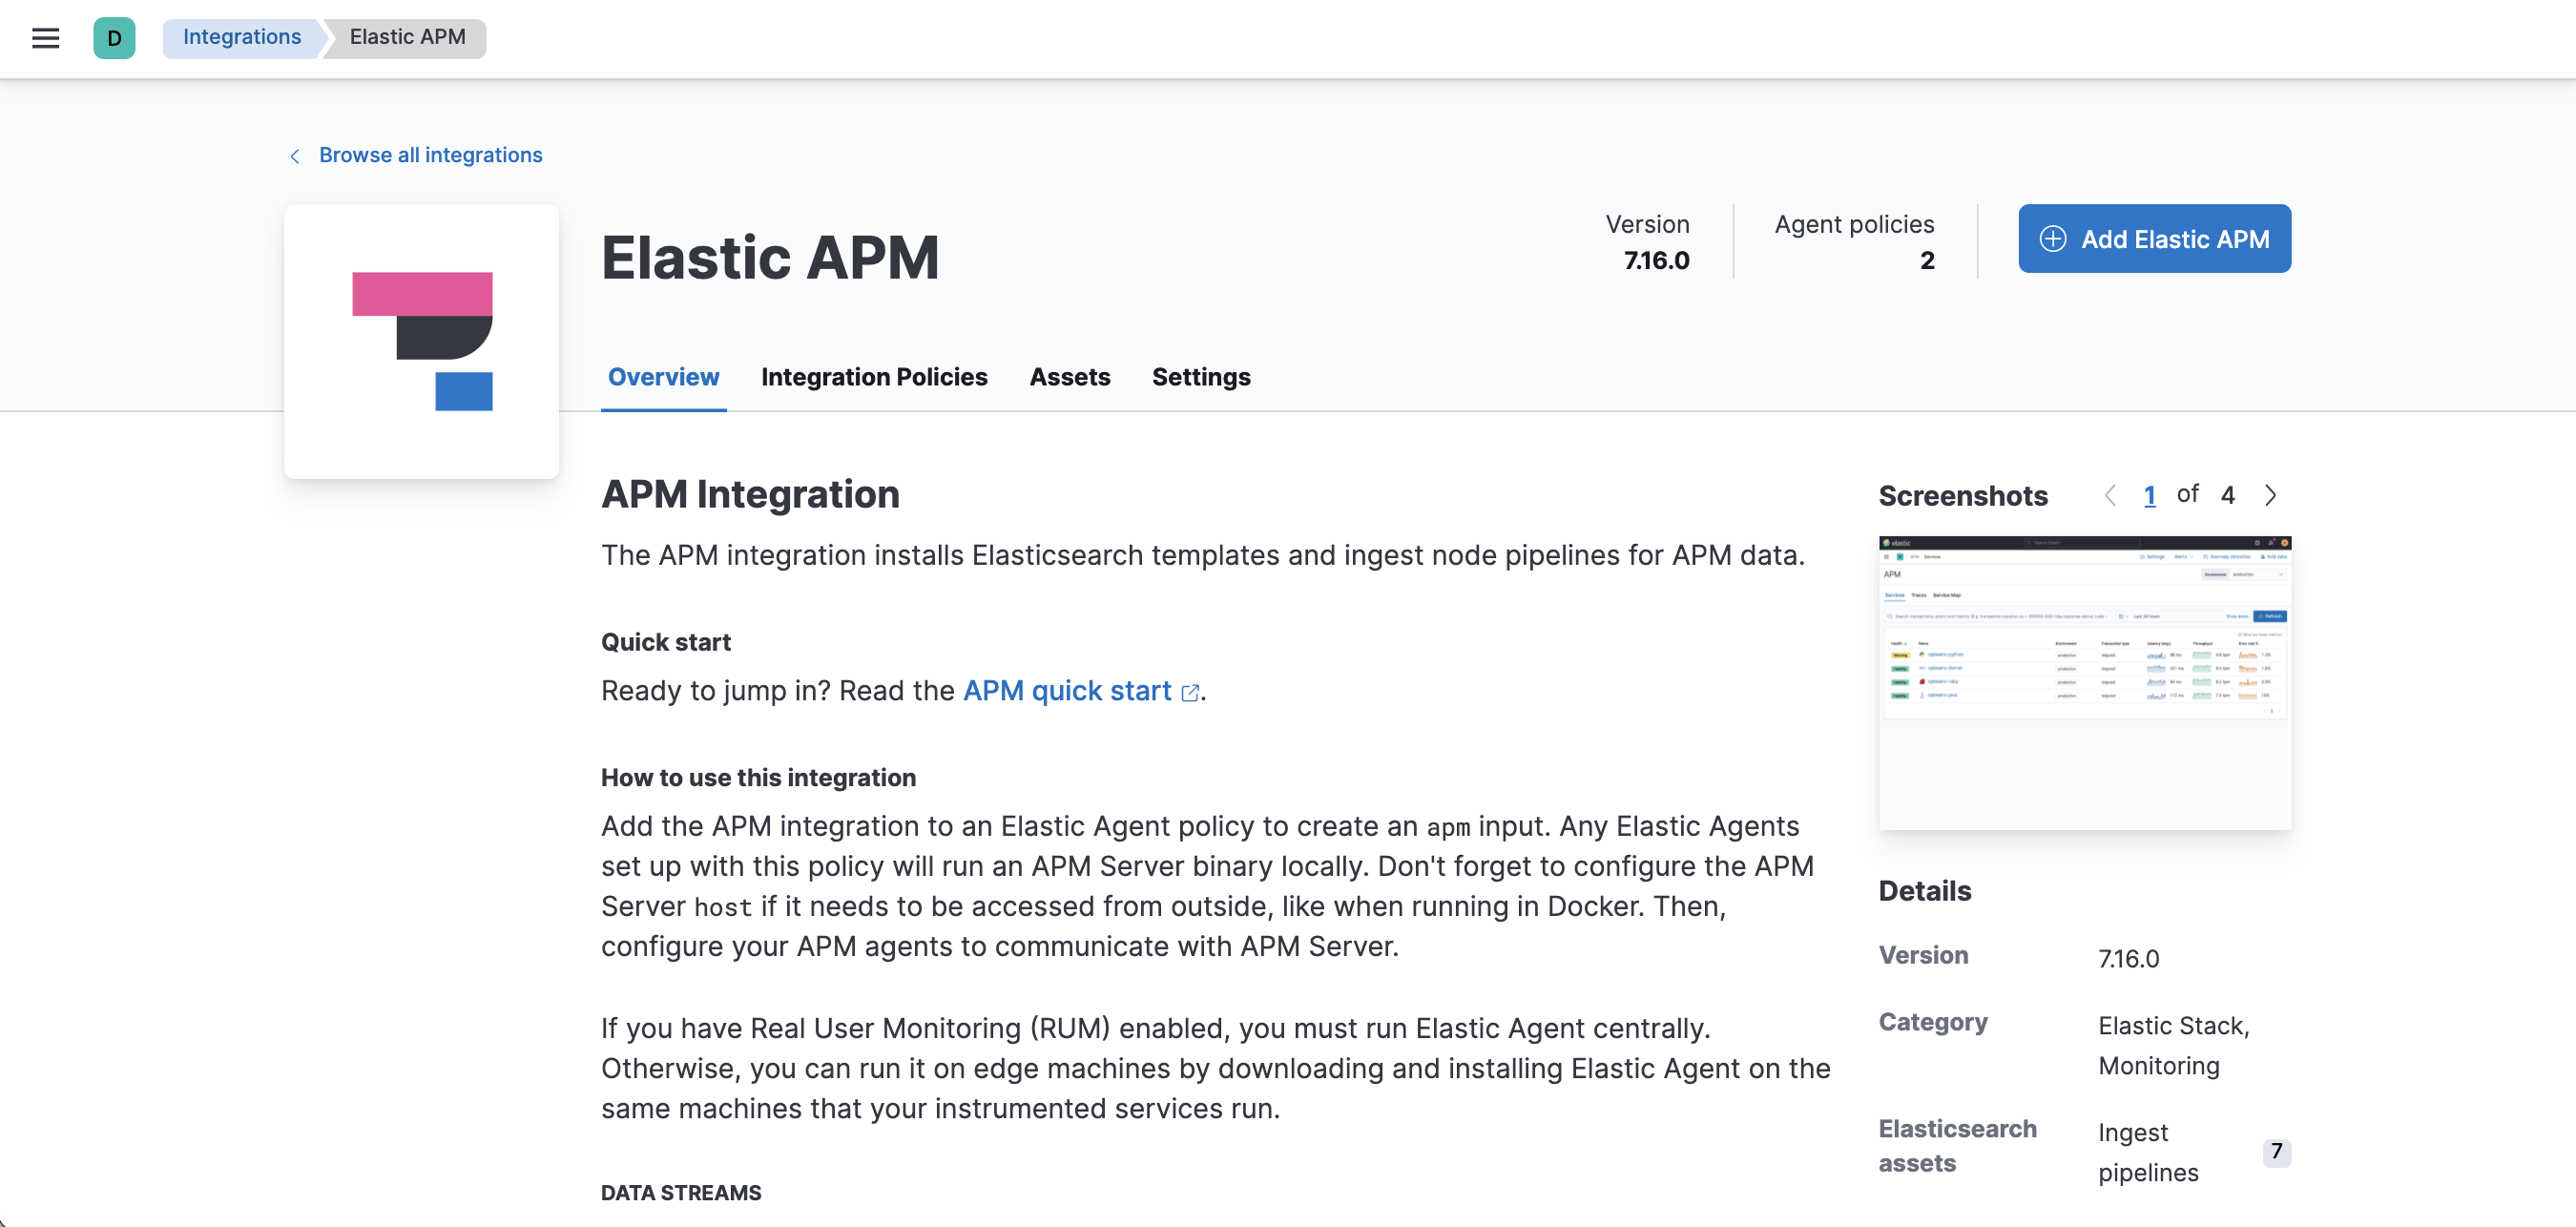
In Kibana, select Add integrations > Elastic APM.
-
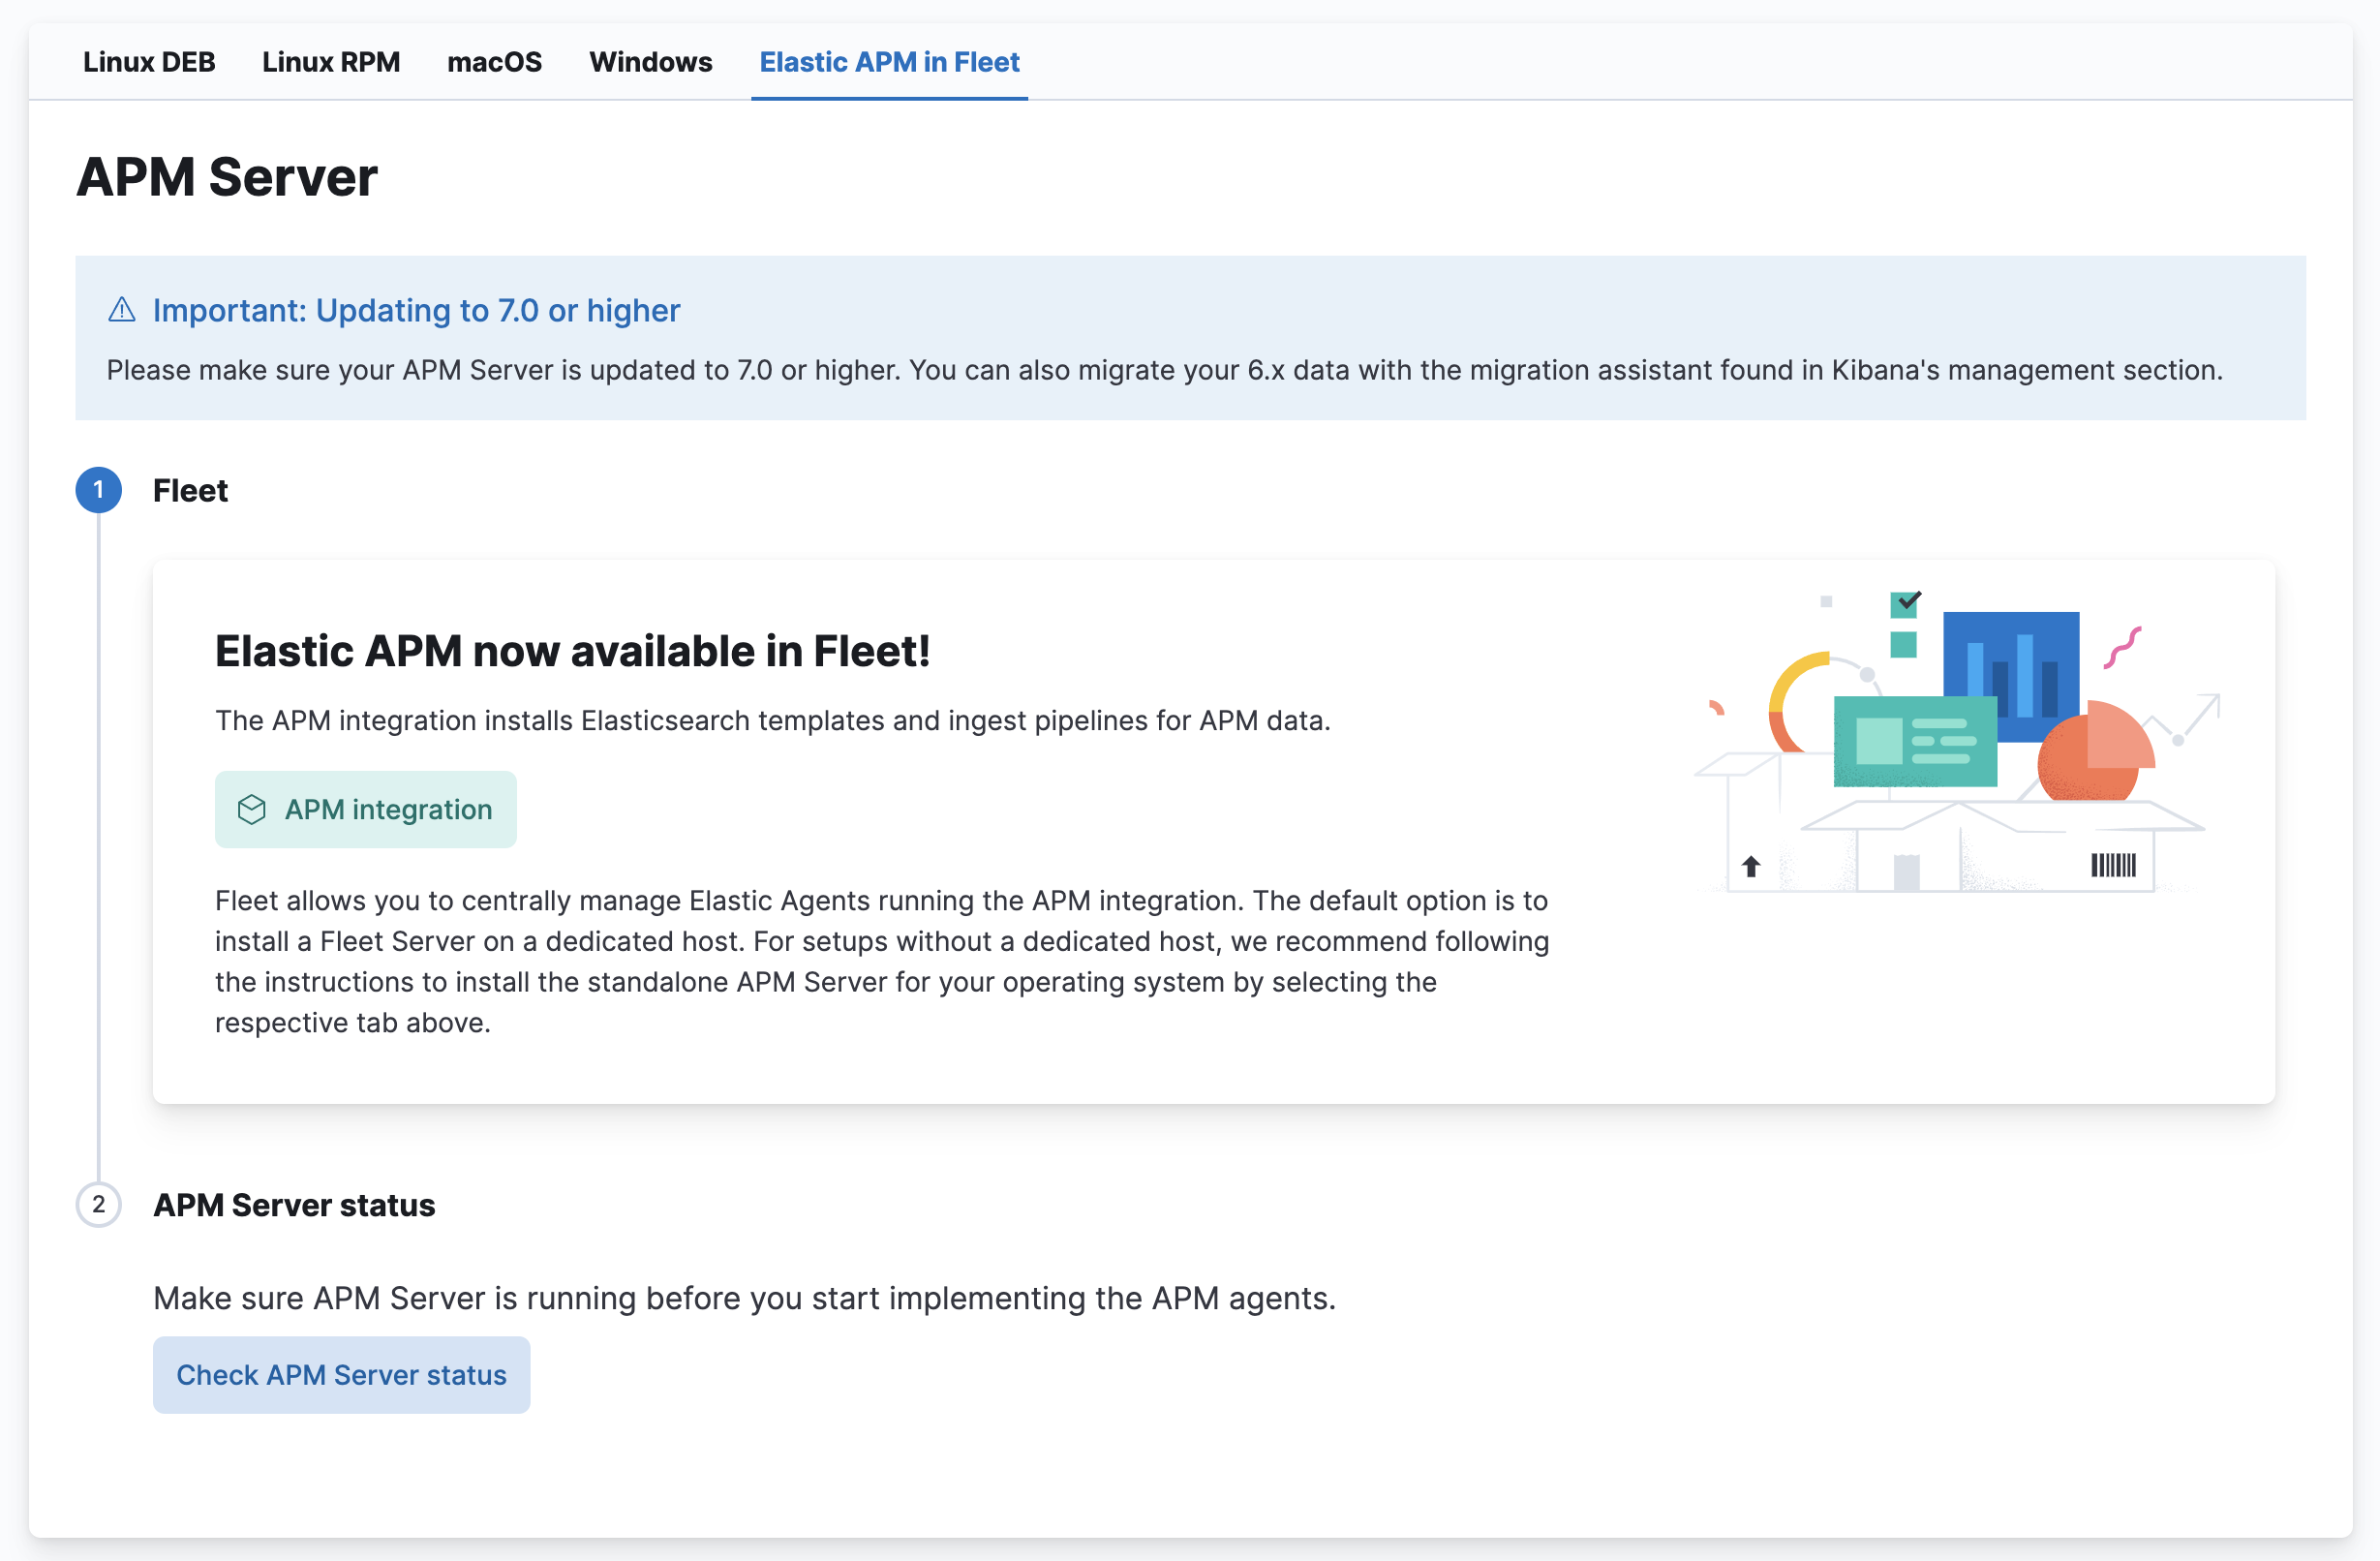
Click APM integration.
-
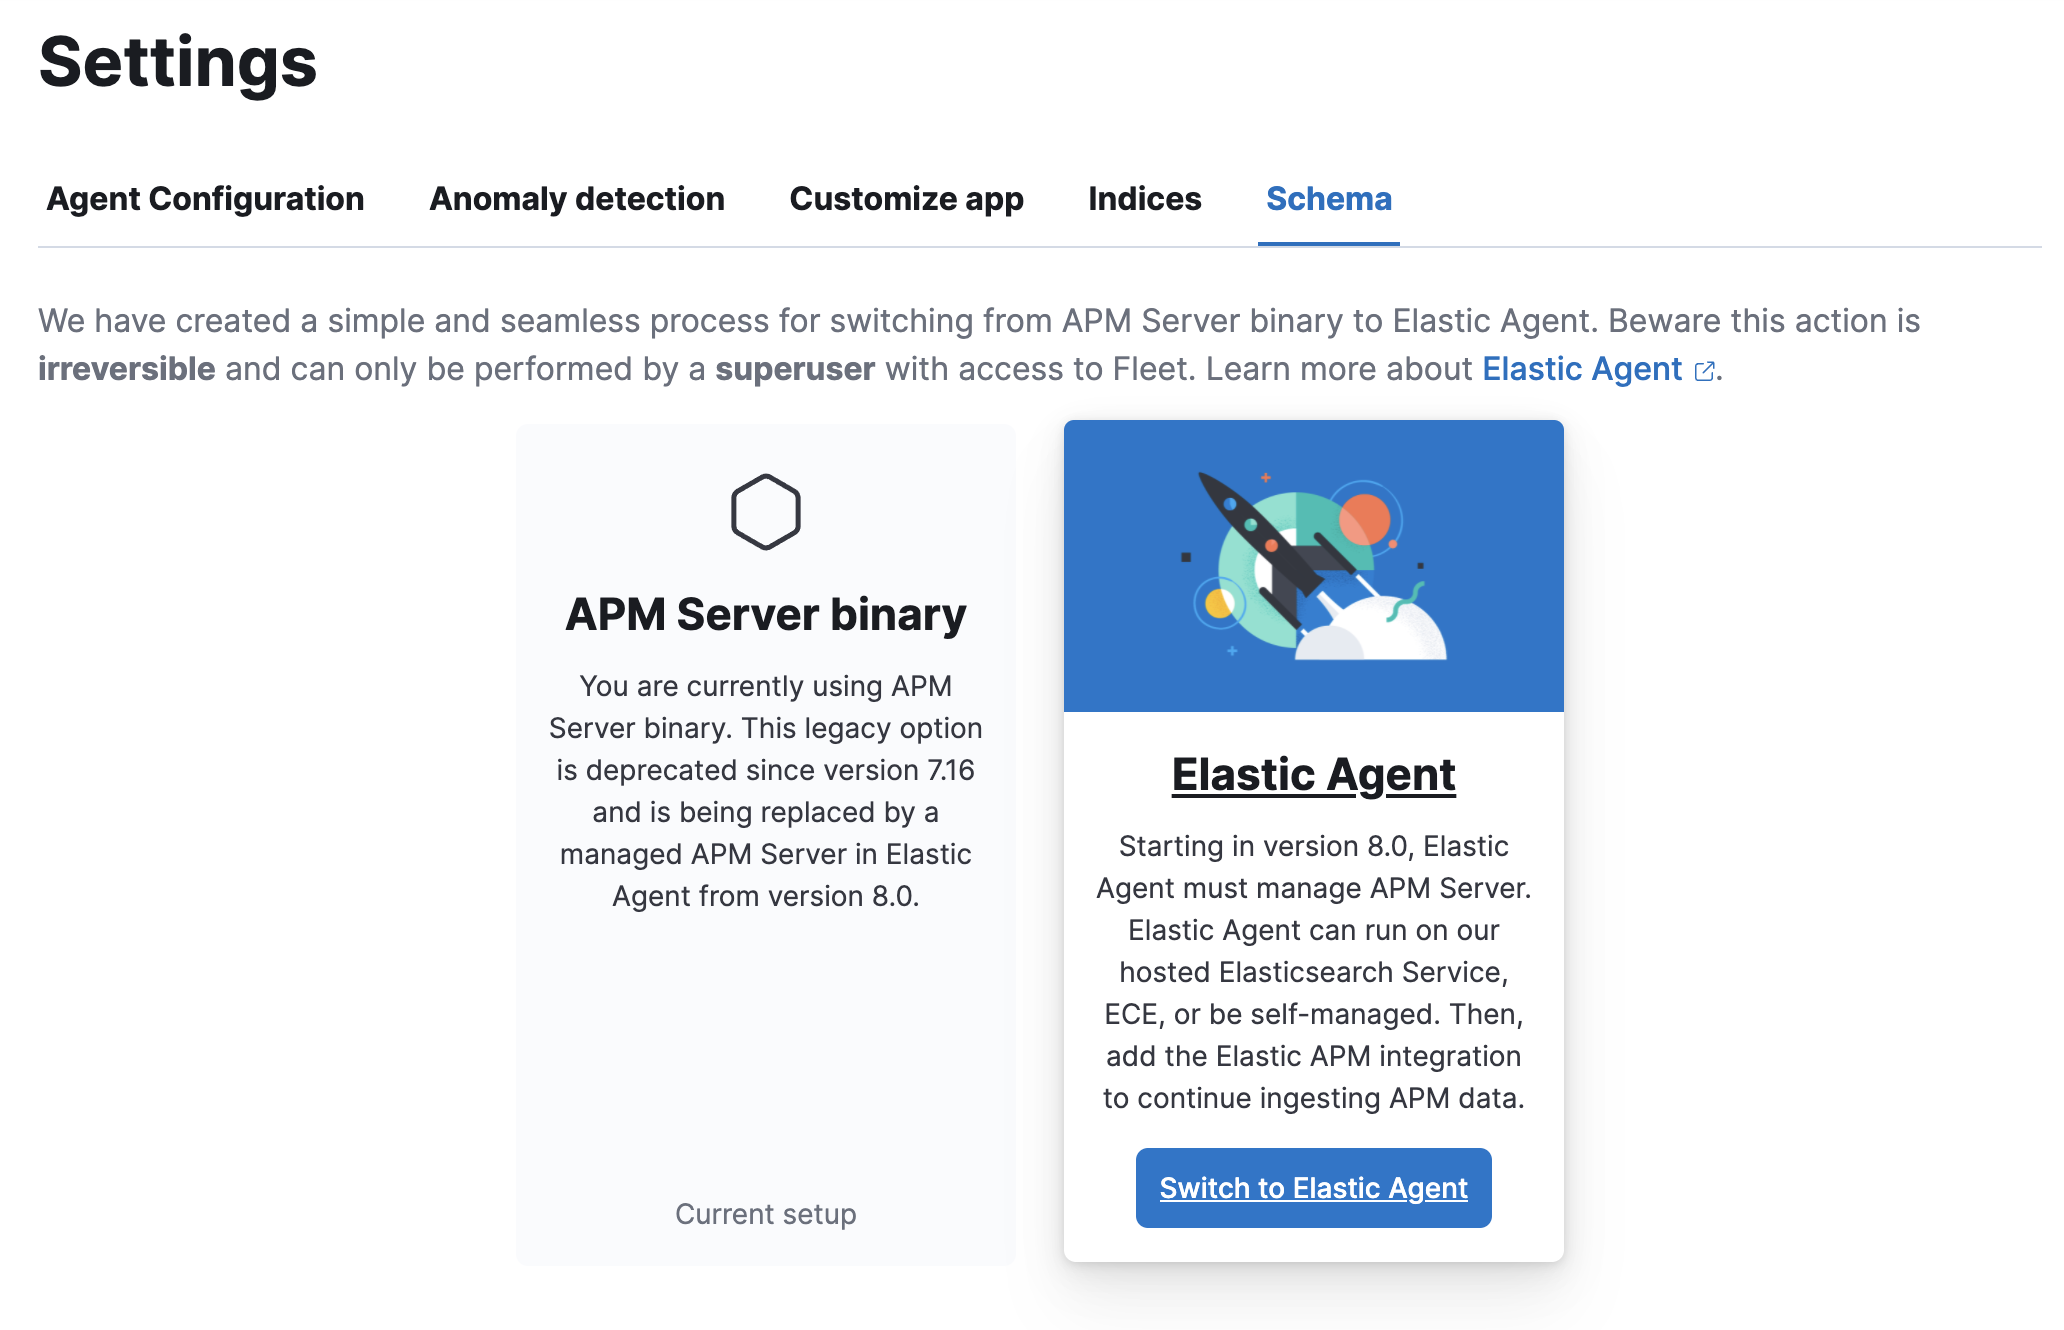
Click Switch to Elastic Agent.
-
Confirm that you wish to switch to Elastic Agent. Some
apm-server.ymlare incompatible with Elastic Agent and will be removed when Elastic Agent is enabled. Click Switch to Elastic Agent.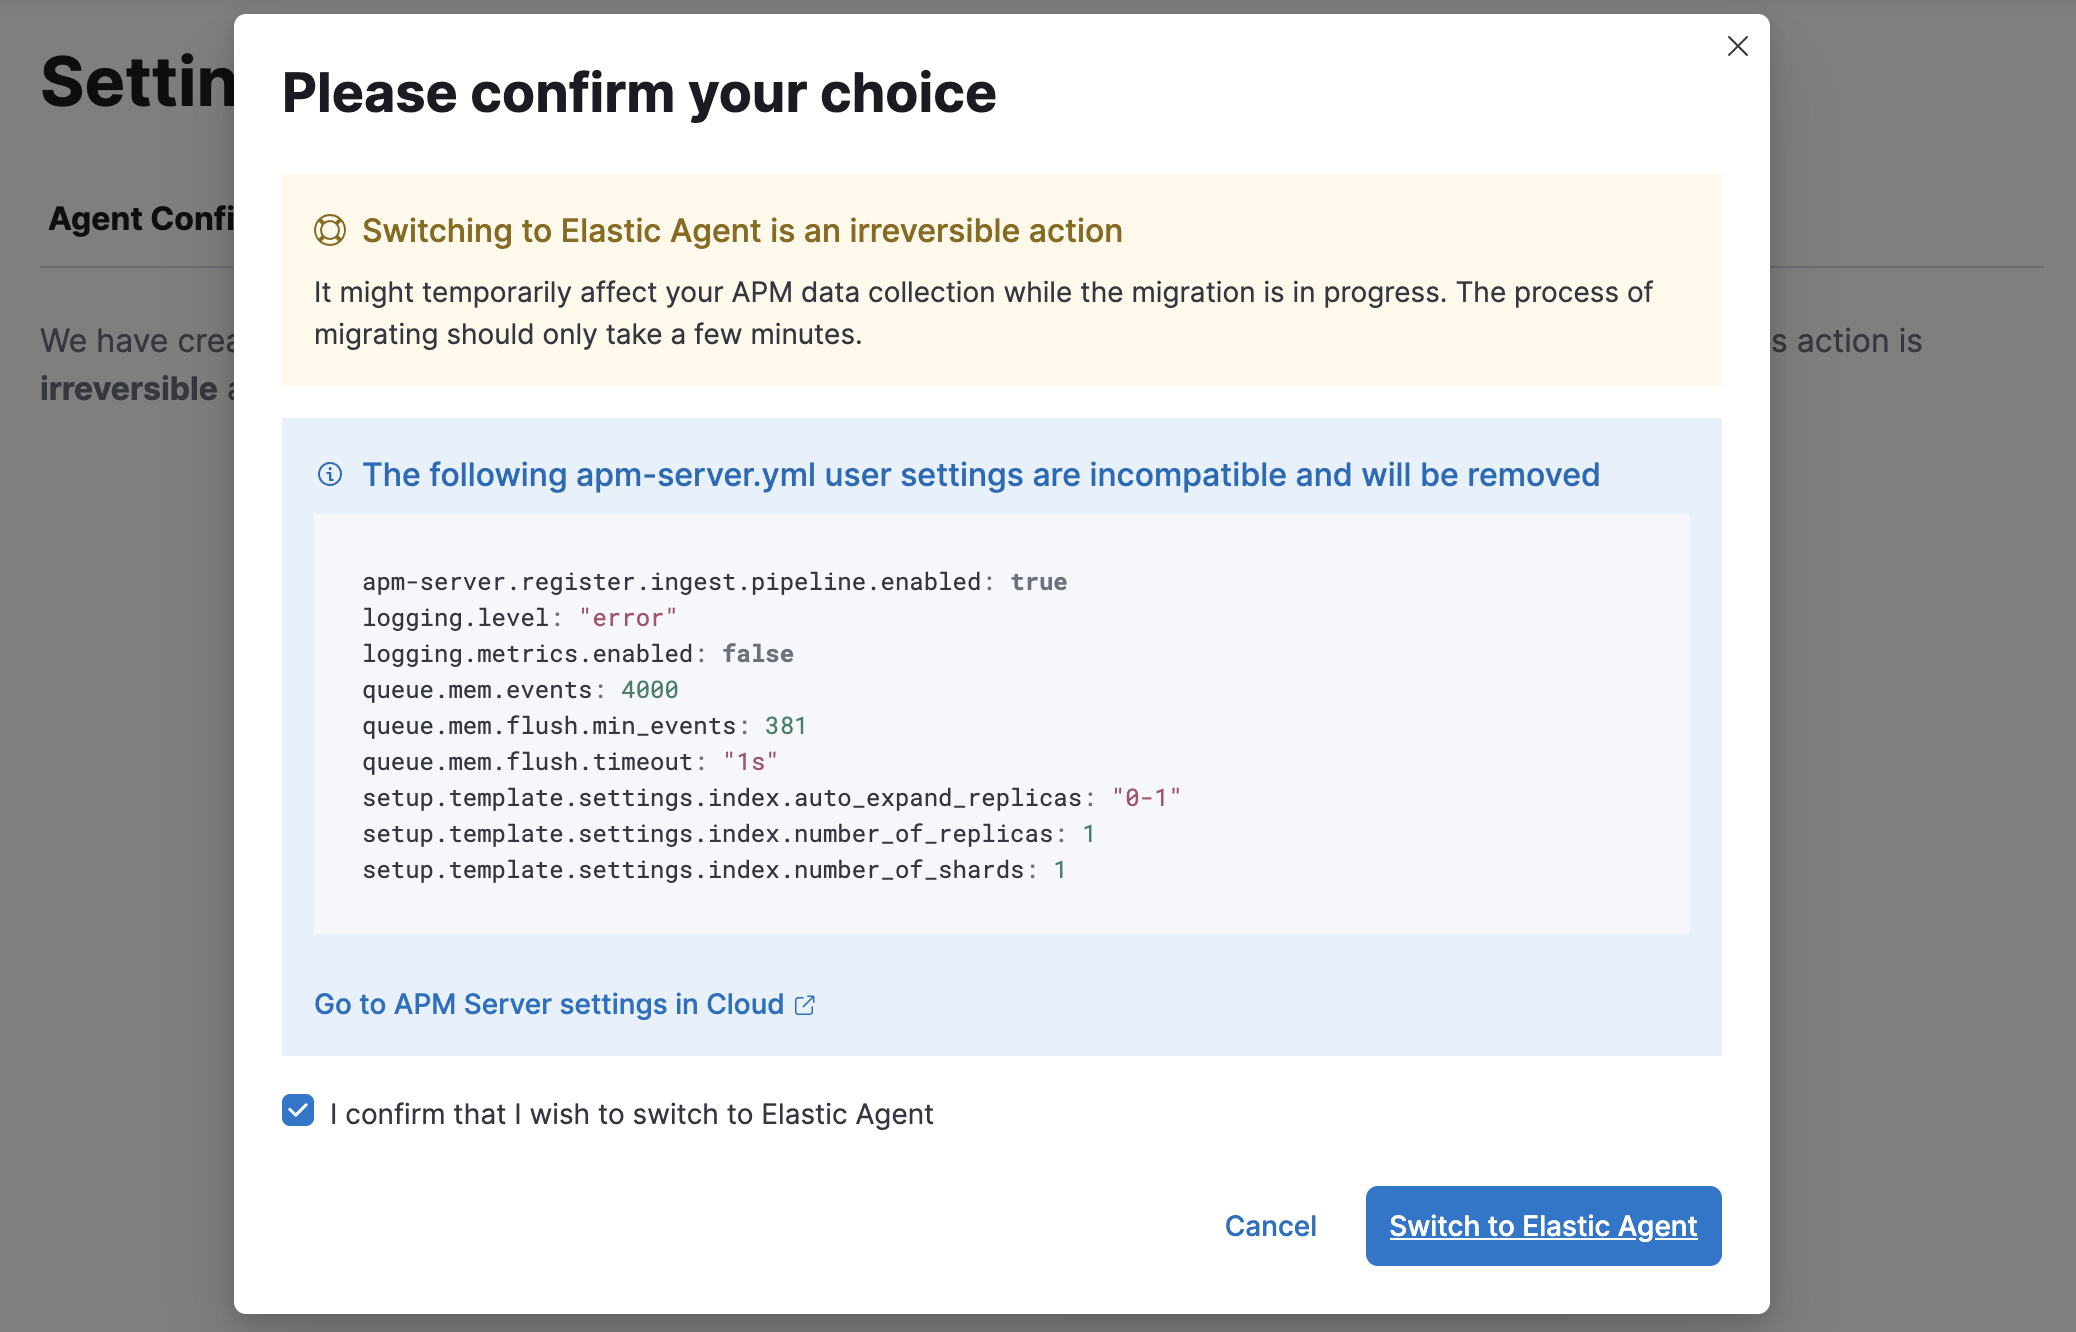
- When the APM integration finishes setting up, click View the APM integration in Fleet.
-
As you can see, the APM integration has been added to the Elastic Cloud Agent policy. This is the default policy for Elastic Agents hosted on Elastic Cloud. Select Actions > Edit integration to configure the APM integration.
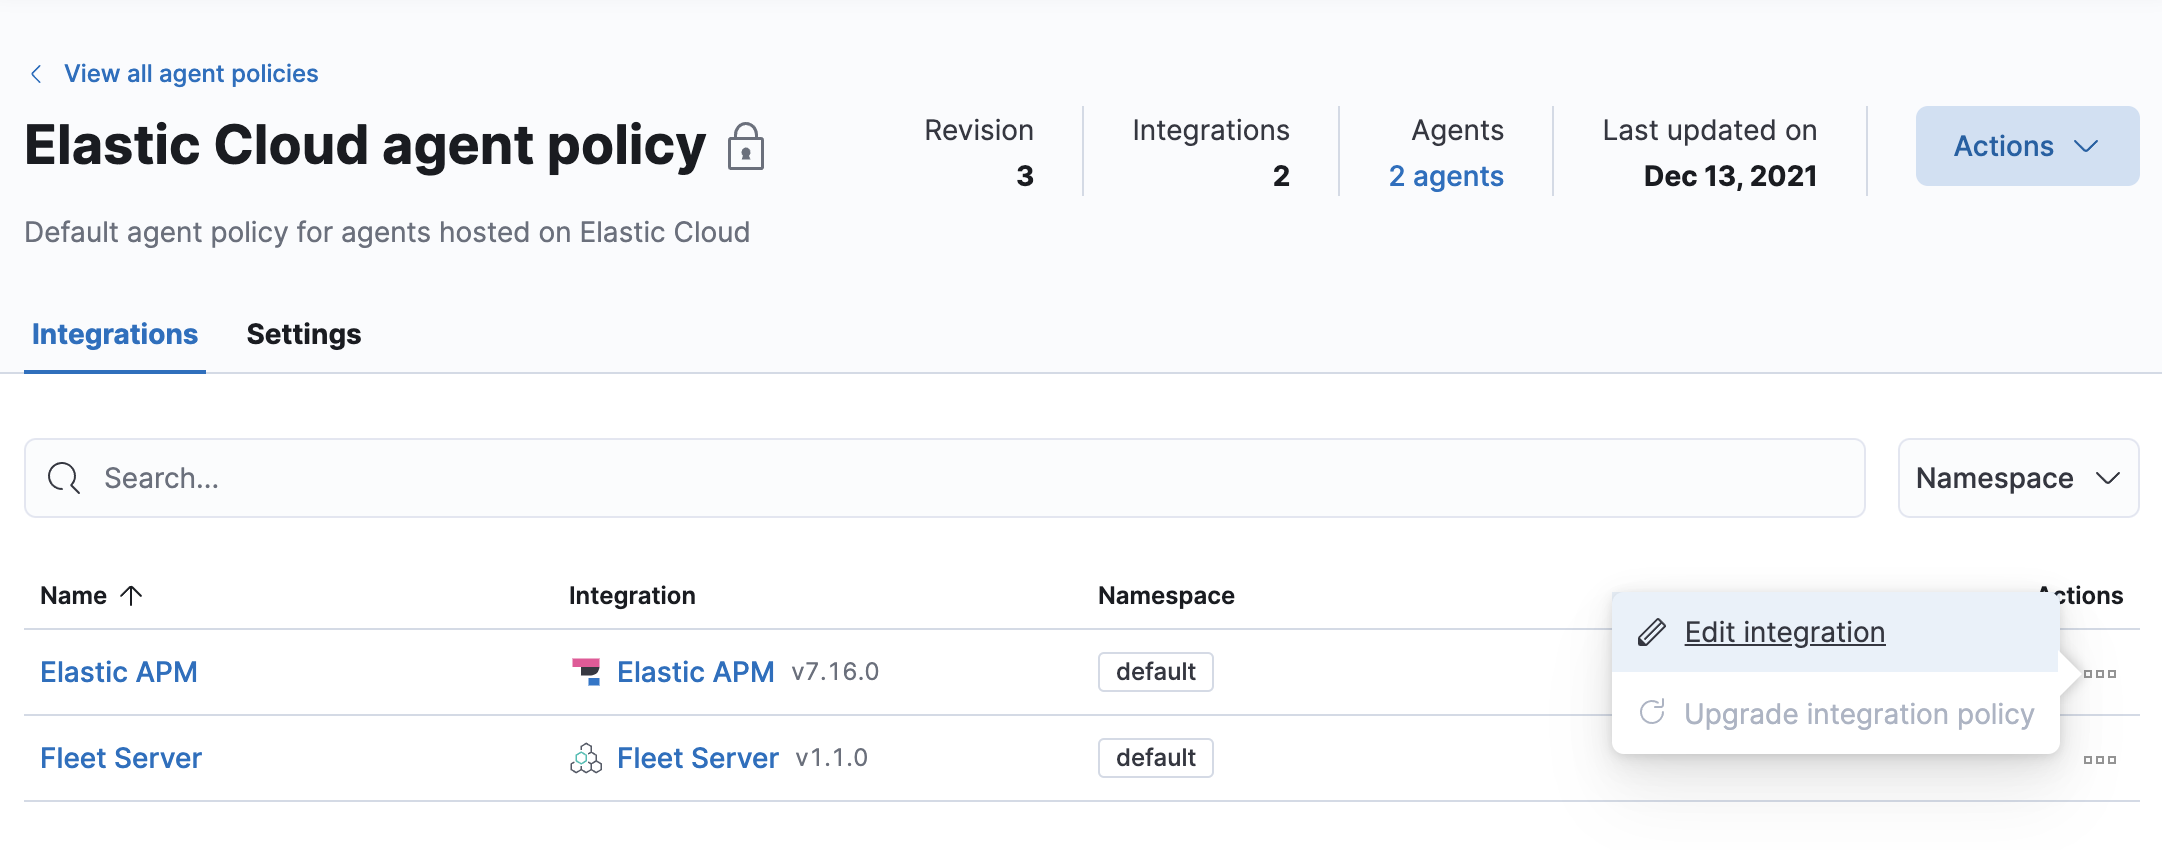
- Make a note of the predefined Host and URL that the APM Server is listening on—you’ll need these in the next step. If you made any changes to your configuration, click save and continue.
-
In Kibana, select Add integrations > Elastic APM.
-
Click Add Elastic APM.
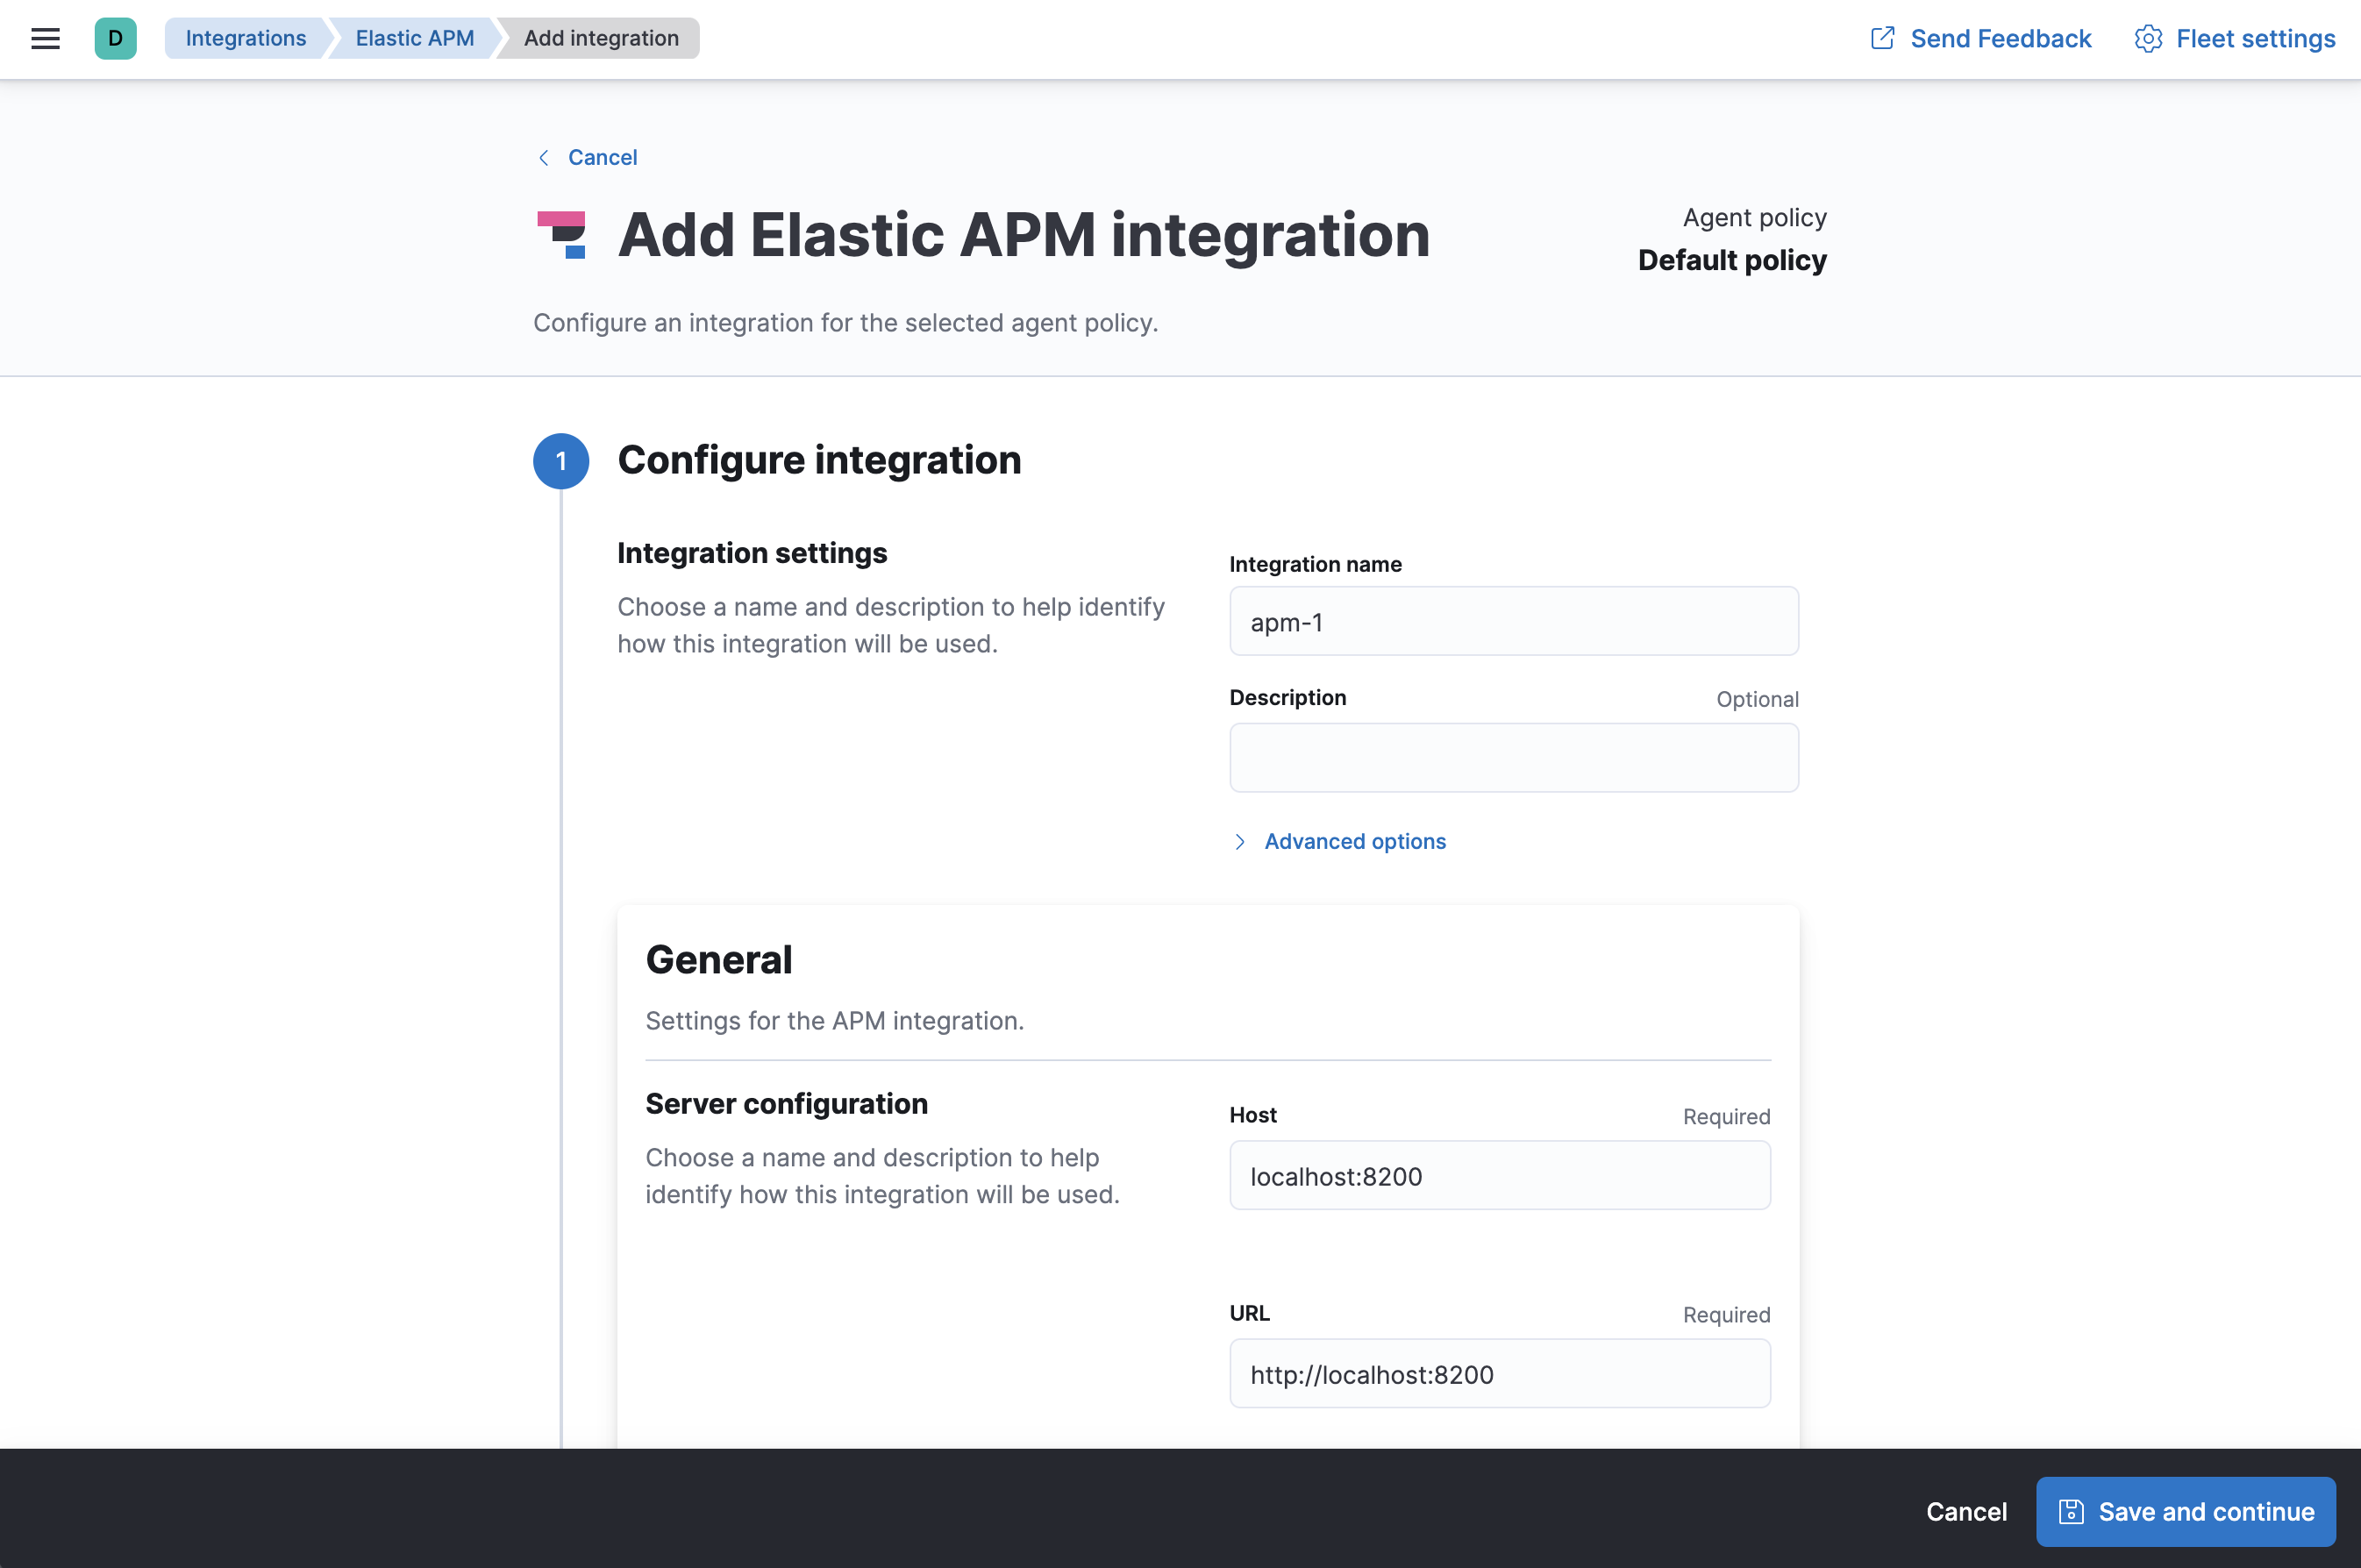
- On the Add Elastic APM integration page, define the host and port where APM Server will listen.
-
Under Apply to agent policy, select the default policy. Click Save and continue.
In this guide, you add integrations to the default policy created by Kibana. After you learn the basics, you can create your own policies and assign them to agents.
-
To see the updated policy, click the Default policy link.
The newly added APM integration should appear under Fleet > Agent policies > Default policy, along with the default System integration.
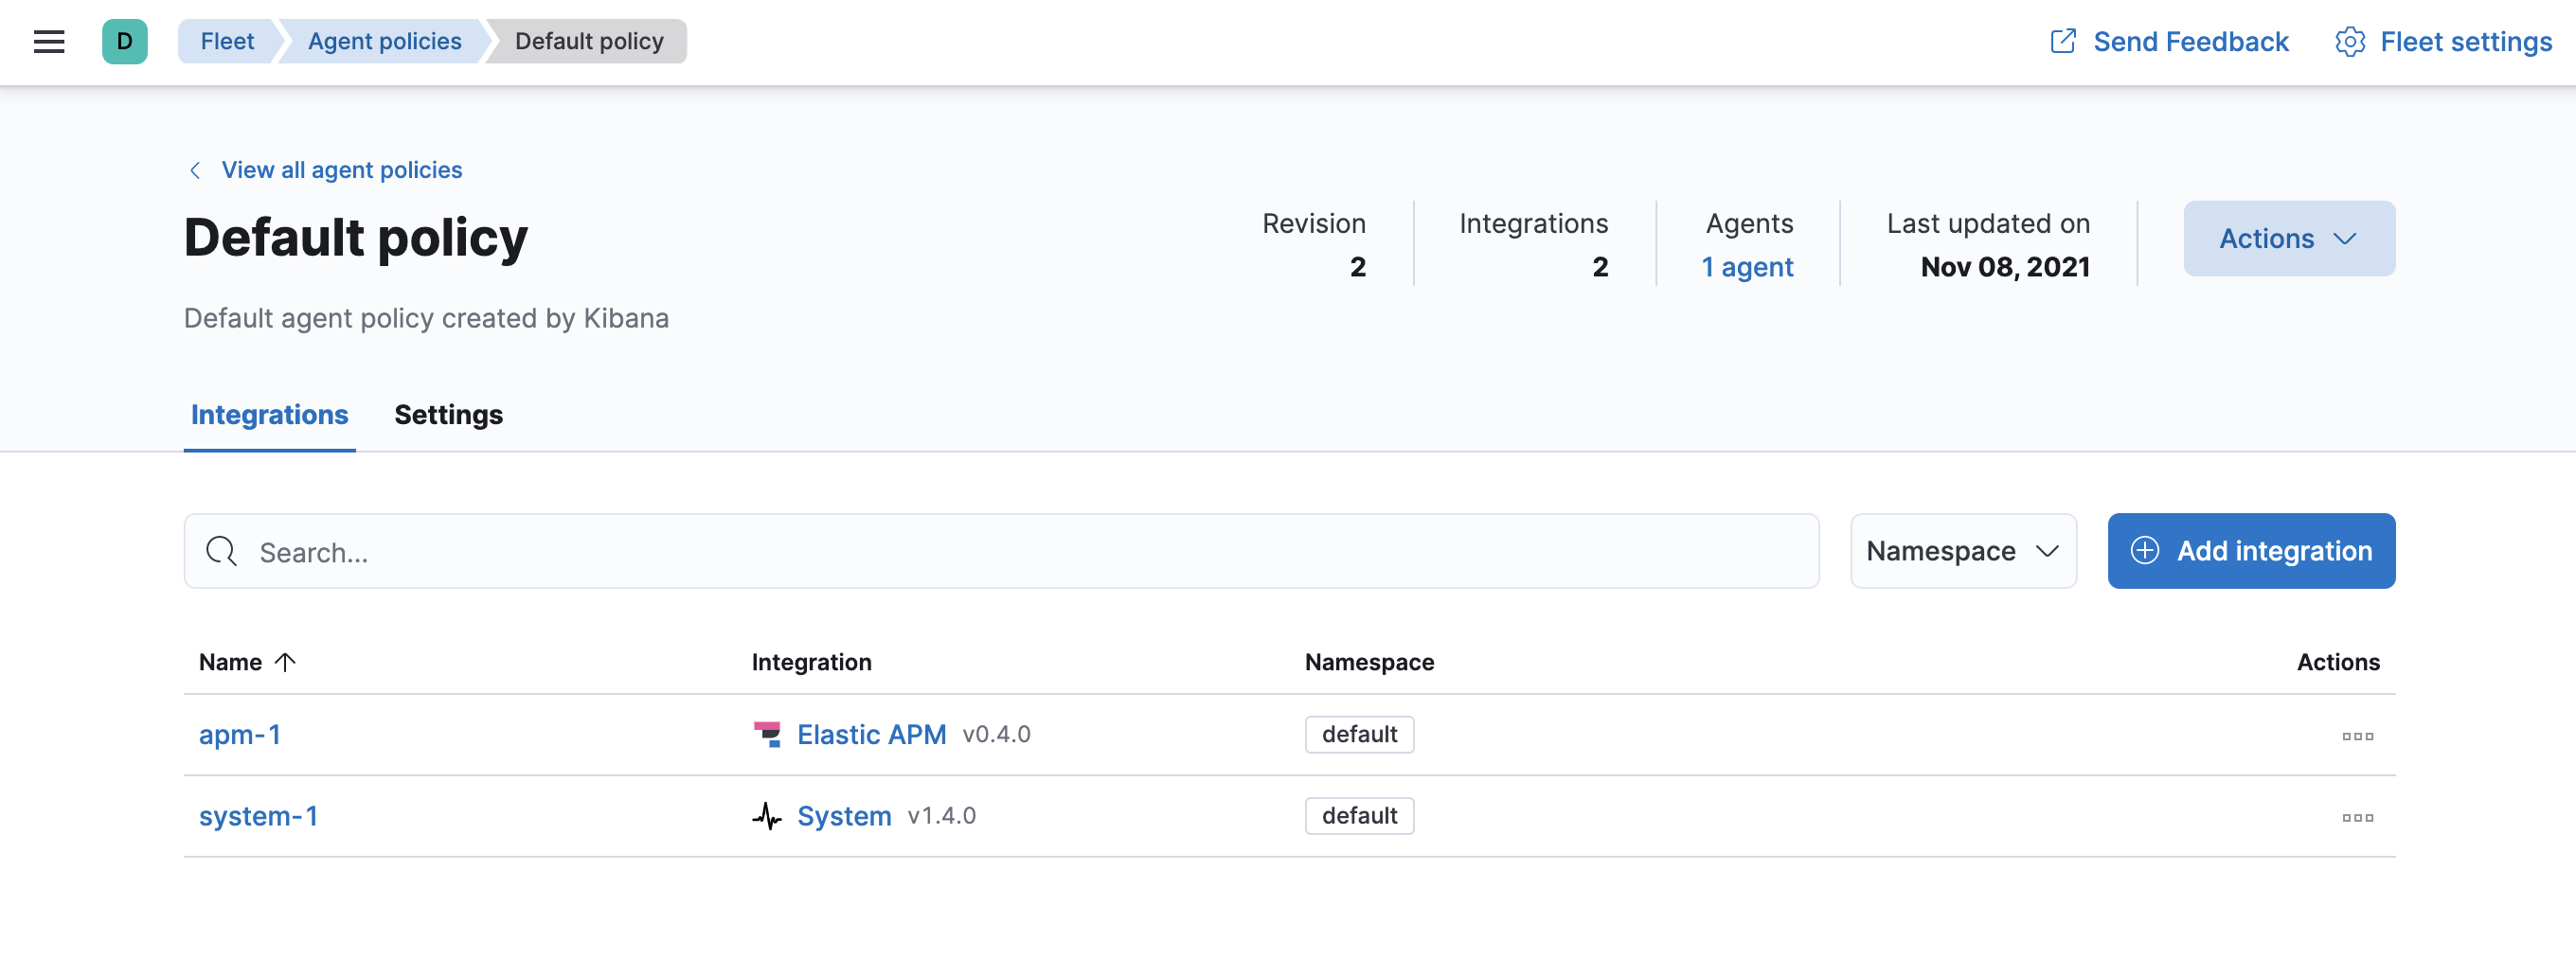
All Elastic Agents that use this policy will collect APM data from your instrumented services.
Step 4: Install APM agents
editAPM agents are written in the same language as your service. To monitor a new service, you must install the agent and configure it with a service name, APM Server host, and Secret token.
-
Service name: The APM integration maps an instrumented service’s name–defined in each APM agent’s configuration–
to the index that its data is stored in Elasticsearch.
Service names are case-insensitive and must be unique.
For example, you cannot have a service named
Fooand another namedfoo. Special characters will be removed from service names and replaced with underscores (_). - APM Server URL: The host and port that APM Server listens for events on. This should match the host and port defined when setting up the APM integration.
- Secret token: Authentication method for APM agent and APM Server communication. This should match the secret token defined when setting up the APM integration.
You can edit your APM integration settings if you need to change the APM Server URL or secret token to match your APM agents.
Install the agent
Install the APM agent packages for Go.
go get go.elastic.co/apm
Configure the agent
Agents are libraries that run inside of your application process.
APM services are created programmatically based on the executable file name, or the ELASTIC_APM_SERVICE_NAME environment variable.
# Initialize using environment variables:

# Set the service name. Allowed characters: a-z, A-Z, 0-9, -, _, and space.
# If ELASTIC_APM_SERVICE_NAME is not specified, the executable name will be used.
export ELASTIC_APM_SERVICE_NAME=

# Set custom APM Server URL. Default: http://localhost:8200.
export ELASTIC_APM_SERVER_URL=

# Use if APM Server requires a token
export ELASTIC_APM_SECRET_TOKEN=
Instrument your application
Instrument your Go application by using one of the provided instrumentation modules or by using the tracer API directly.
import (
	"net/http"

	"go.elastic.co/apm/module/apmhttp"
)

func main() {
	mux := http.NewServeMux()
	...
	http.ListenAndServe(":8080", apmhttp.Wrap(mux))
}
Learn more in the agent reference
This functionality is in technical preview and may be changed or removed in a future release. Elastic will work to fix any issues, but features in technical preview are not subject to the support SLA of official GA features.
Add the agent dependency to your project
Add the Elastic APM iOS Agent as a
package dependency
to your Xcode project or your Package.swift:
Package(
    dependencies:[
        .package(name: "iOSAgent", url: "git@github.com:elastic/apm-agent-ios.git", .branch("main")),
    ],
  targets:[
    .target(
        name: "MyApp",
        dependencies: [
            .product(name: "iOSAgent", package: "iOSAgent")
        ]
    ),
])
Initialize the agent
If you’re using SwiftUI to build your app, add the following to App.swift:
import SwiftUI
import iOSAgent

@main
struct MyApp: App {
    init() {
        var config = AgentConfiguration()
        config.collectorAddress = "127.0.0.1"
        config.collectorPort = 8200
        config.collectorTLS = false
        config.secretToken = "<secret token>"
        Agent.start(with: config)
    }
    var body: some Scene {
        WindowGroup {
            ContentView()
        }
    }
}
|
APM Server URL or IP address |
|
|
APM Server port number |
|
|
Enable TLS for Open telemetry exporters |
|
|
Set secret token for APM server connection |
If you’re not using SwiftUI, you can add the same thing to your AppDelegate file:
AppDelegate.swift
import UIKit
import iOSAgent
@main
class AppDelegate: UIResponder, UIApplicationDelegate {
    func application(_ application: UIApplication, didFinishLaunchingWithOptions launchOptions: [UIApplication.LaunchOptionsKey: Any]?) -> Bool {
        var config = AgentConfiguration()
        config.collectorAddress = "127.0.0.1"
        config.collectorPort = 8200
        config.collectorTLS = false
        config.secretToken = "<secret token>"
        Agent.start(with: config)
        return true
    }
}
Download the APM agent
Download the agent jar from Maven Central. Do not add the agent as a dependency to your application.
Start your application with the javaagent flag
Add the -javaagent flag and configure the agent with system properties.
- Set required service name
- Set custom APM Server URL (default: http://localhost:8200)
- Set the base package of your application
java -javaagent:/path/to/elastic-apm-agent-<version>.jar \
     -Delastic.apm.service_name=my-application \
     -Delastic.apm.server_urls=http://localhost:8200 \
     -Delastic.apm.secret_token= \
     -Delastic.apm.application_packages=org.example \
     -jar my-application.jar
Learn more in the agent reference
Download the APM agent
Add the agent packages from NuGet to your .NET application. There are multiple NuGet packages available for different use cases.
For an ASP.NET Core application with Entity Framework Core, download the Elastic.Apm.NetCoreAll package. This package will automatically add every agent component to your application.
To minimize the number of dependencies, you can use the Elastic.Apm.AspNetCore package for just ASP.NET Core monitoring, or the Elastic.Apm.EfCore package for just Entity Framework Core monitoring.
If you only want to use the public agent API for manual instrumentation, use the Elastic.Apm package.
Add the agent to the application
For an ASP.NET Core application with the Elastic.Apm.NetCoreAll package,
call the UseAllElasticApm method in the Configure method within the Startup.cs file:
public class Startup
{
  public void Configure(IApplicationBuilder app, IHostingEnvironment env)
  {
    app.UseAllElasticApm(Configuration);
    //…rest of the method
  }
  //…rest of the class
}
Passing an IConfiguration instance is optional and by doing so,
the agent will read config settings through this IConfiguration instance, for example,
from the appsettings.json file:
{
    "ElasticApm": {
    "SecretToken": "",
    "ServerUrls": "http://localhost:8200", //Set custom APM Server URL (default: http://localhost:8200)
    "ServiceName" : "MyApp", //allowed characters: a-z, A-Z, 0-9, -, _, and space. Default is the entry assembly of the application
  }
}
If you don’t pass an IConfiguration instance to the agent, for example, in a non-ASP.NET Core application,
you can configure the agent with environment variables.
See the agent reference for more information.
Learn more in the agent reference
Install the APM agent
Install the APM agent for Node.js as a dependency to your application.
npm install elastic-apm-node --save
Configure the agent
Agents are libraries that run inside of your application process. APM services are created programmatically based on the serviceName.
This agent supports a variety of frameworks but can also be used with your custom stack.
// Add this to the VERY top of the first file loaded in your app
var apm = require('elastic-apm-node').start({
  // Override service name from package.json
  // Allowed characters: a-z, A-Z, 0-9, -, _, and space
  serviceName: '',

  // Use if APM Server requires a token
  secretToken: '',

  // Set custom APM Server URL (default: http://localhost:8200)
  serverUrl: ''
})
Learn more in the agent reference
Install the agent
Install the PHP agent using one of the published packages.
To use the RPM Package (RHEL/CentOS and Fedora):
rpm -ivh <package-file>.rpm
To use the DEB package (Debian and Ubuntu):
dpkg -i <package-file>.deb
To use the APK package (Alpine):
apk add --allow-untrusted <package-file>.apk
If you can’t find your distribution, you can install the agent by building it from the source.
Configure the agent
Configure your agent inside of the php.ini file:
elastic_apm.server_url=http://localhost:8200
elastic_apm.secret_token=SECRET_TOKEN
elastic_apm.service_name="My-service"
Learn more in the agent reference
- Django
-
Install the APM agent
Install the APM agent for Python as a dependency.
$ pip install elastic-apm
Configure the agent
Agents are libraries that run inside of your application process. APM services are created programmatically based on the
SERVICE_NAME.# Add the agent to the installed apps INSTALLED_APPS = ( 'elasticapm.contrib.django', # ... ) ELASTIC_APM = { # Set required service name. Allowed characters: # a-z, A-Z, 0-9, -, _, and space 'SERVICE_NAME': '', # Use if APM Server requires a token 'SECRET_TOKEN': '', # Set custom APM Server URL (default: http://localhost:8200) 'SERVER_URL': '', } # To send performance metrics, add our tracing middleware: MIDDLEWARE = ( 'elasticapm.contrib.django.middleware.TracingMiddleware', #... ) - Flask
-
Install the APM agent
Install the APM agent for Python as a dependency.
$ pip install elastic-apm[flask]
Configure the agent
Agents are libraries that run inside of your application process. APM services are created programmatically based on the
SERVICE_NAME.# initialize using environment variables from elasticapm.contrib.flask import ElasticAPM app = Flask(__name__) apm = ElasticAPM(app) # or configure to use ELASTIC_APM in your application settings from elasticapm.contrib.flask import ElasticAPM app.config['ELASTIC_APM'] = { # Set required service name. Allowed characters: # a-z, A-Z, 0-9, -, _, and space 'SERVICE_NAME': '', # Use if APM Server requires a token 'SECRET_TOKEN': '', # Set custom APM Server URL (default: http://localhost:8200) 'SERVER_URL': '', } apm = ElasticAPM(app)
Learn more in the agent reference
Install the APM agent
Add the agent to your Gemfile.
gem 'elastic-apm'
Configure the agent
- Ruby on Rails
-
APM is automatically started when your app boots. Configure the agent by creating the config file
config/elastic_apm.yml:# config/elastic_apm.yml: # Set service name - allowed characters: a-z, A-Z, 0-9, -, _ and space # Defaults to the name of your Rails app service_name: 'my-service' # Use if APM Server requires a token secret_token: '' # Set custom APM Server URL (default: http://localhost:8200) server_url: 'http://localhost:8200'
- Rack
-
For Rack or a compatible framework, like Sinatra, include the middleware in your app and start the agent.
# config.ru
  require 'sinatra/base'

  class MySinatraApp < Sinatra::Base
    use ElasticAPM::Middleware

    # ...
  end

  ElasticAPM.start(
    app: MySinatraApp, # required
    config_file: '' # optional, defaults to config/elastic_apm.yml
  )

  run MySinatraApp

  at_exit { ElasticAPM.stop }
Create a config file
Create a config file config/elastic_apm.yml:
# config/elastic_apm.yml:

# Set service name - allowed characters: a-z, A-Z, 0-9, -, _ and space
# Defaults to the name of your Rack app's class.
service_name: 'my-service'

# Use if APM Server requires a token
secret_token: ''

# Set custom APM Server URL (default: http://localhost:8200)
server_url: 'http://localhost:8200'
Learn more in the agent reference
Enable Real User Monitoring support in APM Server
APM Server disables RUM support by default.
To enable it, set apm-server.rum.enabled: true in your APM Server configuration file.
Set up the agent
Once RUM support enabled, you can set up the RUM agent.
There are two ways to do this: add the agent as a dependency,
or set it up with <script> tags.
Set up the agent as a dependency
You can install the agent as a dependency to your application with npm install @elastic/apm-rum --save.
The agent can then be initialized and configured in your application like this:
import { init as initApm } from '@elastic/apm-rum'
var apm = initApm({

  // Set required service name (allowed characters: a-z, A-Z, 0-9, -, _, and space)
  serviceName: 'your-app-name',

  // Set custom APM Server URL (default: http://localhost:8200)
  serverUrl: '',

  // Set service version (required for source map feature)
  serviceVersion: ''
})
Framework integrations, like React or Angular, have custom dependencies. See framework integrations for more information.
Set up the agent with <script> tags
Alternatively, you can use <script> tags to set up and configure the agent.
Add a <script> tag to the HTML page and use the elasticApm global object to load and initialize the agent.
Don’t forget to download the latest version of the RUM agent from
GitHub or
UNPKG,
and host the file on your Server/CDN before deploying to production.
<script src="https://your-cdn-host.com/path/to/elastic-apm-rum.umd.min.js" crossorigin></script>
<script>
  elasticApm.init({
    serviceName: 'your-app-name',
    serverUrl: 'http://localhost:8200',
  })
</script>
Learn more in the agent reference
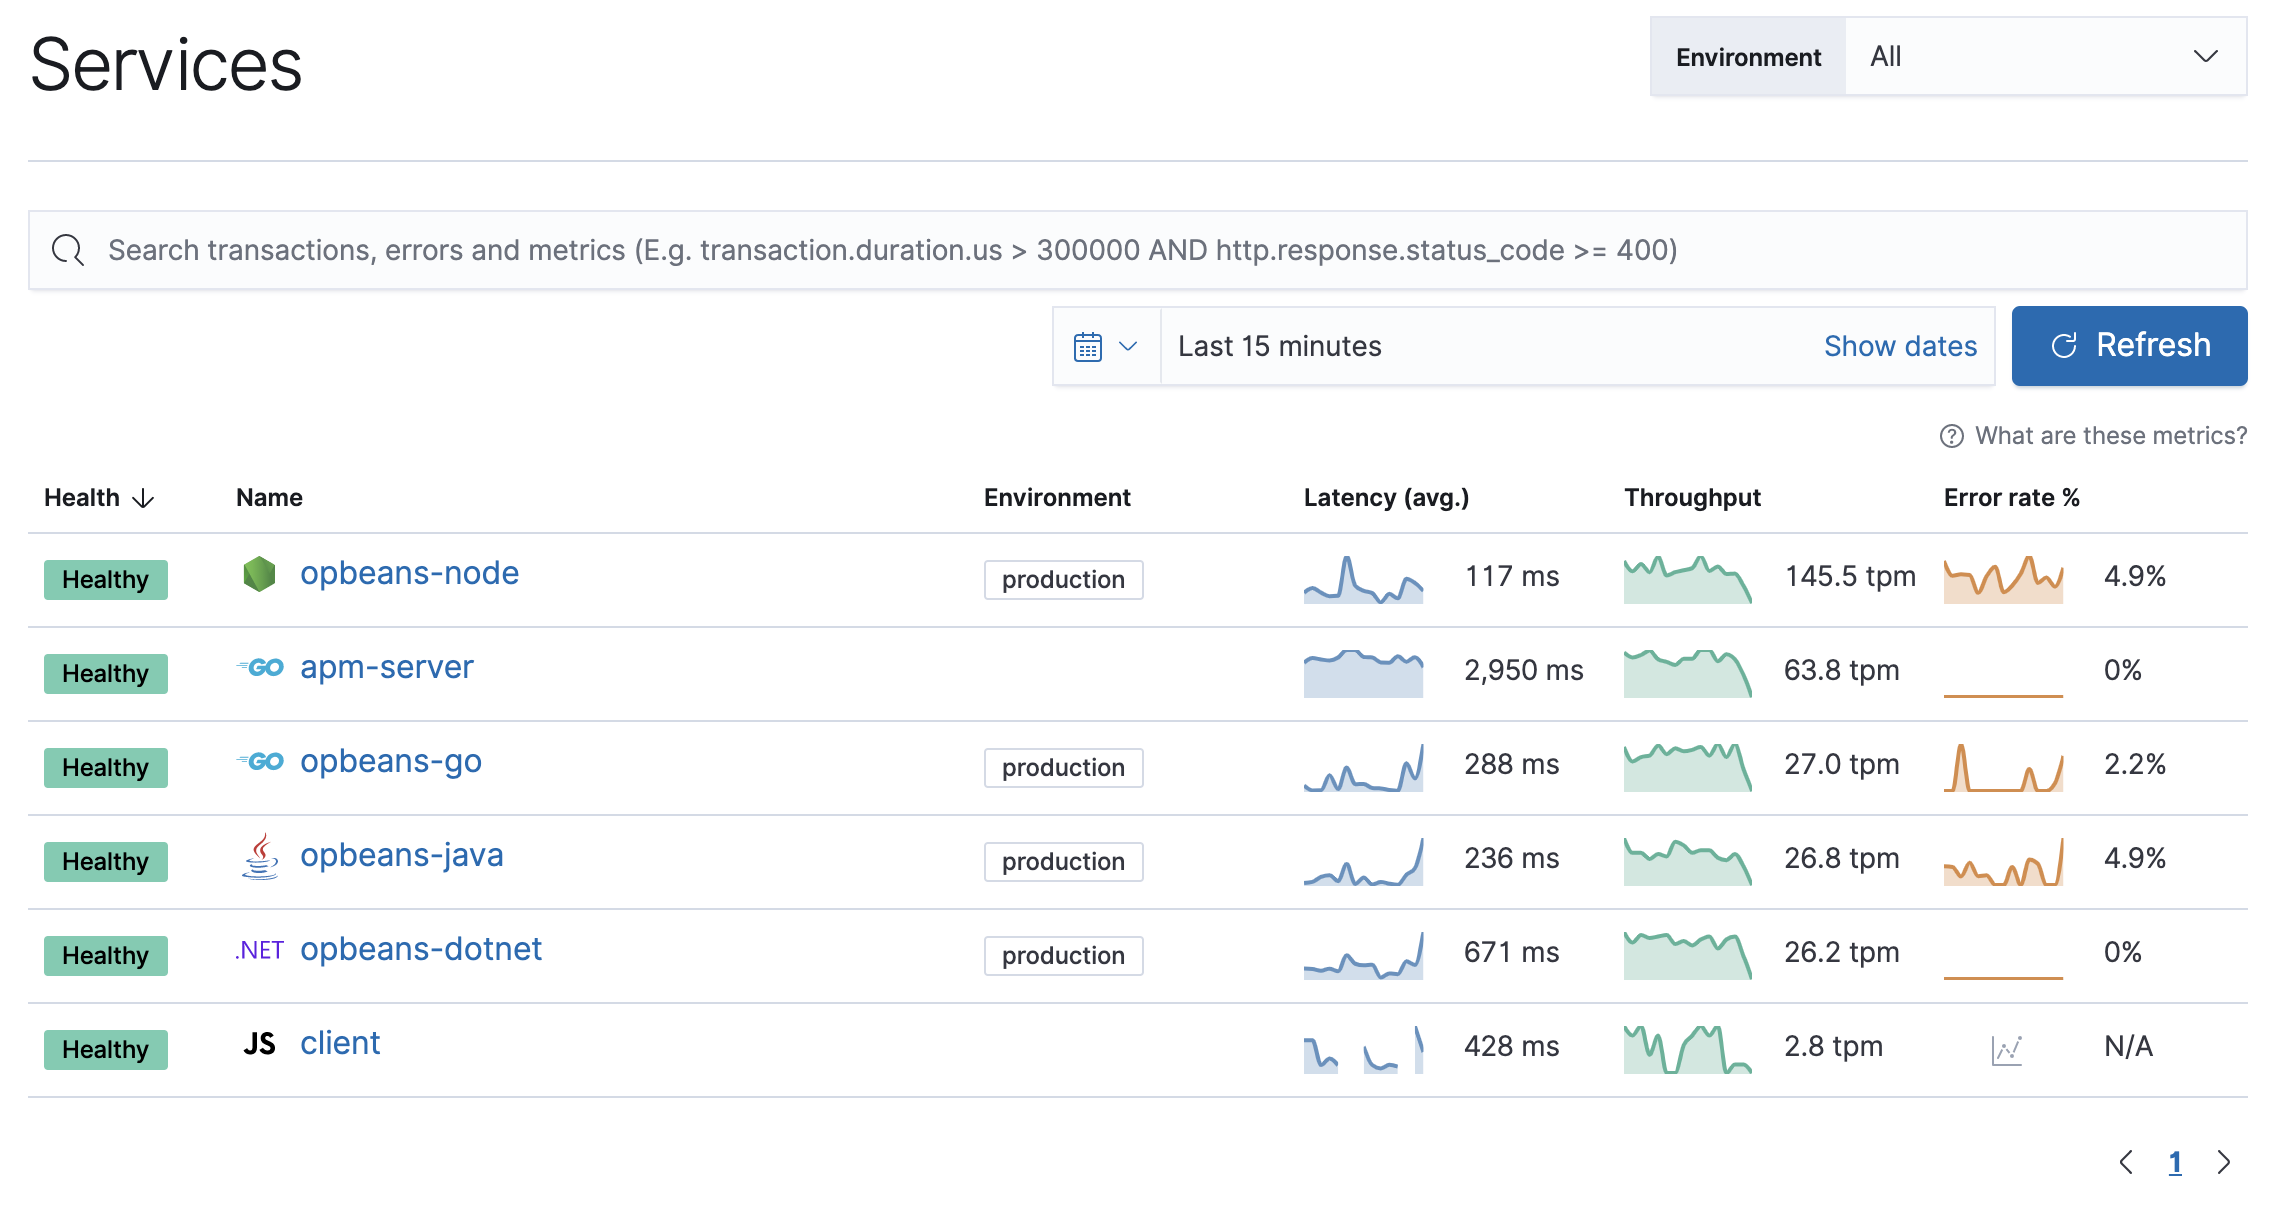
Step 5: View your data
editBack in Kibana, under Observability, select APM. You should see application performance monitoring data flowing into the Elastic Stack!
The built-in apm_user role is not compatible with the APM integration
as it only provides read access to apm-* indices.
For a list of indices users need access to, refer to
APM data streams
What’s next?
edit- Now that data is streaming into the Elastic Stack, take your investigation to a deeper level! Use Elastic Observability to unify your logs, metrics, uptime, and application performance data.
- Want to protect your endpoints from security threats? Try Elastic Security. Adding endpoint protection is just another integration that you add to the agent policy!
- Are your eyes bleary from staring at a wall of screens? Create alerts and find out about problems while sipping your favorite beverage poolside.
- Want Elastic to do the heavy lifting? Use machine learning to detect anomalies.
- Got everything working like you want it? Roll out your agent policies to other hosts by deploying Elastic Agents across your infrastructure!