Components and documentation
editComponents and documentationedit
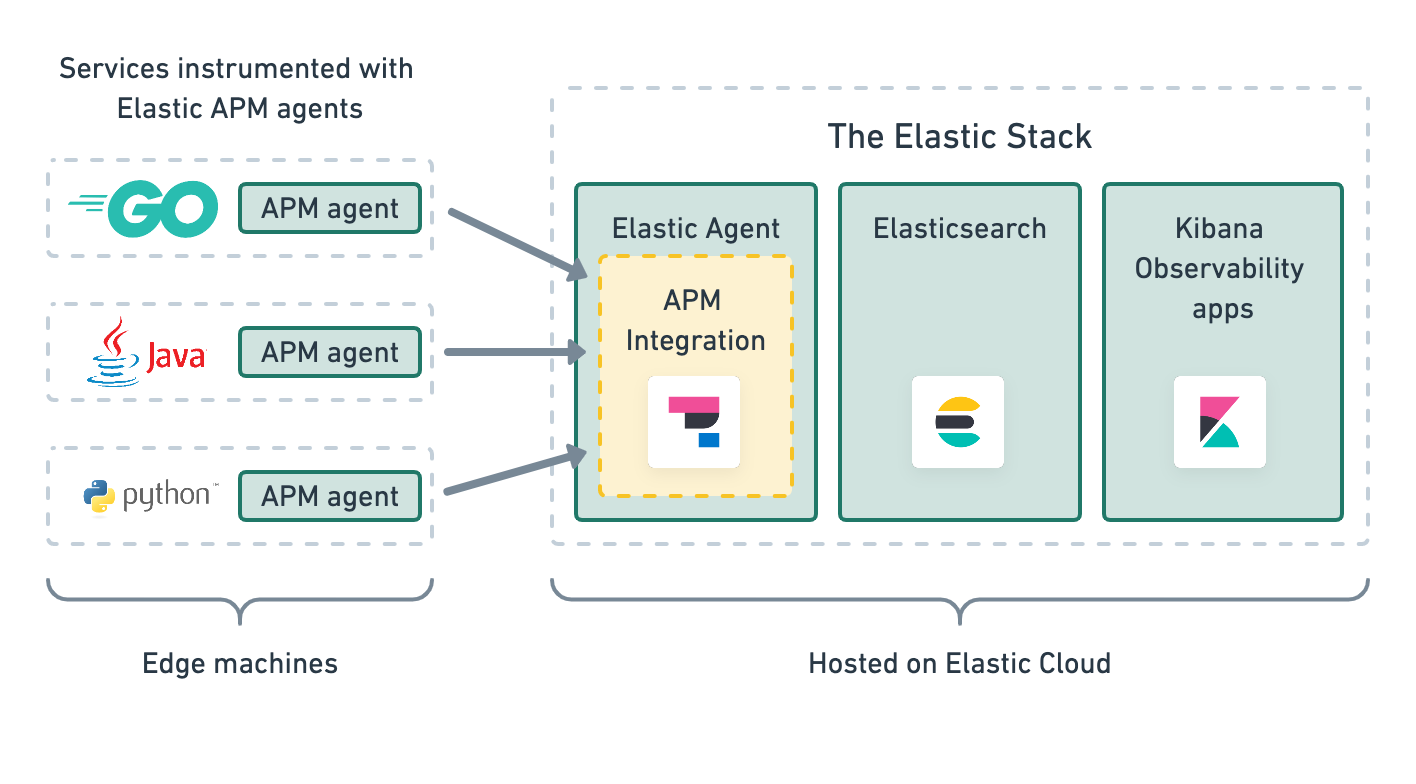
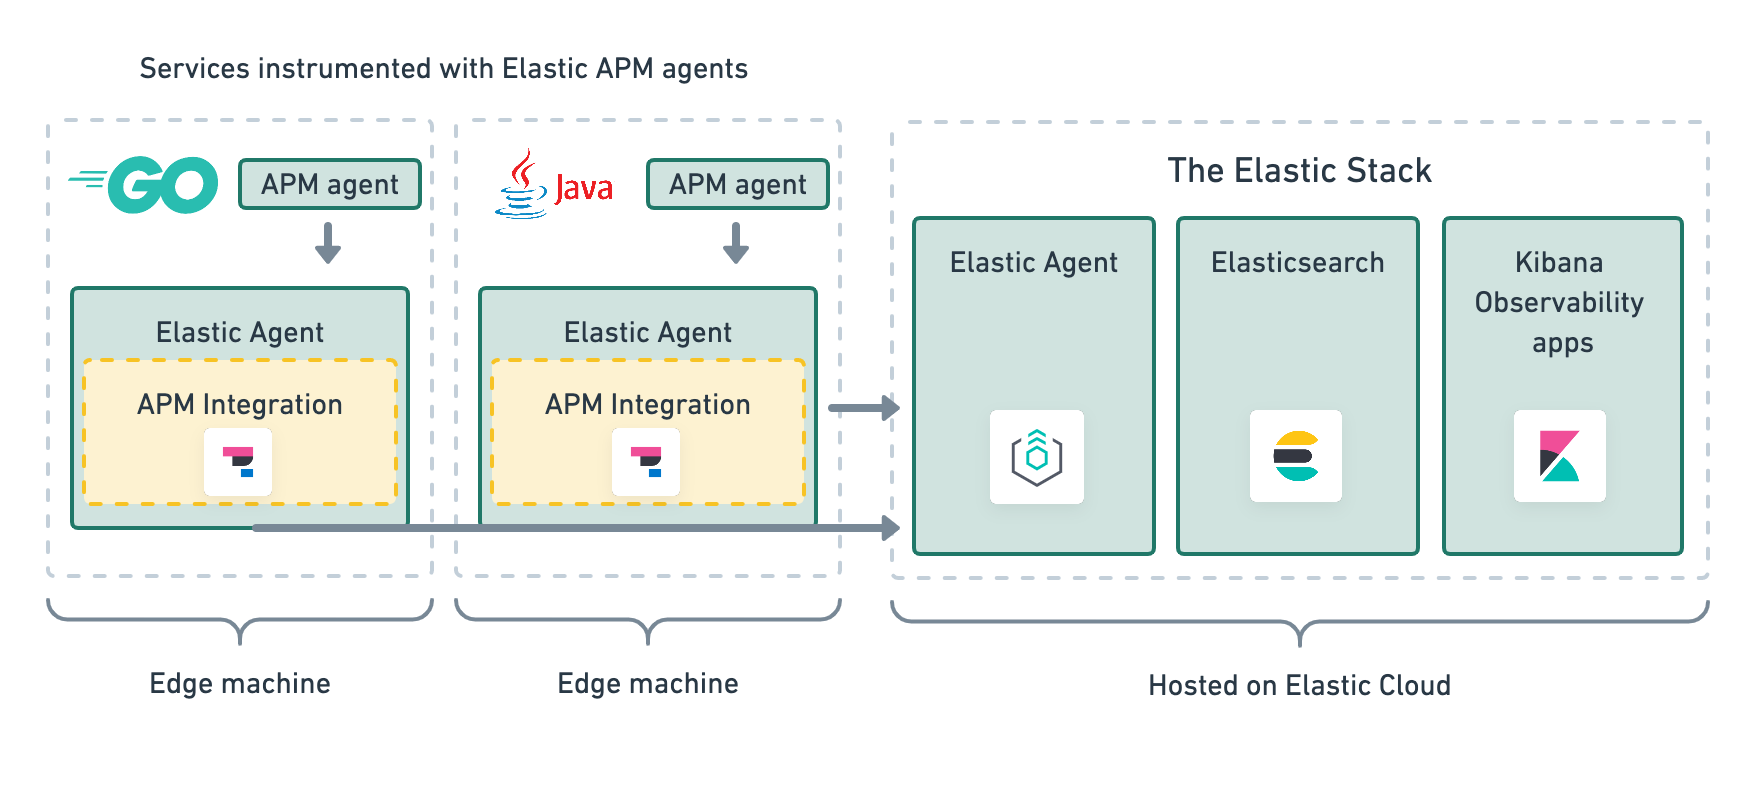
Elastic APM consists of four components: APM agents, the Elastic APM integration, Elasticsearch, and Kibana. Generally, there are two ways that these four components can work together:
Apm agents on edge machines send data to a centrally hosted APM integration:

Or, APM agents and the APM integration live on edge machines and enroll via a centrally hosted Elastic Agent:

Read on to learn more about each of these components!
APM Agentsedit
APM agents are open source libraries written in the same language as your service. You may only need one, or you might use all of them. You install them into your service as you would install any other library. They instrument your code and collect performance data and errors at runtime. This data is buffered for a short period and sent on to APM Server.
Each agent has its own documentation:
Elastic APM integrationedit
The APM integration receives performance data from your APM agents, validates and processes it, and then transforms the data into Elasticsearch documents. Removing this logic from APM agents help keeps them light, prevents certain security risks, and improves compatibility across the Elastic Stack.
The Elastic integration runs on Elastic Agent. Elastic Agent is a single, unified way to add monitoring for logs, metrics, traces, and other types of data to each host. A single agent makes it easier and faster to deploy monitoring across your infrastructure. The agent’s single, unified policy makes it easier to add integrations for new data sources.
Elasticsearchedit
Elasticsearch is a highly scalable free and open full-text search and analytics engine. It allows you to store, search, and analyze large volumes of data quickly and in near real time. Elasticsearch is used to store APM performance metrics and make use of its aggregations.
Kibana APM appedit
Kibana is a free and open analytics and visualization platform designed to work with Elasticsearch. You use Kibana to search, view, and interact with data stored in Elasticsearch.
Since application performance monitoring is all about visualizing data and detecting bottlenecks, it’s crucial you understand how to use the APM app in Kibana. The following sections will help you get started:
APM also has built-in integrations with Machine learning. To learn more about this feature, or the anomaly detection feature that’s built on top of it, refer to Machine learning integration.