You get a report! You get a report!
Everybody gets a report!
We recently released the first version of Reporting for Kibana which gives users the ability to generate a PDF report from saved Kibana dashboards. By leveraging Watcher’s email action, you can send PDF reports regularly, or only when certain events have occurred.
In this blog post, I will demonstrate the power of Reporting and Watcher integration and how we are dogfooding this in house. For our example use case, we are sending bi-weekly PDF reports to our systems team manager if there are any helpdesk tickets filed by internal employees mentioning a specific keyword.
To get up and running quickly, I have set up an instance on Elastic Cloud because it is so easy to get Elasticsearch (with authentication via Shield) and Kibana running on the latest and greatest versions.
The following example below was created against ES 2.4.0 with Kibana 4.6.1 (when Reporting was originally released). There have been changes in Cloud and Reporting since then. I have added notes in the sections below related to the changes in our products since the original release.
Step 1: Populate the Data
First step is simply to populate Elasticsearch with the data you are reporting against.
We track helpdesk tickets internally using Salesforce’s Service Cloud. In this case, I have written a custom Logstash salesforce plugin using the restforce ruby gem to join object data related to posts, emails and chatter comments from various objects so we can get tickets with the full feed history intact.
Step 2: Install the Reporting Plugin
(Starting in 5.0+, Reporting is now installed with X-Pack on Elastic Cloud. It is no longer necessary to install the Reporting plugin separately).
Reporting is built on top of Kibana, so you will have to set up Kibana and install the Reporting plugin. If you are running on Elastic Cloud, the Reporting plugin is already installed for you when you enable Kibana :)
Step 3: Secure Your Data
Because the data for my use case can potentially be sensitive, I have enabled Shield in my Elastic Cloud instance (“configure Shield”) for authentication. From the Elastic Cloud instance, simply click on the link and then configure the users and roles accordingly.
![]()
You can create users with a reporting role for report generation purposes.
Note: When installing Kibana in your local environment and enabling security via Shield, keep in mind that Reporting on 2.4 requires the Kibana Shield plugin, and the Kibana Shield plugin in turn requires SSL to be enabled in Kibana. Starting in 5.0+, we no longer require SSL to be enabled in Kibana to use the Kibana Shield plugin (certainly, you may still want to enable SSL for production deployments). Since I am running on Elastic Cloud, SSL is already enabled by default. Yay!
Step 4: Create a Dashboard and View the Report
(For 5.0+, refer to the Reporting documentation for the latest screens and instructions).
Currently, you can only generate a PDF report against a dashboard if the dashboard is an existing/saved object in Kibana.
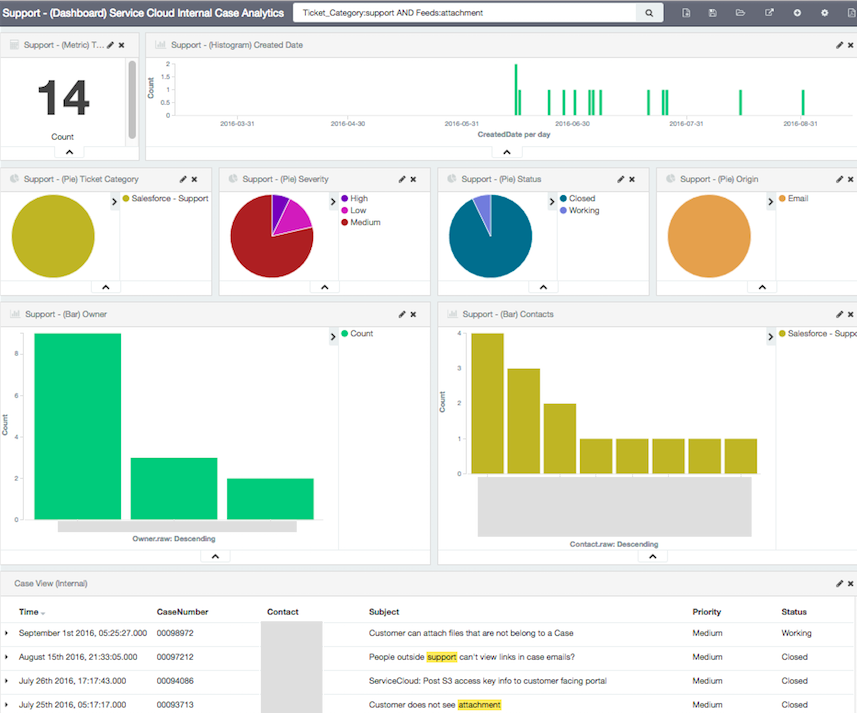
Once you have created the desired dashboard, click on the “Generate Report” icon (rightmost icon). This will give you a button to generate a Printable PDF report. Clicking on the button will issue a one-time reporting request to the reporting queue.

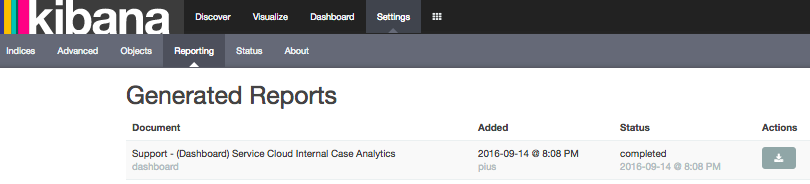
When the report is ready, you can locate the report in the list of generated reports from Settings > Reporting and download it using the corresponding action icon.
Step 5: Create a Watch to Send the Report
(On 5.0+, Watcher comes packaged with X-pack which is automatically installed on Elastic Cloud. In the above example, it uses the "http" attachment type of the email action which applies to Reporting 4.6 and 5.0. Starting in 5.1+, we now have a specialized "reporting" attachment type specifically for integration between Alerting/Watcher and Reporting. Refer to Reporting documentation for detailed steps.)
Follow the Watcher installation steps to install the Watcher plugin. Since I am using an Elastic Cloud instance, it’s a simple check of the watcher option under the Plugins section and it will install it for you!

Once Watcher is installed and the Watcher service is running, create the watch using the Sense editor or curl equivalent, etc.. If you are running on the Elastic Cloud, Sense editor is pre-installed with Kibana. Watcher + Reporting integration uses Watcher’s email action with attachment capability to trigger report generation and subsequently send the resulting PDF file to the recipients specified.
Before creating the watch, configure a valid smtp server for Watcher to use for sending emails. On Elastic Cloud, you do not have to set up a smtp server and will use the one provided by the Cloud environment (however, remember to whitelist the email addresses for the recipients of your reports).
Use case: Our systems manager has been receiving reports that customers have trouble attaching files to Salesforce Service Cloud support cases. He would like to get a bi-weekly analytics report over 6 months of data on tickets filed against the Service Cloud (our support system) only if there are tickets created related to attachments within the past 2 weeks.
The watch below queries the helpdesk ticket data to see if there are any tickets filed against the support system by internal employees within the past 2 weeks, and if these tickets mention attachments in their feeds (which can be posts, emails, or comments on either). If so, the watch will fire and request the saved dashboard to be generated as a PDF report to be sent to the systems manager.
PUT _watcher/watch/reporting
{
  "trigger": {
    "schedule": {
      "interval": "14d"
    }
  },
  "input": {
    "search": {
      "request": {
        "indices": "sfcases",
        "body": {
          "size": 0,
          "query": {
            "bool": {
              "must": [
                {
                  "query_string": {
                    "query": "Ticket_Category:support AND Feeds:attachment"
                  }
                }
              ],
              "filter": [
                {
                  "range": {
                    "CreatedDate": {
                      "gte": "now-14d"
                    }
                  }
                },
                {
                  "term": {
                    "Ticket_Category": "support"
                  }
                }
              ]
            }
          }
        }
      }
    }
  },
  "condition": {
    "script": {
      "inline": "if (ctx.payload.hits.total >0) return true; else return false;"
    }
  },
  "actions": {
    "email_admin": {
      "email": {
        "to": "'John Smith <email_address@elastic.co>'",
        "subject" : "[Report][Helpdesk] Service Cloud Attachment Tickets",
        "body" : "There are new helpdesk tickets created within the past 2 weeks against the Service Cloud with feeds related to attachments.  Please review the bi-weekly PDF report attached.",
        "attachments": {
          "helpdesk_attachment_tickets.pdf": {
            "http": {
              "content_type": "application/pdf",
              "request": {
                "method": "POST",
                "headers": {
                  "kbn-xsrf": "reporting"
                },
                "read_timeout": "300s",
                "scheme": "https",
                "auth": {
                  "basic": {
                    "username": "reporting_user",
                    "password": "password"
                  }
                },
                "url": "https://<elastic_cloud_instance_id>.us-east-1.aws.found.io/api/reporting/generate/dashboard/Support-(Dashboard)-Service-Cloud-Internal-Case-Analytics?_g=(refreshInterval:(display:Off,pause:!f,value:0),time:(from:now-6M,mode:quick,to:now))&_a=(filters:!(),options:(darkTheme:!f),panels:!((col:7,id:%27Support-(Pie)-By-Status%27,panelIndex:3,row:3,size_x:3,size_y:2,type:visualization),(col:4,id:%27Support-(Pie)-By-Severity-Level%27,panelIndex:4,row:3,size_x:3,size_y:2,type:visualization),(col:3,id:%27Support-(Bar)-Date-Histogram%27,panelIndex:9,row:1,size_x:10,size_y:2,type:visualization),(col:10,id:%27Support-(Pie)-Origin%27,panelIndex:12,row:3,size_x:3,size_y:2,type:visualization),(col:1,id:%27Support-(Bar)-Owner%27,panelIndex:15,row:5,size_x:6,size_y:4,type:visualization),(col:7,id:%27Support-(Bar)-Contacts%27,panelIndex:16,row:5,size_x:6,size_y:4,type:visualization),(col:1,id:%27Support-(Pie)-Ticket-Category%27,panelIndex:17,row:3,size_x:3,size_y:2,type:visualization),(col:1,id:%27Support-(Metric)-Total-%23-of-Internal-Cases%27,panelIndex:19,row:1,size_x:2,size_y:2,type:visualization),(col:1,columns:!(CaseNumber,Contact,Subject,Priority,Status),id:%27Case-View-(Internal)%27,panelIndex:20,row:9,size_x:12,size_y:4,sort:!(CreatedDate,desc),type:search)),query:(query_string:(analyze_wildcard:!t,query:%27Ticket_Category:support%20AND%20Feeds:attachment%27)),title:%27Support%20-%20(Dashboard)%20Service%20Cloud%20Internal%20Case%20Analytics%27,uiState:(P-15:(vis:(legendOpen:!t)),P-4:(spy:(mode:(fill:!f,name:!n)),vis:(legendOpen:!t)),P-9:(vis:(legendOpen:!f))))&sync"</elastic_cloud_instance_id>
              }
            }
          }
        }
      }
    }
  }
}
The request.url string in the watch’s email action is copied from the Generation URL entry from above (screenshot in Step 4) which will be used by Watcher to generate the report on the fly. Currently, report generation is synchronous, which means that it is important to set the request.read_timeout to a timeout that is longer than the time it takes to generate the report. Otherwise, Watcher tasks can start to queue up.
For more detailed explanation of the other settings in the email action, refer to the Reporting documentation.
Step 6: Check Out the Report
Here is the resulting Watcher alert email sent by Elastic Cloud with the PDF report:
---------- Forwarded message ----------
From: Watcher Alert <noreply@watcheralert.found.io>
Date: Thu, Sep 15, 2016 at 12:43 PM
Subject: [Report][Helpdesk] Service Cloud Attachment Tickets
To: 'John Smith <email_address@elastic.co>
There are new helpdesk tickets created within the past 2 weeks against the Service Cloud with feeds related to attachments.  Please review the bi-weekly PDF report attached.
<< helpdesk_attachment_tickets.pdf (211K) >
--
This email is sent via a Watcher alert on a Found hosted cluster. Your email address was previously whitelisted. To stop receiving any Watcher alert, click: <<a href="http://email.watcheralert.found.io/u/eJwNxDEOwyAMAMDXwEZkDIF68JA_ZOoSEQMtUtVEhP6_ueEyx1wh6Ma9nEcf7fvawCDYYICMnVdLyi0e7yBMSP6p3-xsTLaE-JAqexXcEQiJhPLs0KesO5_tdykP5ZOu0WSSQw9WuPwBv48fcg"><span></span></a>http://email.watcheralert.found.io/u/…..>
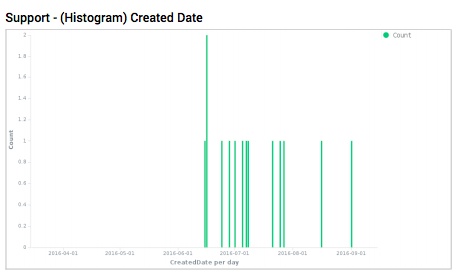
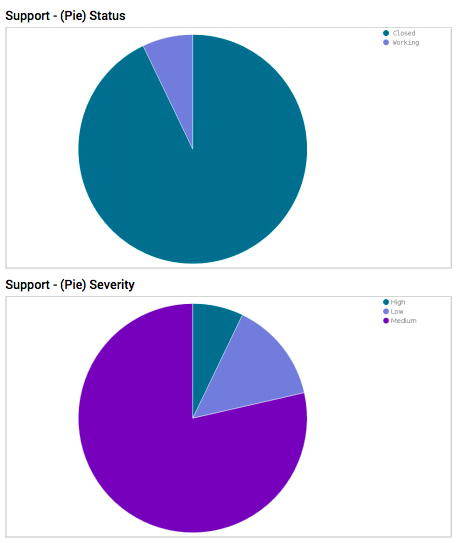
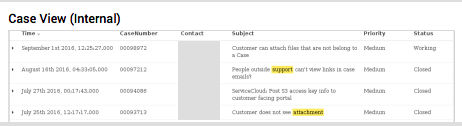
And here are a few example screens from the generated PDF report received by the systems manager. How cool is that!
Imagine the possibilities! Give it a try and don’t forget to view the Reporting Webinar video to learn more about the new reporting capabilities :)