Getting Started
editGetting Started
editReporting enables you generate reports that contain Kibana dashboards, visualizations, and saved searches.
Any user with access to the reporting index has access to every report generated by all users.
-
If you haven’t already, install the License plugin in Elasticsearch by running
bin/pluginin your Elasticsearch installation directory.bin/plugin install license
-
Install the Reporting app into Kibana by running
bin/kibana pluginin your Kibana installation directory.bin/kibana plugin --install kibana/reporting/latest
-
Set the
reporting.encryptionKeyproperty in thekibana.ymlconfiguration file. You can use any text string as the encryption key.reporting.encryptionKey: "something_secret"
-
Windows users must set the
server.hostproperty in thekibana.ymlconfiguration file. You can uselocalhostto allow only local access, or the IP address of the host. You can not leave the default0.0.0.0when using reporting on Windows.server.host: localhost
If you are using Shield, see Using Kibana with Shield and Using Reporting with Shield for additional setup instructions.
-
Start Kibana by running
bin/kibana. -
To verify your Reporting installation, point your web browser at
http://localhost:5601/to open Kibana. The Generate Report button is added to the Toolbar: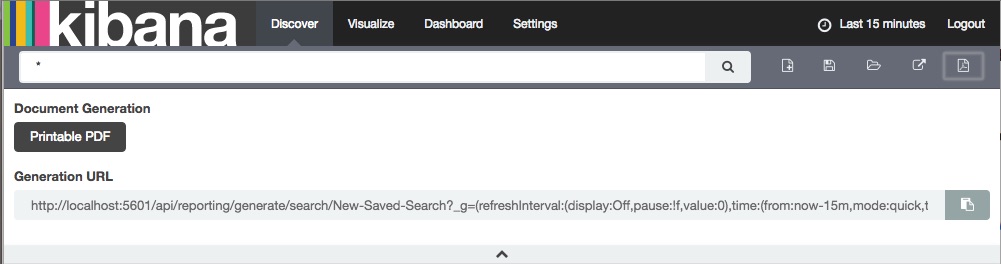
If report generation fails with the error
"Phantom immediately exited with: 127" you’ll need to install the libfontconfig
and libfreetype6 packages.
For offline installation instructions and more, see Installing Reporting.
Manually Generating Reports
editThe easiest way to generate reports is through the controls in the Kibana UI.
- In Kibana, load the dashboard, visualization, or saved search you want to include in the report.
-
Click the Generate PDF button in the Kibana toolbar:
- Click Printable PDF.
If you want to automatically generate reports from a script or with Watcher, use the displayed Generation URL.
These examples all use localhost but in a production environment you would use
the actual host name or IP address.
Automating Report Generation
editReport generation can be automated with Watcher, or by submitting an HTTP POST request from a script.
The interval between report requests must be longer than the time it takes to generate the reports—otherwise, the report queue can back up. To avoid this, increase the time between report requests.
If you are using watches to generate a lot of reports, set up a dedicated Watcher cluster instead of running Watcher on your production cluster. Currently, if the report queue backs up due to a high number of watcher-related tasks, you might need to delete the watch index and restart the node to recover. We are actively working to improve the integration between Watcher and Reporting to prevent this from happening.
You can request PDF reports through three Kibana endpoints:
-
Dashboard Reports:
/api/reporting/generate/dashboard/<dashboard-id>&sync -
Visualization Reports:
/api/reporting/generate/visualization/<visualization-id>&sync -
Saved Search Reports:
/api/reporting/generate/search/<saved-search-id>&sync
The &sync parameter is required to retrieve a PDF of the report. If you
omit it, Reporting returns a JSON structure that only contains the report
metadata.
To specify the time period you want to include in the report, you use the _g
parameter in the request. For example:
http://localhost:5601/api/reporting/generate/dashboard/error-monitoring?_g=(time:(from:now-1d%2Fd,mode:quick,to:now-1d%2Fd))&sync
You can get the URL for a particular report through the Kibana UI:
- Load the saved object.
- Click the Generate PDF button in the Kibana toolbar.
- Copy the displayed Generation URL.
To configure a watch to email reports, you use the
http attachment type in an email action.
For example, the following watch generates a report that contains the Error Monitoring dashboard and emails the report every hour:
PUT _watcher/watch/error_report
{
  "trigger" : {
    "schedule": {
      "interval": "1h"
    }
  },
  "actions" : {
  "email_admin" : {
    "email": {
      "to": "'Recipient Name <recipient@example.com>'",
      "subject": "Error Monitoring Report",
      "attachments" : {
        "error_report.pdf" : {
          "http" : {
            "content_type" : "application/pdf",
            "request" : {
              "method": "POST",
              "headers": {
                "kbn-xsrf": "reporting"
              },
              "read_timeout": "300s",
              "url": "http://localhost:5601/api/reporting/generate/dashboard/Error-Monitoring?_g=(time:(from:now-1d%2Fd,mode:quick,to:now))&sync"
            }
          }
        }
      }
    }
  }
 }
}
|
You must configure at least one email account to enable Watcher to send email. |
|
|
As of version 2.4.1, requests to the Reporting endpoints
must use POST and include the |
|
|
Increase the |
|
|
This is an example Generation URL. You can copy and paste the URL for any report from the Kibana UI. |
For more information about configuring watches, see the Watcher Reference.
Securing the Reporting Endpoints
editIn a production environment, you should use Shield to restrict access to the Reporting endpoints to authorized users. This requires that you:
- Install and configure Shield on your Elasticsearch cluster.
- Install the Shield plugin into Kibana.
- Configure an SSL certificate for Kibana.
-
Configure Watcher to trust the Kibana server’s certificate by adding it to the Watcher truststore on each node:
-
Import the Kibana server certificate into the Watcher truststore using Java Keytool:
keytool -importcert -keystore watcher-truststore.jks -file server.crt
If the truststore doesn’t already exist, it is created.
-
Make sure the
watcher.http.ssl.truststore.pathsetting inelasticsearch.ymlspecifies the location of the Watcher truststore.
-
- Add one or more users who have the permissions necessary to use Kibana and Reporting.
Once you’ve installed the Shield plugin into Kibana and enabled SSL, all
requests to the Reporting endpoints must include valid credentials.
For example, the following watch submits requests as the es_admin user:
PUT _watcher/watch/error_report
{
  "trigger" : {
    "schedule": {
      "interval": "1h"
    }
  },
  "actions" : {
  "email_admin" : {
    "email": {
      "to": "'Recipient Name <recipient@example.com>'",
      "subject": "Error Monitoring Report",
      "attachments" : {
        "error_report.pdf" : {
          "http" : {
            "content_type" : "application/pdf",
            "request" : {
              "method": "POST",
              "scheme": "https",
              "headers": {
                "kbn-xsrf": "reporting"
              },
              "auth": {
                "basic": {
                  "username": "es_admin",
                  "password": "adminpassword"
                }
              },
              "read_timeout": "300s",
              "url": "https://localhost:5601/api/reporting/generate/dashboard/Error-Monitoring?_g=(time:(from:now-1d%2Fd,mode:quick,to:now))&sync"
            }
          }
        }
      }
    }
  }
 }
}
|
You must connect to the Reporting endpoints via HTTPS when SSL is enabled. |
|
|
Provide user credentials for a user with permission to access Kibana and Reporting. For more information, see Setting up a Reporting Role. |