Use Cross Cluster Search with Elastic Cloud to improve observability
.png)

 Share on Twitter
Share on Twitter

 Share on LinkedIn
Share on LinkedIn

 Share on Facebook
Share on Facebook

 Share by Email
Share by Email

 Print this page
Print
Leveraging various tools and pieces of functionality, this blog describes how we have built a scalable cross-region and cross-provider Single Pane of Glass (SPOG) using cross-cluster search (CCS).
This blog will be useful if your Observability data is distributed across deployments, if you have multiple points of entry to view and analyze your data, and if you find yourself hopping from one Kibana instance to another to find the answers you’re looking for.
Supporting customers across multiple providers and regions means we collect and observe data within each region. Technically, we operate each region in a largely stand-alone fashion. Logs, metrics and trace data collected within that region will remain in that region. While this provides the benefits of isolation and security, it can be challenging to observe patterns across our distributed platform. If we find an interesting data point in one region, how can we easily determine if the same data point is occurring in any of our other regions?
Cross-cluster search, enhancements to the deployments API and the release of the Elastic Cloud terraform provider gives users the opportunity to create a central deployment, backed by multiple remote deployments in different regions.Scale
Cross-cluster search is a scalable solution. As we expand at Elastic Cloud, each new region is added to the central deployment as a new remote. This process needs to be seamless with the ability to keep pace with our rapid expansion. Adding observability to our ever expanding footprint needs to be a low-friction task.
Currently, we use cross-cluster search to view data from more than 150 remote observability clusters. These are distributed across more than 50 cloud regions from 4 providers. Combined, these deployments contain more than 700TB of observability data regarding our globally distributed platform.
Globally, our Elastic Cloud observability solution ingests 100TB+ of logs, metrics, and traces every day.
SLOs and SLIs
A key pillar of any observability solution is the definition of Service Level Indicators (SLIs) and Objectives (SLOs). This is covered in more detail by this blog post. Our reliability and development teams have been diligent in their definition and measurement of these essential indicators. This talk from ElasticON 2021 gives great insight into how this was achieved. In building a large cross-cluster search observability solution, these SLI’s should be front and center, easily accessible, and presented in the correct regional and/or global context.
Requirements:
With these considerations, our key requirements were:
- To leverage cross-cluster search (CCS) functionality.
- Be scalable.
- Adding CCS configurations for new regions should be painless and easy.
- Performance should scale with our growth.
- Be described in code, using the Elastic Cloud terraform provider.
- Surface both and global and regional SLIs to ensure easy visibility into the achievement of our operational objectives.
As we scale to provide services across more regions and providers, this solution will allow new remote deployments to be added to the infrastructure, described in code, and deployed with the terraform provider.
Step 1 : Deployment Identification
Which deployments will be used as “remotes” in our setup?
Using the Elastic Cloud Deployments API, we can associate some user-defined metadata tags with our deployments. For example, each deployment that will be used as a remote in our CCS setup can be tagged as `purpose : region_observability`.
The metadata object contains an array of key/value pairs, as described in DeploymentUpdateMetadata. Take a look at the Elastic Cloud API documentation to learn more about our powerful API-driven functionality.
PUT /api/v1/deployments/<deployment_id>
{
   "prune_orphans" : false,
   "metadata" : {
       "tags" : [
           {
               "key" : "purpose",
               "value" : "region_observabilty"
           }
       ]
   }
}Now that your deployment is tagged, it can be programmatically identified via the API without needing the ID or name. You can, of course, apply the same label to several deployments.
Step 2 : Define your central deployment
It is time to create your new central deployment. This will be where you access the various UI elements to view the data in your remote deployments leveraging the power of CCS.
The Elastic Cloud terraform Provider allows you to describe this deployment quite easily in codeAfter configuring the provider (https://github.com/elastic/terraform-provider-ec#example-usage), create a simple `ec_deployment` resource.
resource "ec_deployment" "central_deployment" {

  name = "My Central CCS Deployment"

  region                 = "us-east-1"
  version                = “7.15.1”
  deployment_template_id = "aws-io-optimized-v2"

  elasticsearch {}

  kibana {}
}You will note the absence of any “remote_cluster” definitions in the ec_deployment resource. We will add these using dynamic blocks and a for each argument.
Step 3 : Search for your remote deployments
This is where the fun really starts. We can use the provider’s ec_deployments datasource to return a list of deployment_ids for those deployments we tagged in Step 1. Iterate over this list of deployment_ids to generate an instance of the ec_deployment datasource for each remote cluster.data "ec_deployments" “metadata_filter" {
tags = {
"purpose" = "region_observabilty"
}
}
data "ec_deployment" "remote_deployments" {
count = length(data.ec_deployments.metadata_filter.deployments.*.deployment_id)
id = data.ec_deployments.metadata_filter.deployments[count.index].deployment_id
}Step 4 : Flattening
The resulting nested object (remote_deployments) is not yet suitable for use with dynamic blocks and a for each argument. We will need to flatten this structure into something we can use.
flat_remote_deployments = flatten([
	for c in data.ec_deployment.remote_deployments : {
  	deployment_id = c.id
  	alias     	= format("%s-%s", c.tags.purpose, c.region)
  	ref_id    	= c.elasticsearch.0.ref_id
	}
])The “alias” field defined here will become the CCS alias used to perform searches of remote clusters. In this case, we can expect something like “region_observabilty-us-east-1”.
Step 5 : Put it all together
The flattened object can now be used to populate the relevant “remote_cluster” field in the original ec_deployment resource created in Step 2.resource "ec_deployment" "central_deployment" {
name = "My Central CCS Deployment"
region = "us-east-1"
version = “7.15.0”
deployment_template_id = "aws-io-optimized-v2"
elasticsearch {
dynamic "remote_cluster" {
for_each = local.flat_remote_deployments
content {
deployment_id = flat_remote_deployments.value.deployment_id
alias = flat_remote_deployments.value.alias
ref_id = flat_remote_deployments.value.ref_id
skip_unavailable = true
}
}
}
kibana {}
}Step 6 : Kibana configuration
Once your terraform configuration has been successfully applied, your central deployment will be configured with the relevant remote cluster as CCS backends. Log in here and take a look around.

Under the menu “Stack Management -> Remote Clusters” you will see the configured deployments.
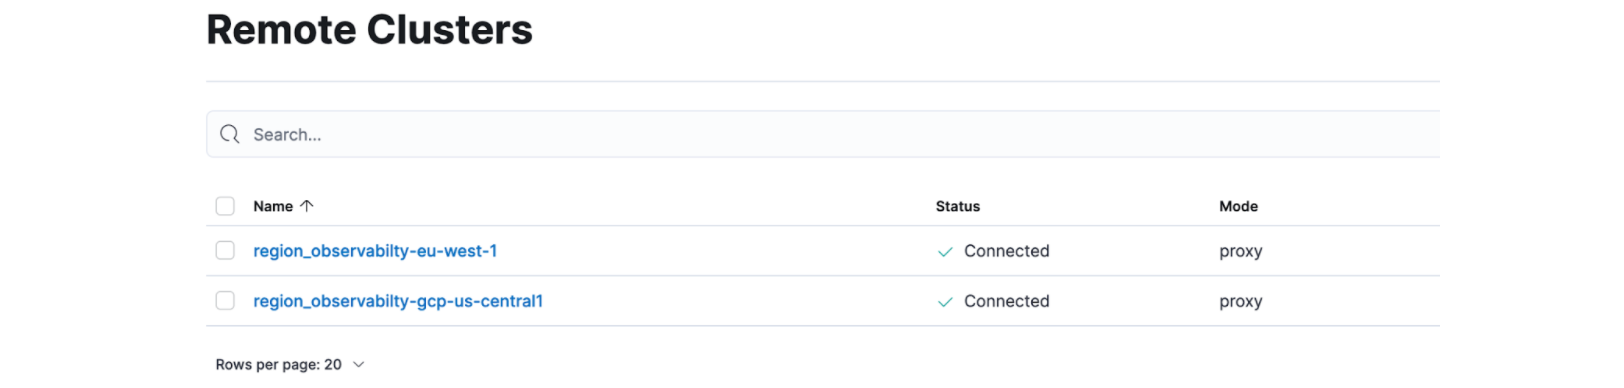
GET region_observability-eu-west-1:filebeat-*/_search
GET region_observability-*:filebeat-*/_searchUse these alias patterns to configure the various UI components in Kibana. For example, with Observability -> Logs, you can set the application to look for logs in your remote deployments.

Wrapping it up
We now have a central Kibana point-of-entry for data exploration. Data from all your tagged deployments is now available here to view and analyze.
Have a new cluster to add? Simply add the relevant metadata tags (see Step 1), your terraform definition will build a new plan, and apply the changes seamlessly.
Hopefully you now have a glimpse of the power and flexibility that comes from combining the power of terraform, the Elastic Cloud provider, and the functionality available from the Elastic Cloud API.
Share
- Share on Twitter
Share on Twitter
- Share on LinkedIn
Share on LinkedIn
- Share on Facebook
Share on Facebook
- Share by Email
Share by Email
- Print this page
Print