Integrating the Elastic Stack with ArcSight SIEM - Part 3
Editor's Note (August 3, 2021): This post uses deprecated features. Please reference the map custom regions with reverse geocoding documentation for current instructions.
| Get your ArcSight security data into Elasticsearch and visualized in Kibana in literally minutes with the Logstash ArcSight module. Learn more. |
Editor's Note: Be sure to check out the other posts in this 6-part blog series. Part 1 kicks off the series with getting started content. Part 2 continues the story with how to proactively monitor security data in Elasticsearch using X-Pack. This is part 3 that walks you through how to scale the architecture. Part 4 and Part 5 provide examples of setting up alerts for common security threats using the alerting features in X-Pack. Part 6 extends the alerting story with automated anomaly detection using machine learning.
In our previous blog in this series (part 1, part 2) we demonstrated a simple architecture for integrating ArcSight with Elasticsearch.
In this blog post, we will continue with the same theme by showing you how to scale the architecture.
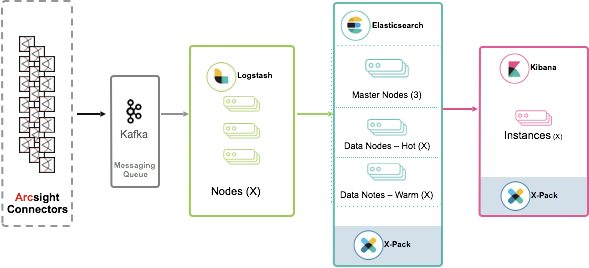
If you need to have high indexing throughput and a long retention policy, you can set up a hot-warm architecture for Elasticsearch. For the ingestion side, you can use a message queue between ArcSight and Elasticsearch. This provides architectural isolation between the producer (Arcsight Smart Connector) and the consumer, thus allowing Logstash to be scaled independently. To process more data, you simply have to add more Logstash instances for a topic.
Kafka also helps to buffer the incoming data in case it exceeds the Elasticsearch cluster’s ability to ingest the data during a peak periods or spikes. Whilst Logstash persistent queues ensure end to end delivery, data loss is still possible due to the loss of a Logstash instance. Through data replication, Kafka protects against this scenario.
How to integrate ArcSight with Elasticsearch using Kafka as a messaging queue:
The following architecture becomes possible with the ArcSight Smart Connector, with HP recently adding Kafka as a supported destination. This architecture also requires the user to add a Kafka destination to the ArcSight Smart Connector, with Logstash nodes pulling data from the appropriate Kafka topic before indexing into Elasticsearch.
Logstash can read directly from Kafka using the Kafka input plugin, which integrates natively using the Java APIs.
You can find more details about using Kafka with the Elastic Stack in the blog series “Just Enough Kafka for the Elastic Stack” Part 1 and part 2.
Setup the Elastic Stack
- Download and install Elasticsearch. In the Elasticsearch install directory, install X-Pack and start Elasticsearch:
bin/elasticsearch-plugin install x-pack
bin/elasticsearch - Download and install Kibana. In the Kibana install directory, install X-Pack and start Kibana:
bin/kibana-plugin install x-pack
bin/kibana - Download and install Logstash. In the Logstash install directory, install X-Pack and update the Logstash Kafka input plugin:
bin/logstash-plugin install x-pack
bin/logstash-plugin install logstash-input-kafka - Start the Logstash ArcSight module by running the following command in the Logstash install directory:
bin/logstash --modules arcsight --setup -M "arcsight.var.inputs=kafka" -M "arcsight.var.input.kafka.bootstrap_servers=192.168.0.13:9092" -M "arcsight.var.elasticsearch.username=elastic" -M "arcsight.var.elasticsearch.password=changeme" -M "arcsight.var.kibana.username=elastic" -M "arcsight.var.kibana.password=changeme" -M "arcsight.var.input.kafka.topics=cef"
- The `--modules arcsight` option spins up an ArcSight CEF-aware Logstash pipeline for ingestion. The `--setup` option creates an “arcsight-*” index pattern in Elasticsearch and imports Kibana dashboards and visualizations. On subsequent module runs or when scaling out the Logstash deployment, the `--setup` option should be omitted to avoid overwriting the existing Kibana dashboards.
For a full list of ArcSight module settings, see the documentation on “ArcSight Module Configuration Options”.
Set up the Elastic Stack and Kafka with Docker
In this example, we use Docker to simplify the installation and configuration of the Elastic and Kafka components.
- Ensure that:
- You have Docker Engine installed.
- Your host meets the prerequisites.
- If you are on Linux, docker-compose need to be installed.
- Download an example from here to help you installing the full Elastic Stack with X-Pack plugin and also install Kafka.
- Set the environment variable KAFKA_ADVERTISED_HOST_NAME in the docker-compose.yml file.
- Then issue in the command line:
$ docker-compose up.
Add Kafka destination to ArcSight Connectors
- Run the command <installdir>\current\bin\arcsight agentsetup
- Select ‘Yes’ to start the ‘wizard mode’
- Select ‘I want to add/remove/modify ArcSight Manager destinations’
- Select ‘add new destination’
- Select ‘Event Broker (CEF Kafka)’
- Add the information of the Kafka server and port you used in the docker-compose for the environments variable KAFKA_ADVERTISED_HOST_NAME and KAFKA_ADVERTISED_PORT
- Add the Topic name cef
Visualize and explore your data
- Point your web browser at http://localhost:5601/ to open Kibana. You should be prompted to log in to Kibana. To log in, you can use the built-in ‘elastic’ user and the password ‘changeme’. NOTE: These are the same credentials used in the arcsight module installation. When you change them ensure you update your logstash configuration.
- Open the “[ArcSight] Network Overview Dashboard”
- For more information on exploring security data with the ArcSight module, see the documentation on “Exploring Your Security Data”.
In our next post we will talk about X-Pack alerting features to detect and alert on more complex patterns within the same dataset.
Interesting in learning more? Check out other posts in the Elasticsearch + ArcSight series.
- Part 1 - How to send Common Event Format data from ArcSight to Elasticsearch
- Part 2 - How to proactively monitor security data in Elasticsearch with X-Pack alerting features
- Part 3 - Scaling your ArcSight and Elasticsearch architecture
- Part 4 - Detecting Successful SSH Brute Force Attacks
- Part 5 - Detecting Unusual Process using Rules Based Alerts
- Part 6 - Using Machine Learning to Detect Rare (unusual) Processes on a Server