How to
Kibana's New Time Series Visual Builder - Part 2
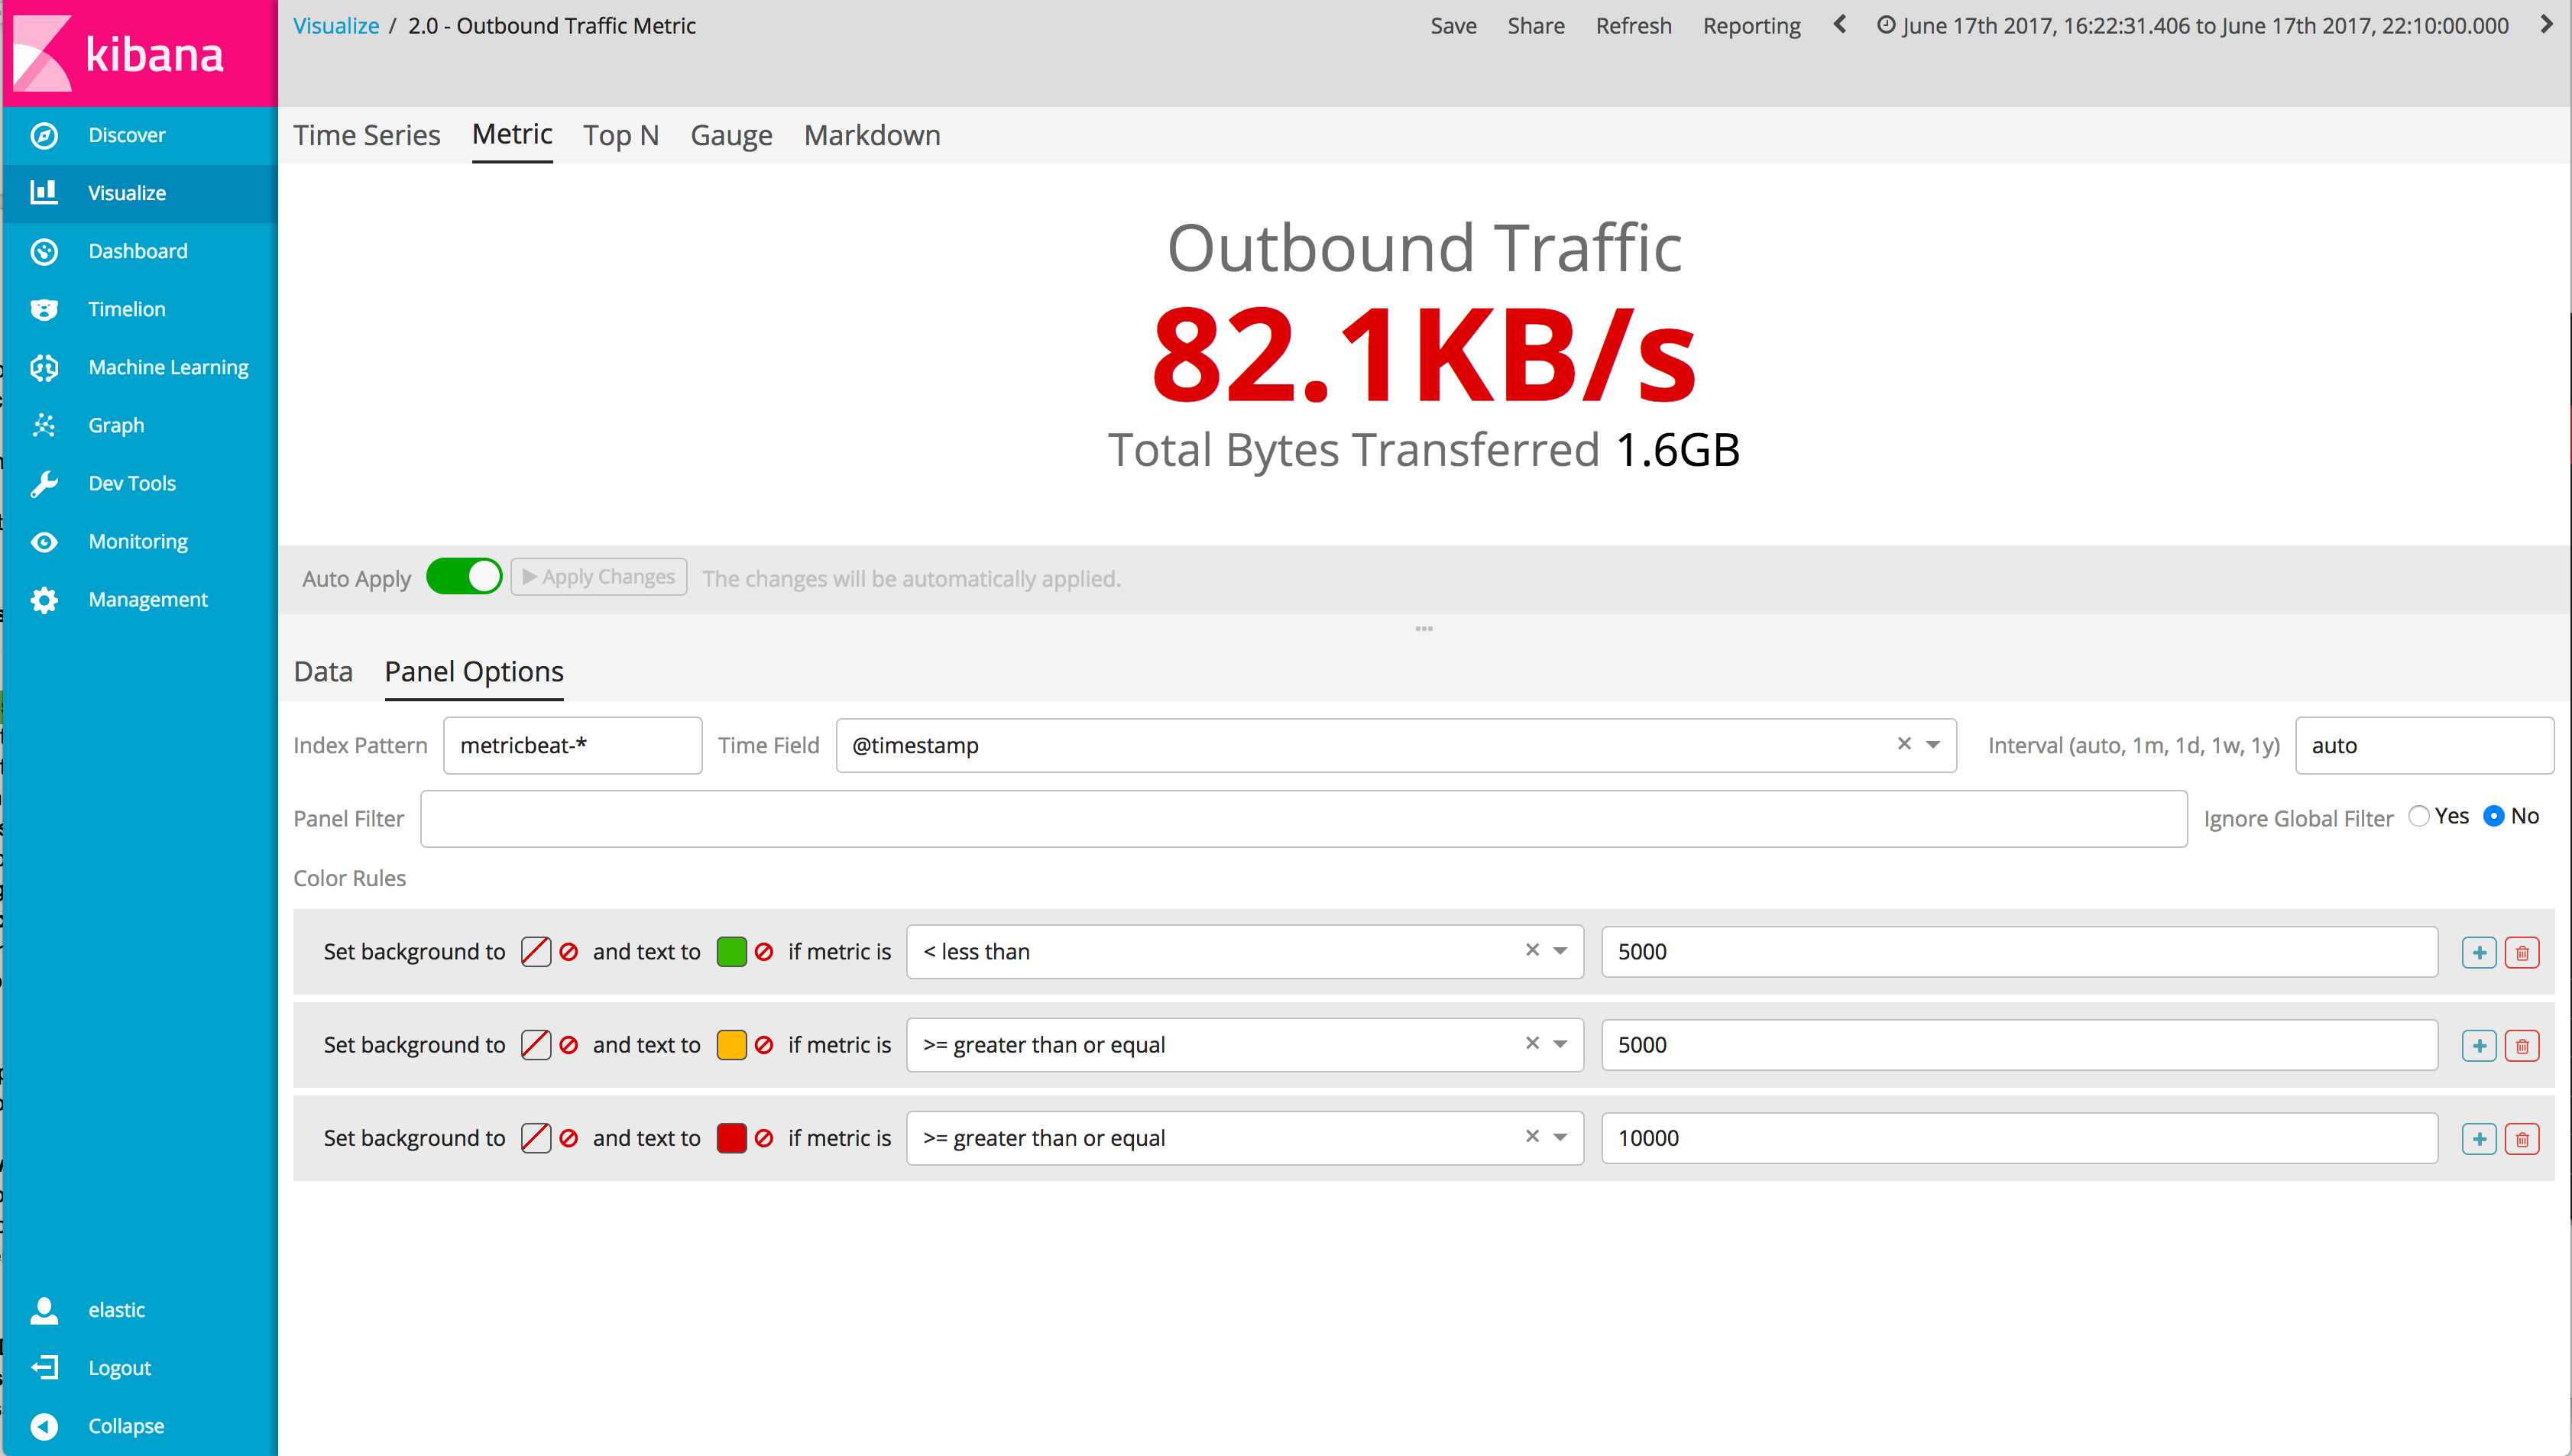
Hard on the heels of our first time series video tutorial, Chris Cowan is back with another video show off how powerful and versatile this new UI is. If you'd like to follow along, go ahead and download Metricbeat to start ingesting metrics from your systems or services. You'll also want to make sure you have the latest version of Kibana installed.
In this video, you will learn to do the following:
- Quickly change visualization types with the same data
- Use the overall functions to aggregate over the total time interval in single metric
- Take advantage of the data formatter easily switch between data types
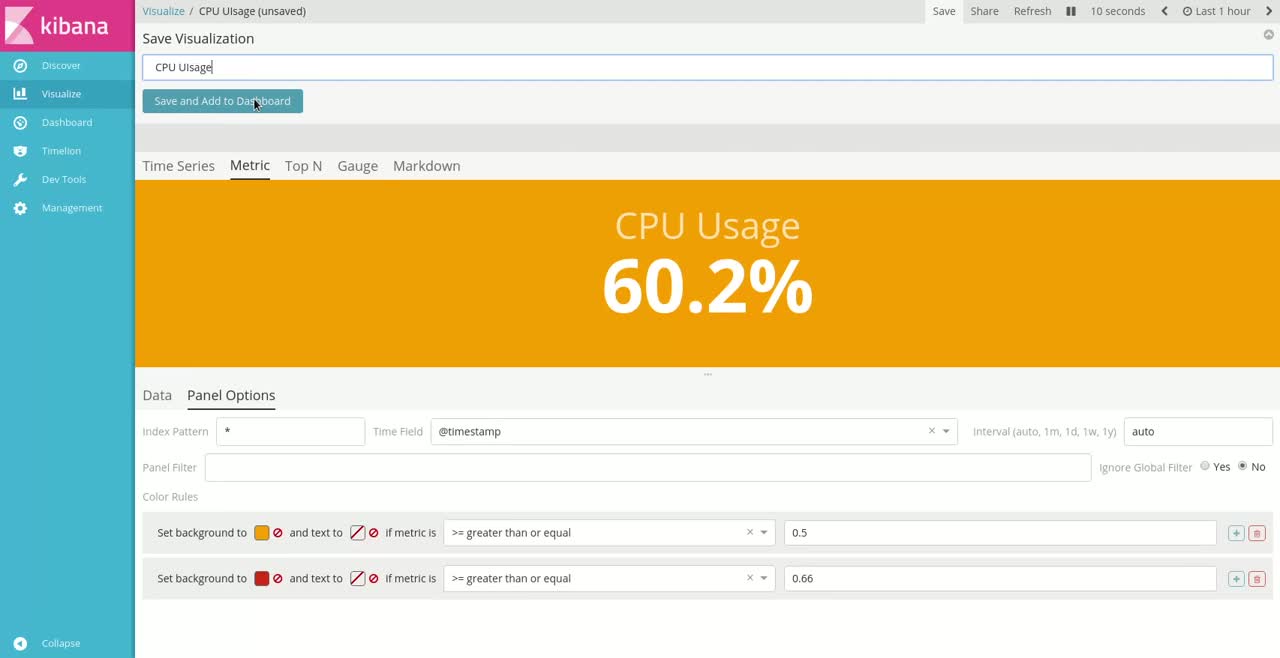
- Conditionally style a metric visualization based on the most recent value of your time series data
Ready to dive in? Check out the video tutorial below.
Be on the lookout for our next tutorial with the new time series visual builder!