Kibana 6.5.0 Released
It’s Kibana release time again! 6.5 release comes with many new high-impact features including Spaces, Rollup support, and Canvas. It also includes lots of medium and smaller features, such as Console improvements.
Download Kibana 6.5.0
Kibana 6.5.0 release notes
Plugin API changes
Please refer to the above release notes for details, but there are a few important changes which are worth highlighting:
- Organize your work in Spaces
- Showcase your data in Canvas
- Create a rollup job from Kibana
- Get started with two new sample data sets
- Visualize data from a log file
- Visualize infrastructure metrics and logs
- Console improvements
Organize your work in Spaces
Spaces is one of our most highly requested features. Spaces allow you to organize your saved objects into meaningful categories. For example, you might place all sales visuals in a sales space and all logging objects in a logging space. You can create as many spaces as you need, change spaces at any time, and move saved objects between spaces. With security enabled, you can control which roles and users have access to which spaces using RBAC.
To create, edit, and delete spaces, use Management > Spaces. Or, if you prefer to create your spaces programmatically, you can use Kibana’s Spaces API.
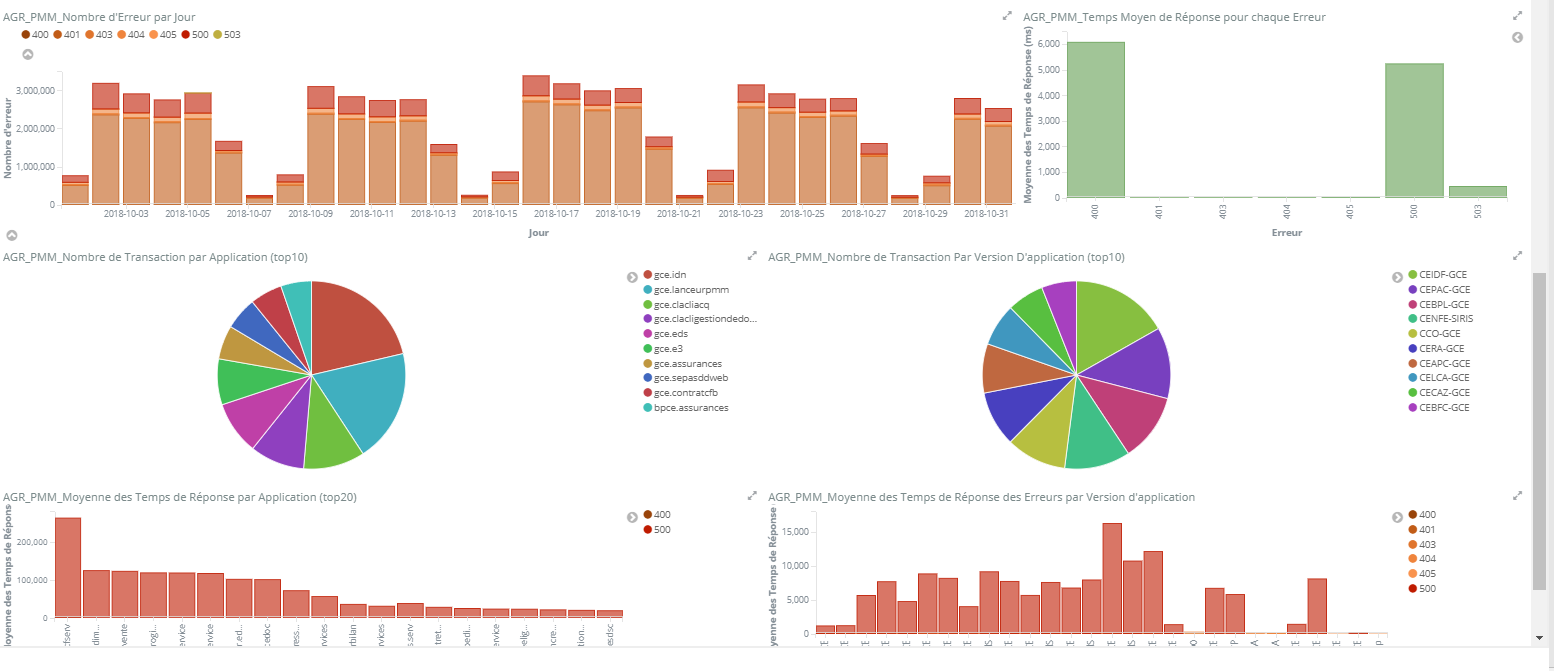
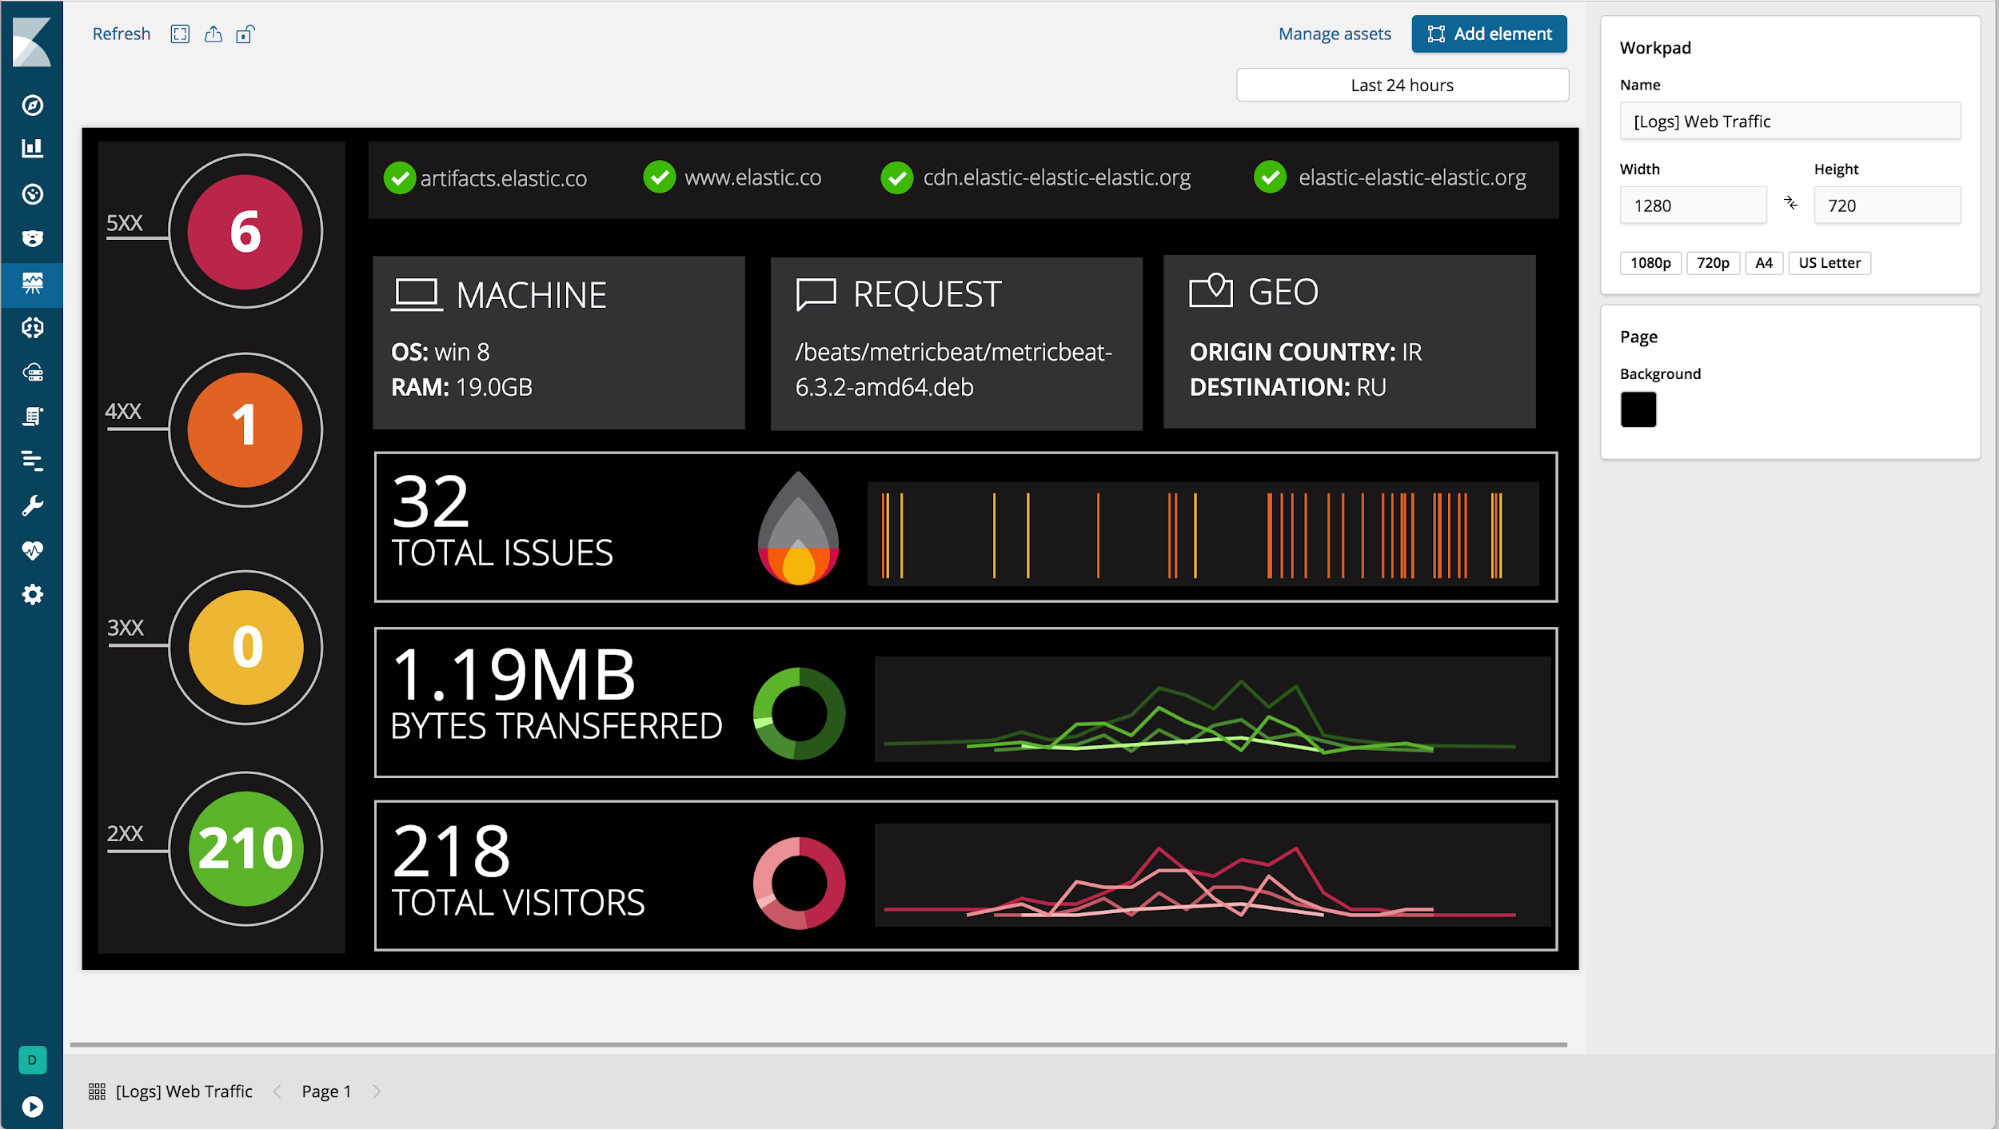
Showcase your data in Canvas (beta)
Canvas, Kibana’s new space for showcasing your data live in a pixel-perfect design, is available for you to test drive in 6.5. Starting with a blank workpad, you can create a story about your data by combining static content (text, images, and shapes) with data-driven elements (charts, tables, images, and many others). Each dynamic element is connected to a sample data source by default, so you can experiment with it before connecting to your own data. Canvas supports multiple languages for querying Elasticsearch: es docs, SQL, and Timelion syntax.
Canvas tools have rich styling capabilities, allowing users to change colors and styles of both static and dynamic elements. Canvas is designed that you can tweak an element’s content and style using the UI, or go deeper and edit the expressions that create the element or the css styling. In short, Canvas gives you everything you need to showcase your live data, your way.
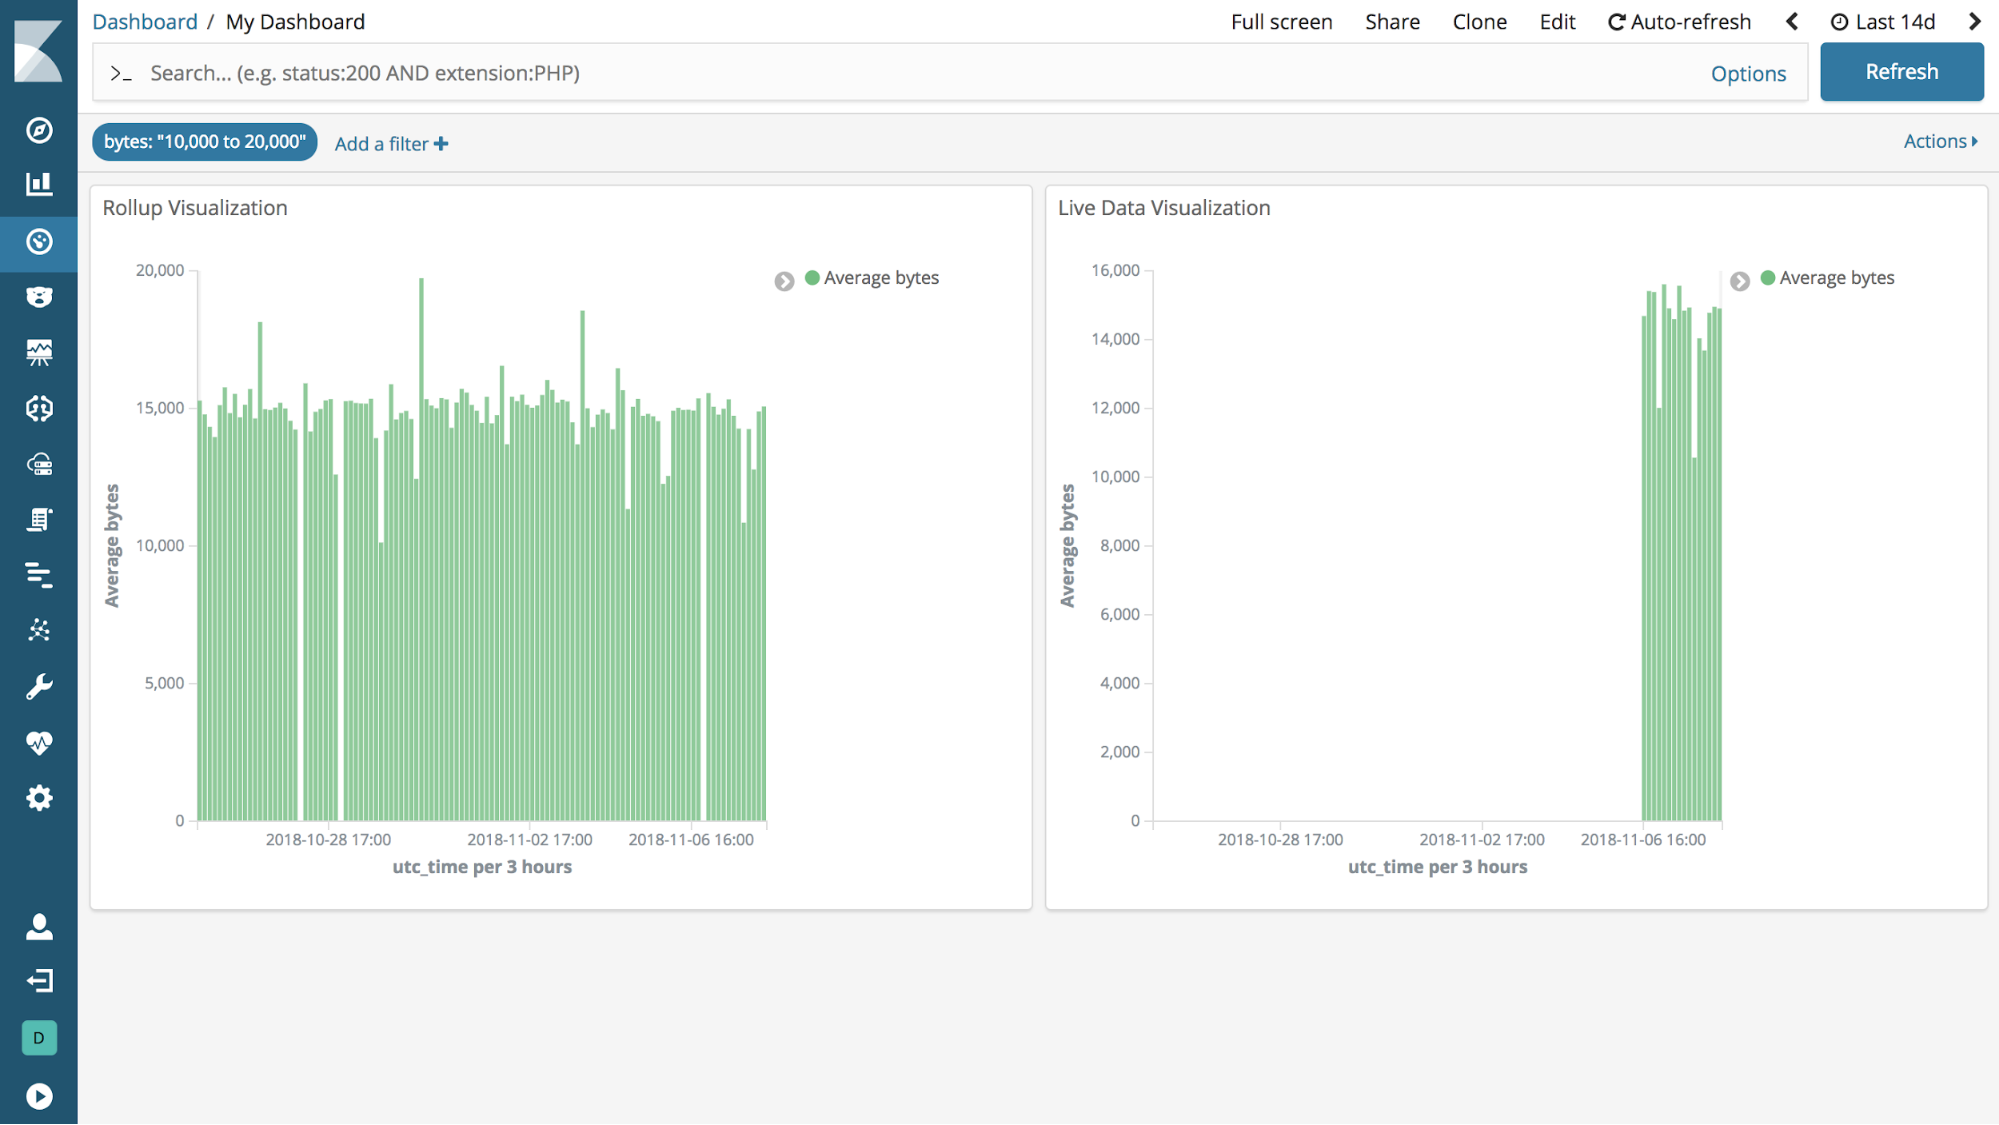
Create and manage rollup jobs
Kibana has a new Management UI for creating, starting, stopping, and deleting rollup jobs. Rollups is a recent addition to Elasticsearch and APIs for creating and managing rollups have been available since 6.4. A rollup index summarizes historical data and stores it compactly for future analysis, so you can query, aggregate, and visualize this data using a fraction of the storage. A rollup job is a periodic task that aggregates the data for the rollup index. To navigate to the UI, go to Management, and under Elasticsearch, click Rollup Jobs.
View rolled up data in visualizations (beta)
Kibana now has beta features for visualizing rolled up data. You can create index patterns that use rollup indices or mix rollup and raw indices to visualize all data together. Most visualizations support rolled up data, with the exception of Timelion, Visual Builder, and Vega visualizations. You can also create dashboards that use visualizations based on rolled up and raw data. Finally, both rolled up and raw data are available in Discover.
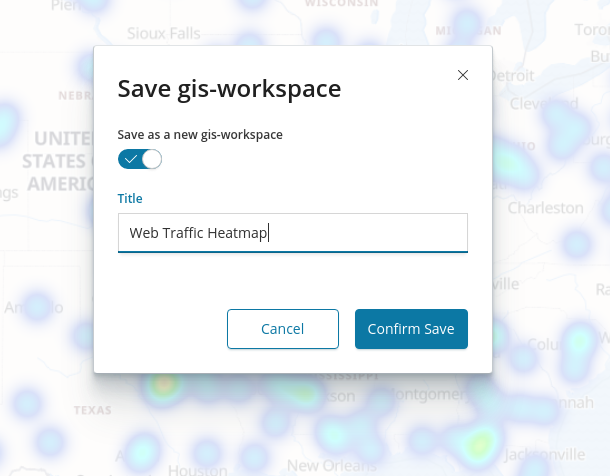
Get started with two new sample data sets
Kibana has two new, one-click sample data sets tailored to the new user experience. If you’re interested in business analytics, install the eCommerce data set, which has visualizations for product-related information, such as cost, revenue, and price. If you’re looking to analyze website traffic, check out the web logs sample data set.
To access the sample data, go to the Kibana home page and click Load a data set and a Kibana dashboard. In addition, to a traditional dashboard, each sample is prepackaged with a Canvas workpad. The workpad for the eCommerce sample has two different styles for the same data. The workpads are a simple, hands-on way for new users to learn Canvas.
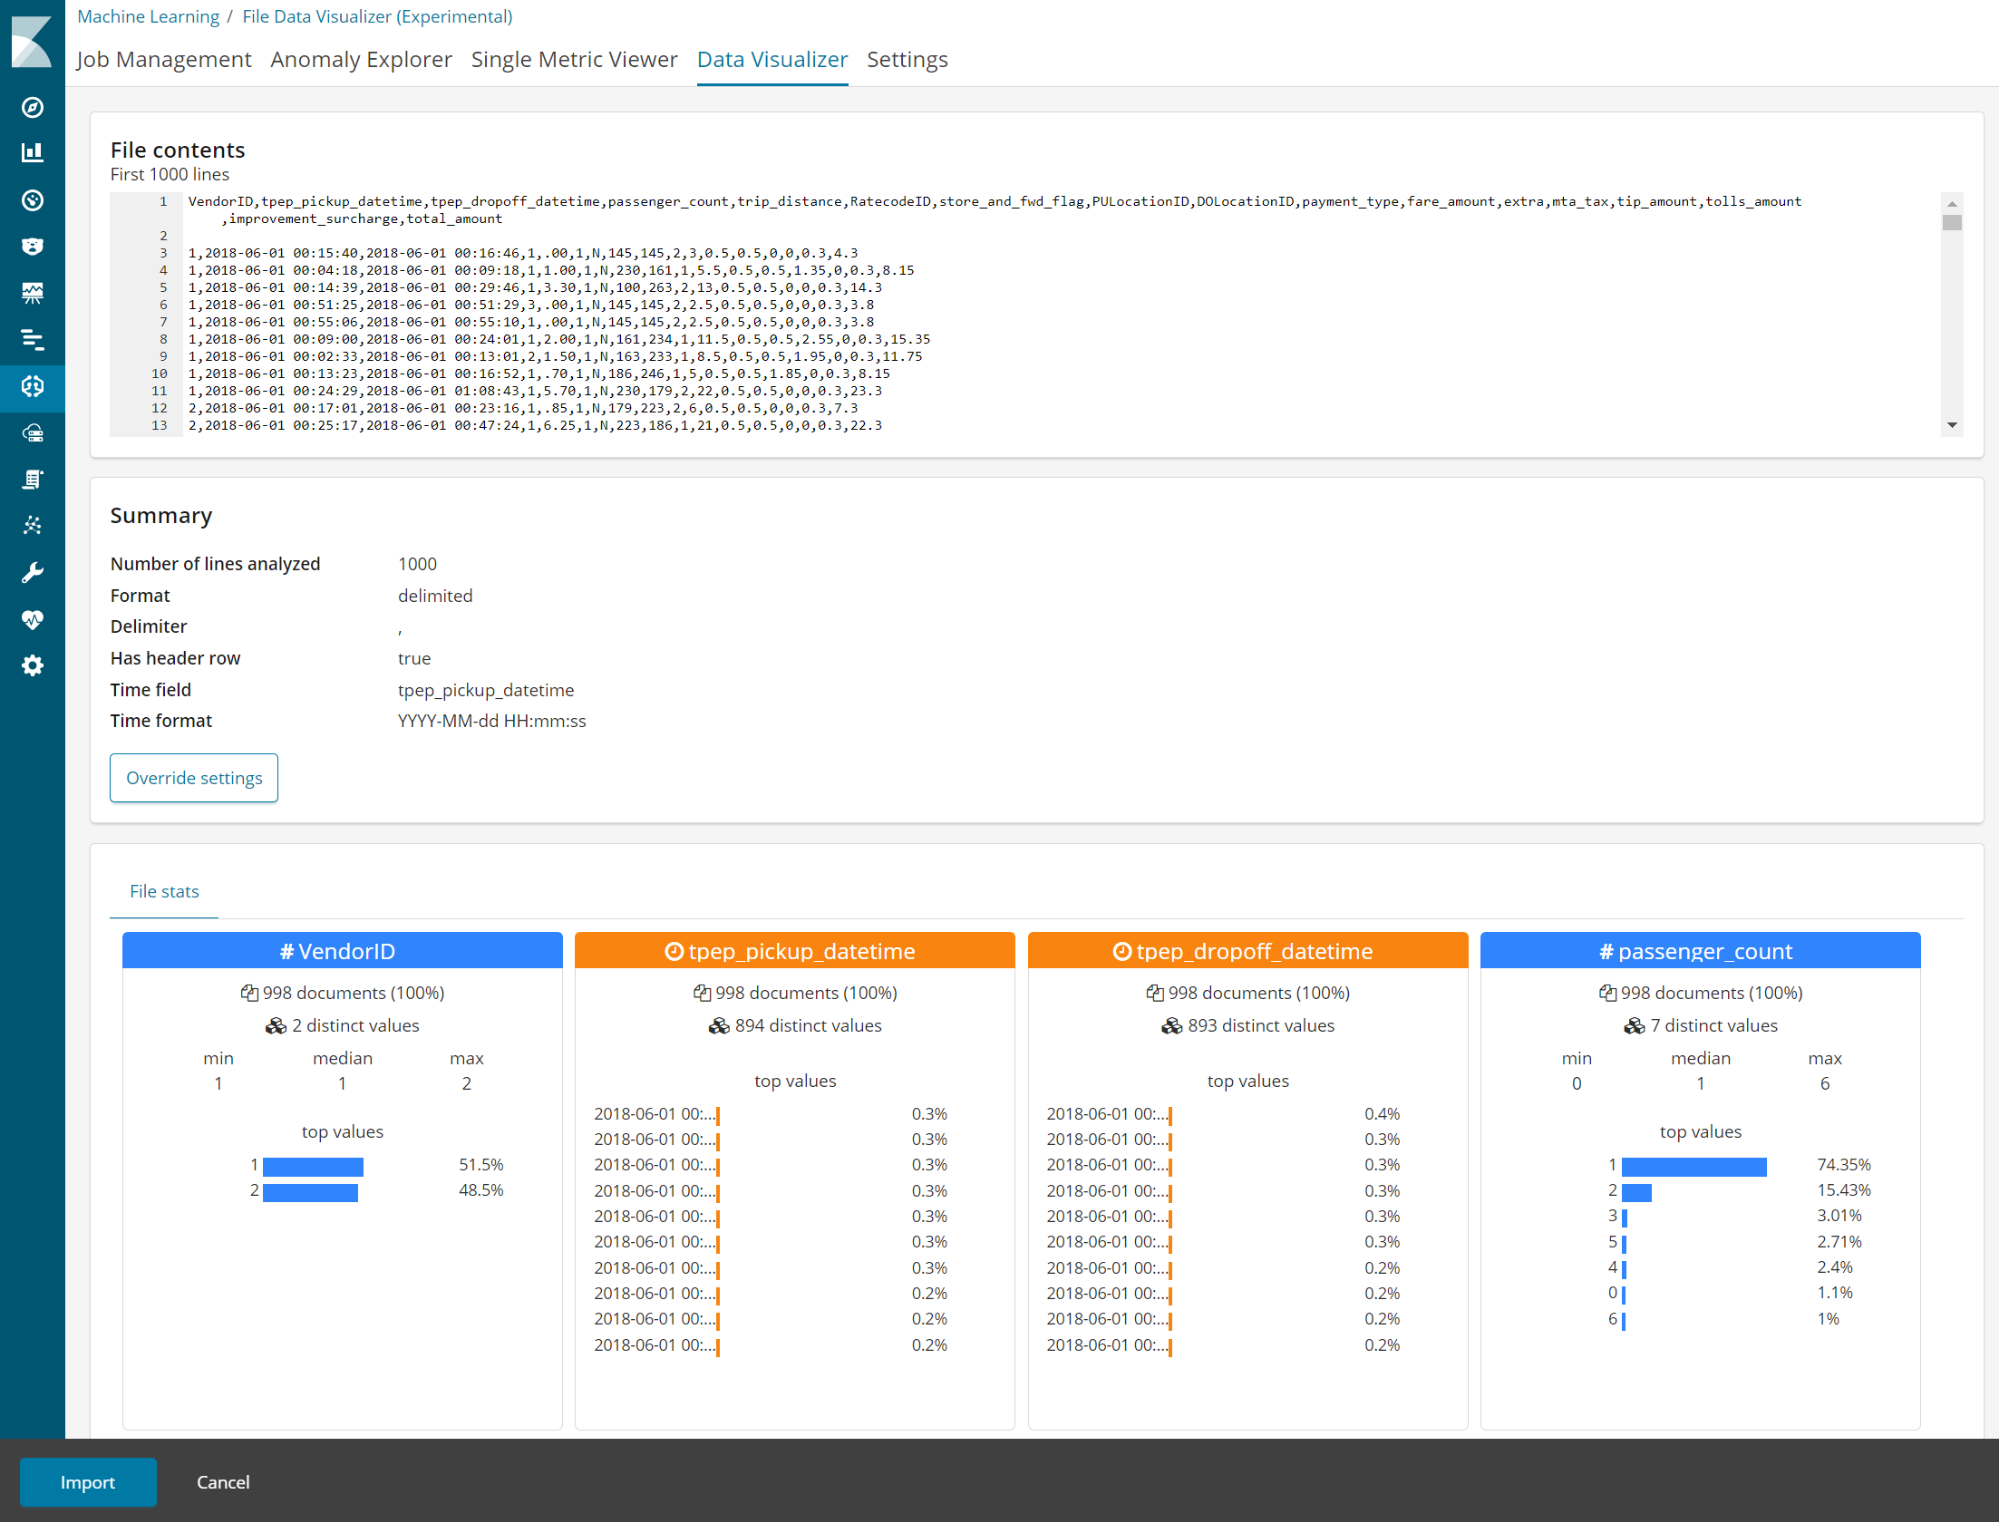
Visualize data from a log file
Machine learning features are now available for users on a Basic license. The Data Visualizer helps you understand the metrics and fields in your data in preparation for further analysis. With the new File Data Visualizer, you can upload a CSV, NDJSON, or log file. The File Data Visualizer uses the new File Structure API to identify the file format and field mappings. You can then choose to import the data into an Elasticsearch index. The log file import feature is experimental in 6.5, and is limited to files up to 100 MB in size.
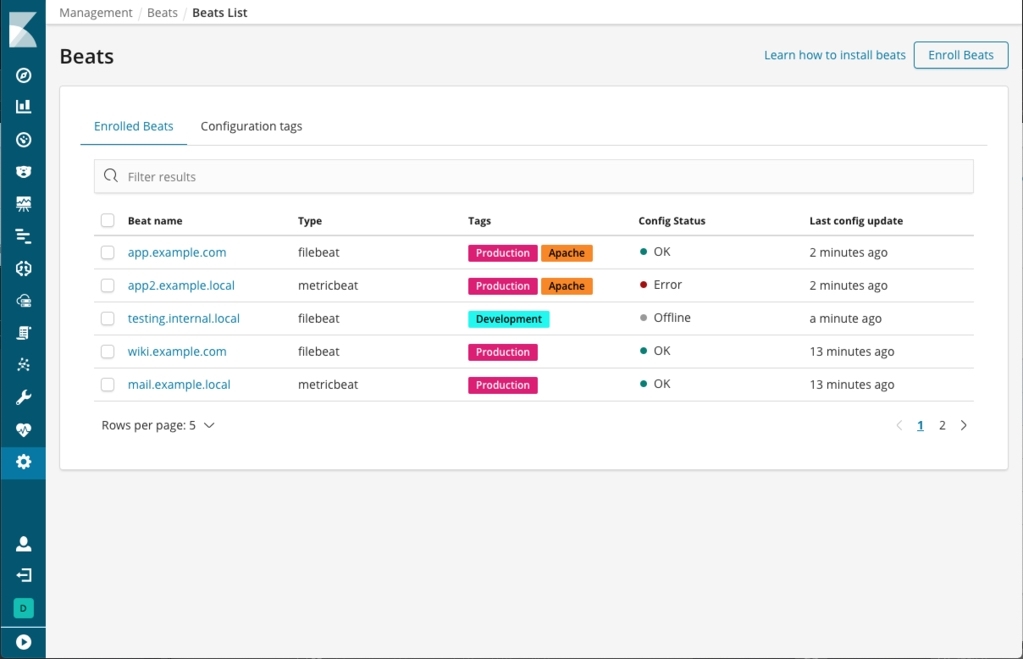
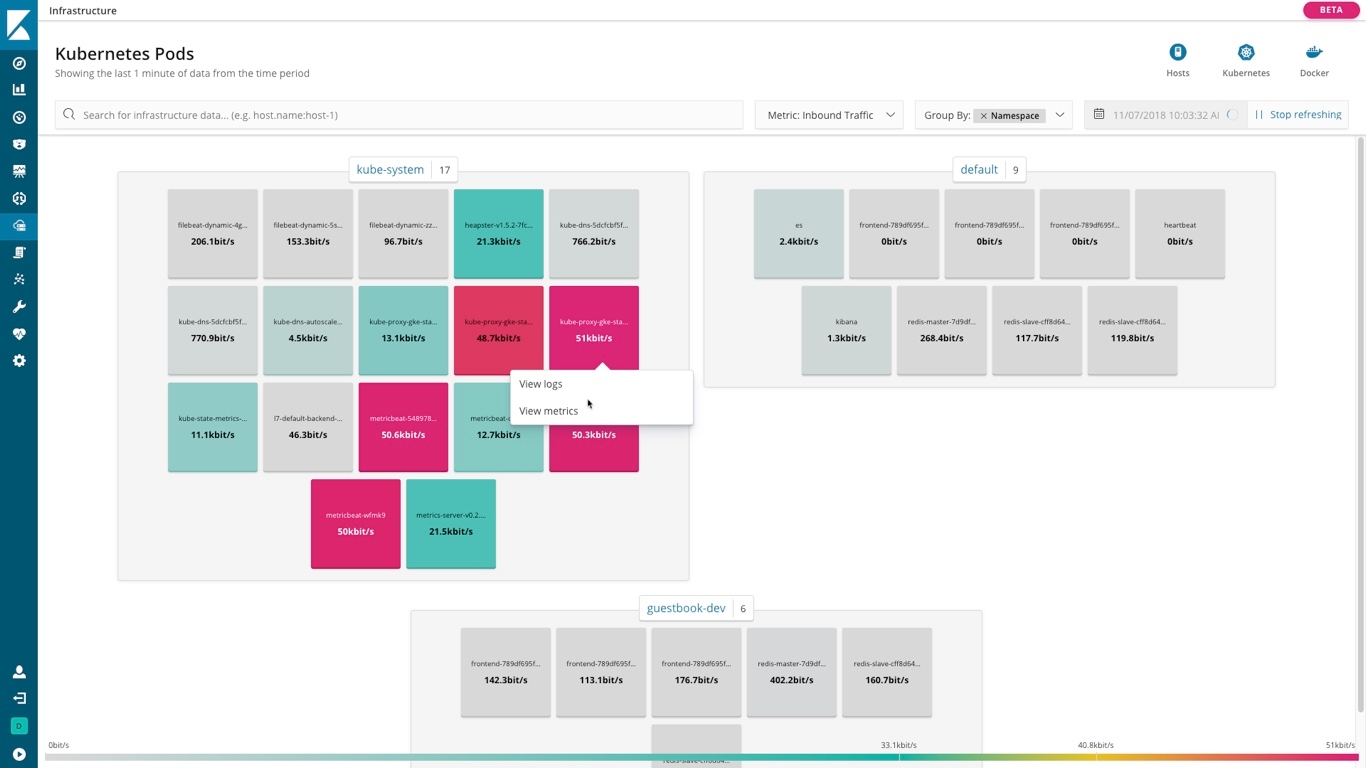
Visualize infrastructure metrics and logs (beta)
Kibana 6.5 adds two applications, called Infrastructure and Logs. Together with the APM solution, these applications further extend the Elastic Stack support for the three types of operational observability data -- logs, metrics, and application traces.
The Infrastructure application helps you work with log and metric data coming from a large number of servers and containers. It enables common workflows, starting with a high level view of key infrastructure KPIs and drilling down into logs and metrics for each host or container. This application requires latest versions of Filebeat and Metricbeat and associated System, Kubernetes, and Docker modules and metadata processors (see setup instructions).
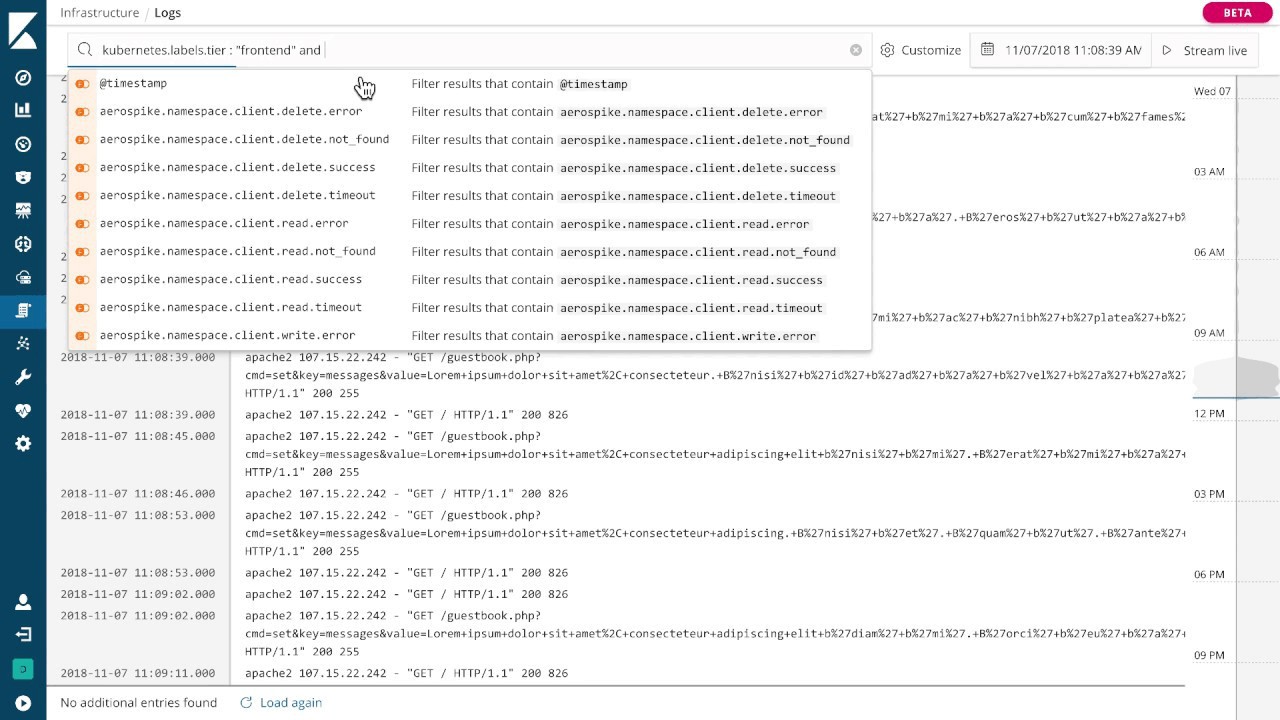
The Logs application is designed to give you a compact, console-like view of your log files, both from a historical and real-time perspective. Want to search through a bunch of old logs? The search bar at the top helps you find what you need with auto-complete suggestions. Want to centrally tail logs in real time during an incident? The live log tail feature helps you do that with a click of a button.
Read more detail about these two applications in the Beats 6.5 release blog. These applications are in Beta, and we would love to hear your feedback in the Infrastructure and Logs discuss forums.
Console improvements
In this release we are expanding auto-complete functionality in the Console to additional query DSL types (see #19178) and templates available in the _template endpoint (#20141). We are also adding links to the documentation for a given endpoint to the tools dropdown menu. Documentation is also available from a keyboard shortcut CTRL/CMD+/. See #19715
Finally, Grok debugger is enhanced with syntax highlighting (see #18572).
Cheers,
Kibana
* Added 'Visualize data from log file' section - Nov 16, 2018
p.p1 {margin: 0.0px 0.0px 0.0px 0.0px; line-height: 16.0px; font: 14.0px Arial; color: #61727d; -webkit-text-stroke: #61727d; background-color: #ffffff}
p.p2 {margin: 0.0px 0.0px 0.0px 0.0px; line-height: 16.0px; font: 14.0px Arial; color: #61727d; -webkit-text-stroke: #61727d; background-color: #ffffff; min-height: 16.0px}
span.s1 {font-kerning: none}