Increasing Memory Efficiency with an Improved Elastic APM Internal Intake Protocol
The intake protocol is what we call the internal protocol that APM agents use to talk to the APM Server. Recently, we have been working on an improved version of this protocol to increase the memory efficiency and predictability of the APM Server and APM agents. This blog will take a look at these improvements.
As an Elastic APM user, you will likely never interact directly with the intake protocol. Instead, you’ll hook an agent up to your application, and that agent will then use the intake protocol to talk to the APM server. For a refresher on how the components fit together in Elastic APM, see the component overview.
Current Intake Protocol
The initial version of the intake protocol was designed to be a simple, HTTP- and JSON-based protocol. It was important for us to make the intake protocol HTTP-based because we wanted our data to be able to traverse corporate networks unhindered, because it would make it simpler to put a load balancer in front of APM servers, and because using HTTP meant we’d be able to use all the tooling that is already out there for testing and benchmarking.
Transmitting data to the APM Server requires an HTTP request from an agent to the APM Server. A single outgoing HTTP request incurs negligible impact on the application in which the agent is running. However, without some kind of buffering, we would be sending an HTTP request for each transaction in the monitored application, which would incur a significant overhead. For this reason, agents accumulate transactions in memory as they happen and then at some point, send the data to the APM Server to be stored in Elasticsearch. The object that is sent looks roughly like this:
{
    "service": {
        "name": "ecommerce-front"
    },
    "transactions": [
        {
            "name": "GET /index",
            "spans": [
                {"name": "SELECT FROM products", "duration": 323},
                {"name": "SELECT FROM users", "duration": 202}
            ]
        },
        {
            "name": "POST /login",
            "spans": [
                {"name": "SELECT FROM users", "duration": 202},
                ...
            ]
        },
        ...
    ]
}
The flushing of the accumulated transactions is triggered when a certain amount of time has passed since the agent last flushed its data to the APM Server, or by a limit on the number of transactions accumulated. By decreasing the limits, operators can limit the amount of memory used by the agent. Before the data is sent, the agent has the option to compress the body to reduce bandwidth consumption.
In the APM Server, the same steps happen in the opposite order. When a request comes in, the body is decompressed and the JSON is parsed into memory.
In the agents, there are various optimizations that can be made to the buffering, serialization and compression code to improve memory efficiency and object reuse. We found, however, that they all came with significant complexity and were mostly awkward to implement.
Improved Intake Protocol
Our second iteration on the intake protocol takes inspiration from the Elasticsearch Bulk API. Instead of dealing with a single large JSON object that contains a list of transactions, each transaction is written on its own line in the HTTP request body. Spans are also written on their own line. This is known as newline delimited JSON or simply NDJSON. The request body looks roughly like this:
{"metadata": {"service": {"name": "ecommerce-front"}}}
{"span": {"name": "SELECT FROM products", "duration": 323, "transaction_id": "A"}}
{"span": {"name": "SELECT FROM users", "duration": 202, "transaction_id": "A"}}
{"transaction": {"name": "GET /index", "id": "A"}}
With NDJSON, agents can open an HTTP POST request the APM Server and use chunked encoding to stream events to the APM Server as soon as they are recorded in the agent. This makes it simple for agents to serialize each event to a stream of newline delimited JSON, which is essentially the HTTP POST body. Adding compression is typically as easy as wrapping the stream in a compression library.
In the initial version, when buffering transactions in memory, estimating the memory used can be difficult. With this improved version, agents can, in a simple manner, serialize, compress, and send events as soon as they happen without the need to buffer events in memory. This makes it much simpler to build agents with predictable memory footprints.
In the APM Server, we also treat the HTTP request body as a compressed stream and we can now read each individual event out and deal with it independently. We no longer need to decompress and read the entire JSON object that contains all the data in one go. This gives us much better control over the amount of memory consumed in the server.
Results
To get a clear picture of the memory used by the APM Server to parse and process incoming events, we ran a series of tests.
With the current intake protocol, agents need to make a trade off between buffering more data in memory, or making more HTTP requests to APM Server. Buffering more requires more memory and results in fewer HTTP requests being made, but also creates bigger HTTP payloads.
Currently, memory usage of the APM Server is tightly connected to the size of the HTTP request body as seen in the graph below. As request body sizes increases, so does the memory usage in APM Server, as measured by the maximum resident set size (RSS):
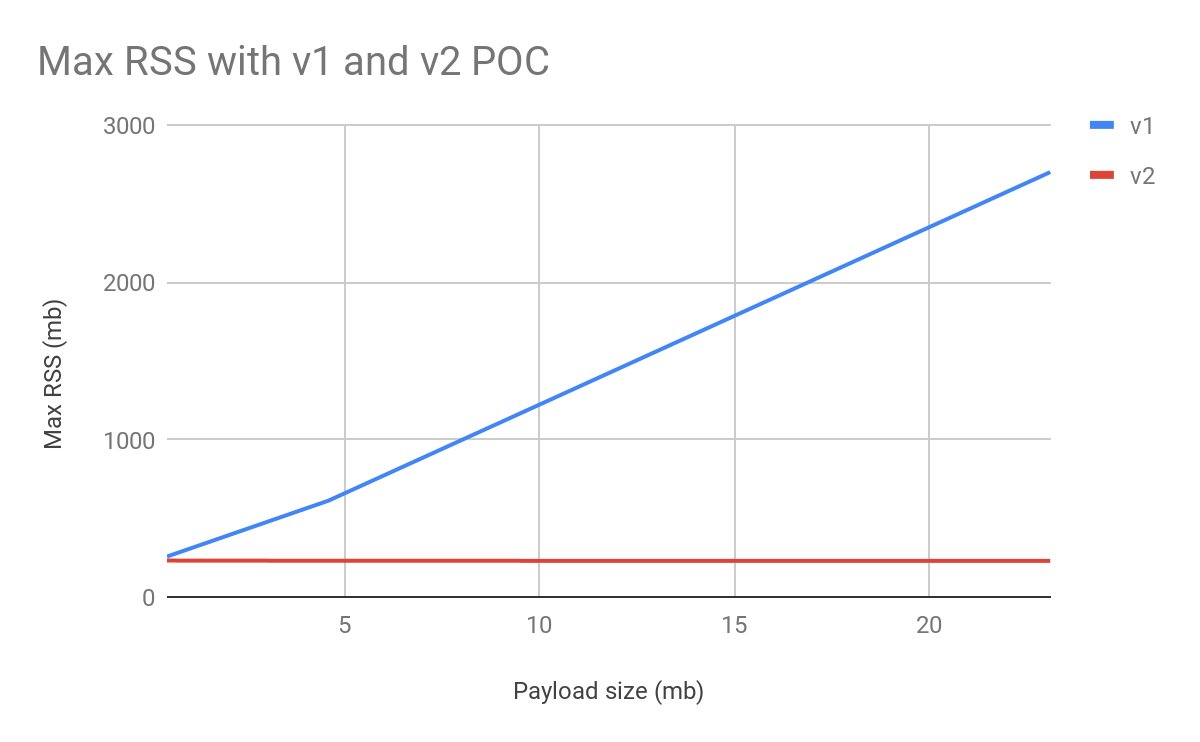
This makes it difficult to anticipate memory usage in APM Server, because request sizes can vary depending on agent settings, number of spans collected per transaction and traffic to the monitored services.
Meanwhile, memory usage when using the improved intake protocol is completely independent of the total size of the request. This is perhaps not surprising, since we’re no longer reading the full request body into memory. Our tests also show that APM Server throughput is not adversely affected by this update.
On the agent side, initial experiments show a 2x throughput improvement for simple transactions. Thus far, it’s clear that running with the default settings agents make significantly fewer HTTP requests, can reuse objects faster, and can (in most cases) simplify buffering code.
These updates have not yet been added to Elastic APM as there are still a number of outstanding issues to work out, but the results so far are encouraging. Keep an eye out for more updates, and if you have any Elastic APM questions, hit us up on the Discuss forum.