Overviewedit
Elastic APM is an application performance monitoring system built on the Elastic Stack. It allows you to monitor software services and applications in real time, collecting detailed performance information on response time for incoming requests, database queries, calls to caches, external HTTP requests, etc. This makes it easier to pinpoint and fix performance problems quickly.
Elastic APM also collects automatically unhandled errors and exceptions. Errors are grouped based primarily on the stacktrace, so you can identify new errors as they appear and keep an eye on how many times specific errors happen.
this guide will indiscriminately use the word service for both services and applications.
APM Componentsedit
Elastic APM consists of four components:
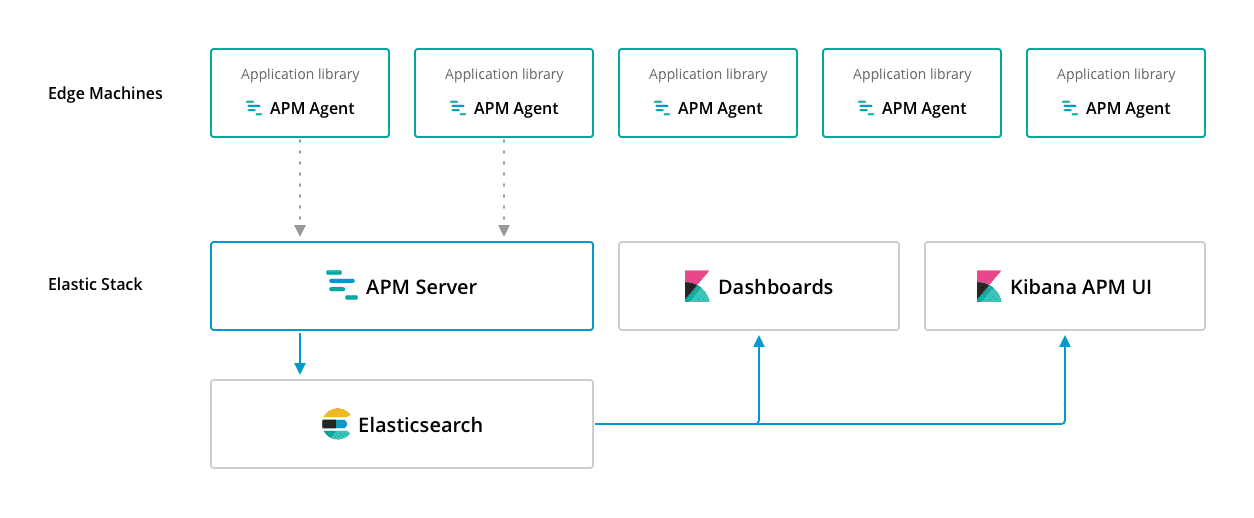
APM agents are open source libraries written in the same language as your service. You install them into your service as you would install any other library. They instrument your code and collect performance data and errors at runtime. This data is buffered for a short period and sent on to APM Server.
Out of the box, APM automatically instruments web frameworks, database drivers, calls to caching servers, and HTTP libraries for requests to external services. Additionally, agents provide an API to manually instrument anything else you find interesting.
APM Server is an open source application written in Go which typically runs on dedicated servers. It listens on port 8200 by default and receives data from agents through a JSON HTTP API. Then it creates documents from that data and stores them in Elasticsearch.
To visualize the data after it’s sent to Elasticsearch, you can use the the dedicated APM UI bundled in X-Pack, or the pre-built open source Kibana dashboards that can be loaded directly via the APM Kibana UI.