Elastic APM 7.4.0 released
We are pleased to announce the release of Elastic APM 7.4.0 — available on the Elasticsearch Service, or as part of the default distribution of Elastic Stack. This release brings exciting new changes to the APM app UI, like structured filters for easier navigation, lots of real user monitoring awesomeness including performance visualization by geo-location, and support for Angular single page applications, along with APM agent updates.
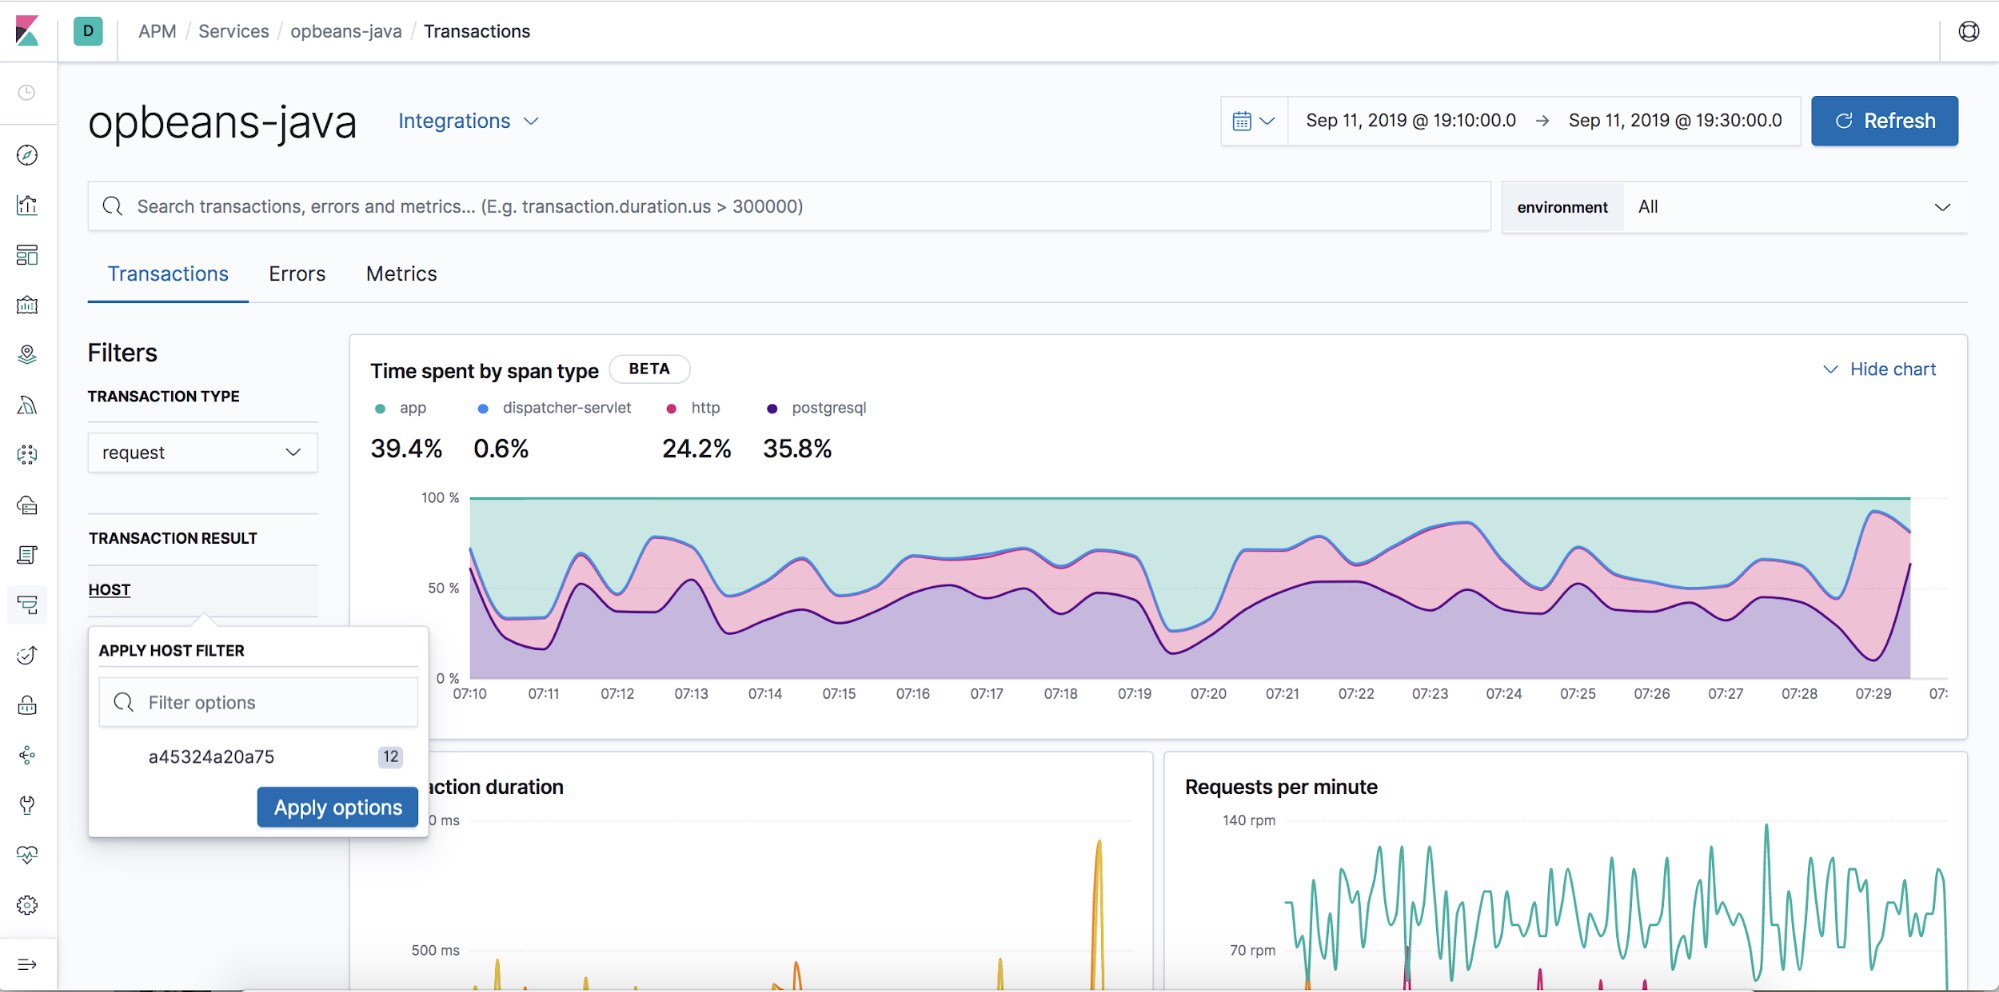
Structured filters
The ability to filter transactions by type, result or host/agent name provide you with an easier and a powerful way to explore your APM data. With the 7.4 release, we have rolled out support for structured filters in the curated APM app UI. This means you can slice and dice your data by quickly selecting the filter options available in the UI.
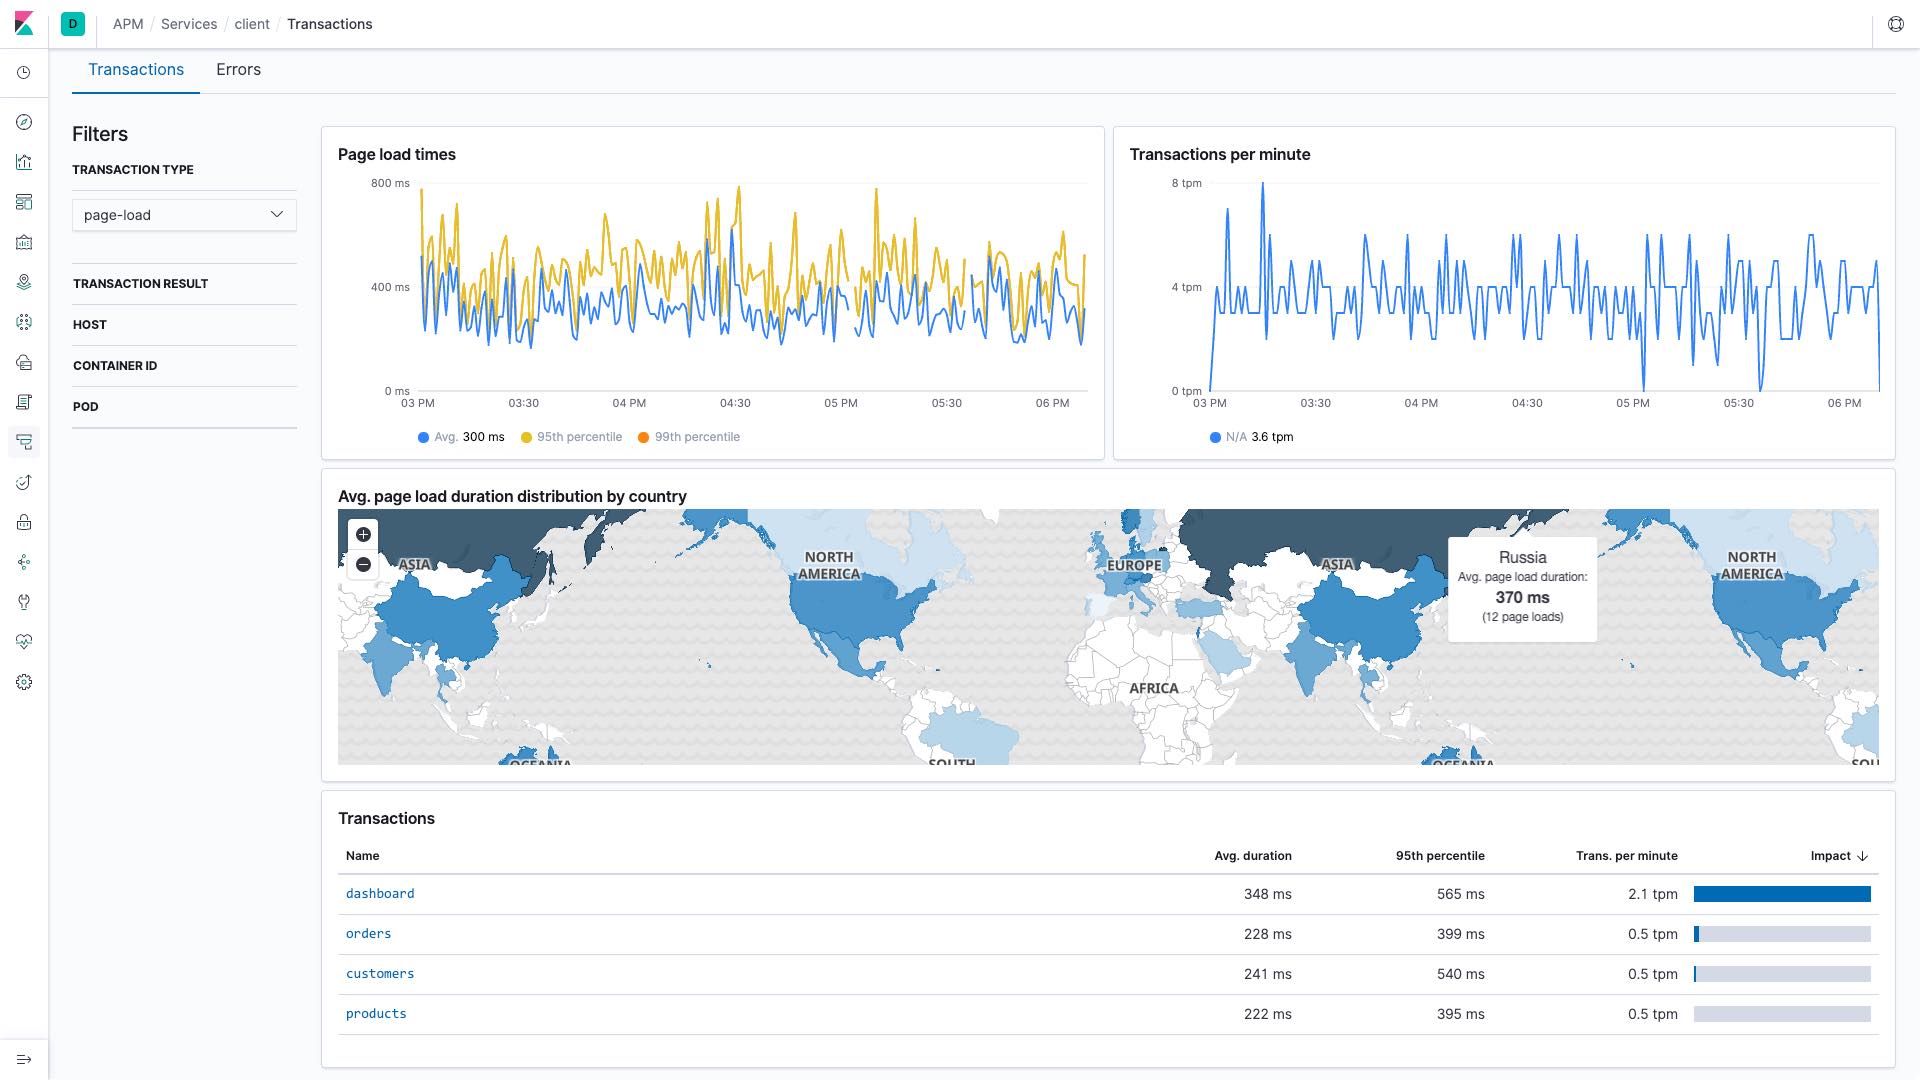
Lots of RUM awesomeness!
In the previous release we had enabled geo-ip and user agent pipelines by default, to capture geolocation and user agent data. With this release we have added a brand new geo-location performance visualization chart to the curated APM app UI. This visualization will make it super easy for you to visualize performance information about your end users' experience based on their geo-location.
We have also further strengthened our support for Single Page Applications (SPA) by adding out of the box Angular instrumentation. This means that you can now use the RUM agent to instrument your SPA written in Angular.js without the need to manually create or rename transactions. Check out the Angular integration doc and instrument your Angular SPA today!
Better APM to Logs integration
An integrated way to navigate between APM and the Logs app is particularly helpful in troubleshooting complex issues. With this release, APM agents now have the ability to log trace-ids thereby enabling you to navigate from the distributed trace to the logs via the APM App UI without losing context. Check out the agent docs for information on logging libraries supported.
Java ECS Logging library
We have also added a Java ECS Logging library as a part of the 7.4 release. With the use of this library, the data logged will be in an ECS-compatible JSON which will allow you to process logs without needing to set up a logstash/ingest node pipeline. In addition, it will allow for automatically logging the field names the Logs app expects, making it easier for you to leverage the log correlation feature available with APM Java agent without the need to do any additional configuration. Once set up, you can easily jump from the Span timeline in Elastic APM to the Logs app, showing only the logs which belong to the corresponding request. Conversely, you can also jump from a log line in the Logs app to the Span Timeline of APM.
.NET agent full framework support
7.4 release brings in out of the box instrumentation for .NET framework. This means that if you have ASP.NET web applications, you will not need to use APIs to create transactions or instrument external calls. Once installed, the agent will be able to auto instrument your application giving you instant visibility into the performance of the application.
Try it out!
You can access the 7.4.0 Elastic APM application on the Elasticsearch Service on Elastic Cloud, or you can download it as part of the default distribution of the Elastic Stack. Grab the APM Server (or leverage the one included with an Elasticsearch Service account), instrument your applications with the APM agents, and start monitoring your applications.