Elasticsearch has native integrations with the industry-leading Gen AI tools and providers. Check out our webinars on going Beyond RAG Basics, or building prod-ready apps with the Elastic vector database.
To build the best search solutions for your use case, start a free cloud trial or try Elastic on your local machine now.
ChatGPT is so hot right now, it broke the internet. As an avid user of ChatGPT and a developer of ChatGPT applications, I am incredibly excited by the possibilities of this technology. What I see happening is that there will be exponential growth of ChatGPT-based solutions, and people are going to need to monitor those solutions.
Since this is a pretty new technology, we wouldn’t want to burden our shiny new code with proprietary technology, would we? No, we would not, and that is why we are going to use OpenTelemetry to monitor our ChatGPT code in this blog. This is particularly relevant for me as I recently created a service to generate meeting notes from Zoom calls. If I am to release this into the wild, how much is it going to cost me and how do I make sure it is available?
Leveraging OpenAI APIs
The OpenAI API is pretty awesome, there is no doubt. It also gives us the information shown below in each response to each API call, which can help us with understanding what we are being charged. By using the token counts, the model, and the pricing that OpenAI has put up on its website, we can calculate the cost. The question is, how do we get this information into our monitoring tools?
OpenTelemetry to the rescue
OpenTelemetry is truly a fantastic piece of work. It has had so much adoption and work committed to it over the years, and it seems to really be getting to the point where we can call it the Linux of Observability. We can use it to record logs, metrics, and traces and get those in a vendor neutral way into our favorite observability tool — in this case, Elastic Observability.
With the latest and greatest otel libraries in Python, we can auto-instrument external calls, and this will help us understand how OpenAI calls are performing. Let's take a sneak peek at our sample Python application, which implements Flask and the ChatGPT API and also has OpenTelemetry. If you want to try this yourself, take a look at the GitHub link at the end of this blog and follow these steps.
Set up Elastic Cloud account (if you already don’t have one)
- Sign up for a two-week free trial at https://cloud.elastic.co/registration.
- Create a deployment.
Once you are logged in, click Add integrations.

Click on APM Integration.

Then scroll down to get the details you need for this blog:

Be sure to set the following Environment variables, replacing the variables with data you get from Elastic as above and OpenAI from here, and then run these export commands on the command line.
And install the following Python libraries:
Here is a look at the code we are using for the example application. In the real world, this would be your own code. All this does is call OpenAI APIs with the following message: “Why is Elastic an amazing observability tool?”
This code should be fairly familiar to anyone who has implemented OpenTelemetry with Python here — there is no specific magic. The magic happens inside the “monitor” code that you can use freely to instrument your own OpenAI applications.
Monkeying around
Inside the monitor.py code, you will see we do something called “Monkey Patching.” Monkey patching is a technique in Python where you dynamically modify the behavior of a class or module at runtime by modifying its attributes or methods. Monkey patching allows you to change the functionality of a class or module without having to modify its source code. It can be useful in situations where you need to modify the behavior of an existing class or module that you don't have control over or cannot modify directly.
What we want to do here is modify the behavior of the “Completion” call so we can steal the response metrics and add them to our OpenTelemetry spans. You can see how we do that below:
By adding all this data to our Span, we can actually send it to our OpenTelemetry OTLP endpoint (in this case it will be Elastic). The benefit of doing this is that you can easily use the data for search or to build dashboards and visualizations. In the final step, we also want to calculate the cost. We do this by implementing the following function, which will calculate the cost of a single request to the OpenAI APIs.
Elastic to the rescue
Once we are capturing all this data, it’s time to have some fun with it in Elastic. In Discover, we can see all the data points we sent over using the OpenTelemetry library:

With these labels in place, it is very easy to build a dashboard. Take a look at this one I built earlier (which is also checked into my GitHub Repository):

We can also see Transactions, Latency of the OpenAI service, and all the spans related to our ChatGPT service calls.


In the transaction view, we can also see how long specific OpenAI calls have taken:

Some requests to OpenAI here have taken over 3 seconds. ChatGPT can be very slow, so it’s important for us to understand how slow this is and if users are becoming frustrated.
Summary
We looked at monitoring ChatGPT with OpenTelemetry with Elastic. ChatGPT is a worldwide phenomenon and it’s going to no doubt grow and grow, and pretty soon everyone will be using it. Because it can be slow to get responses out, it is critical that people are able to understand the performance of any code that is using this service.
There is also the issue of cost, since it’s incredibly important to understand if this service is eating into your margins and if what you are asking for is profitable for your business. With the current economic environment, we have to keep an eye on profitability.
Take a look at the code for this solution here. And please feel free to use the “monitor” library to instrument your own OpenAI code.
Interested in learning more about Elastic Observability? Check out the following resources:
- An Introduction to Elastic Observability
- Observability Fundamentals Training
- Watch an Elastic Observability demo
- Observability Predictions and Trends for 2023
And sign up for our Elastic Observability Trends Webinar featuring AWS and Forrester, not to be missed!
In this blog post, we may have used third party generative AI tools, which are owned and operated by their respective owners. Elastic does not have any control over the third party tools and we have no responsibility or liability for their content, operation or use, nor for any loss or damage that may arise from your use of such tools. Please exercise caution when using AI tools with personal, sensitive or confidential information. Any data you submit may be used for AI training or other purposes. There is no guarantee that information you provide will be kept secure or confidential. You should familiarize yourself with the privacy practices and terms of use of any generative AI tools prior to use.
Elastic, Elasticsearch and associated marks are trademarks, logos or registered trademarks of Elasticsearch N.V. in the United States and other countries. All other company and product names are trademarks, logos or registered trademarks of their respective owners.
Frequently Asked Questions
How do you monitor OpenAI API?
You can monitor OpenAI API using OpenTelemetry and Elastic. Learn more about the process in this guide.
Related Content
July 7, 2026
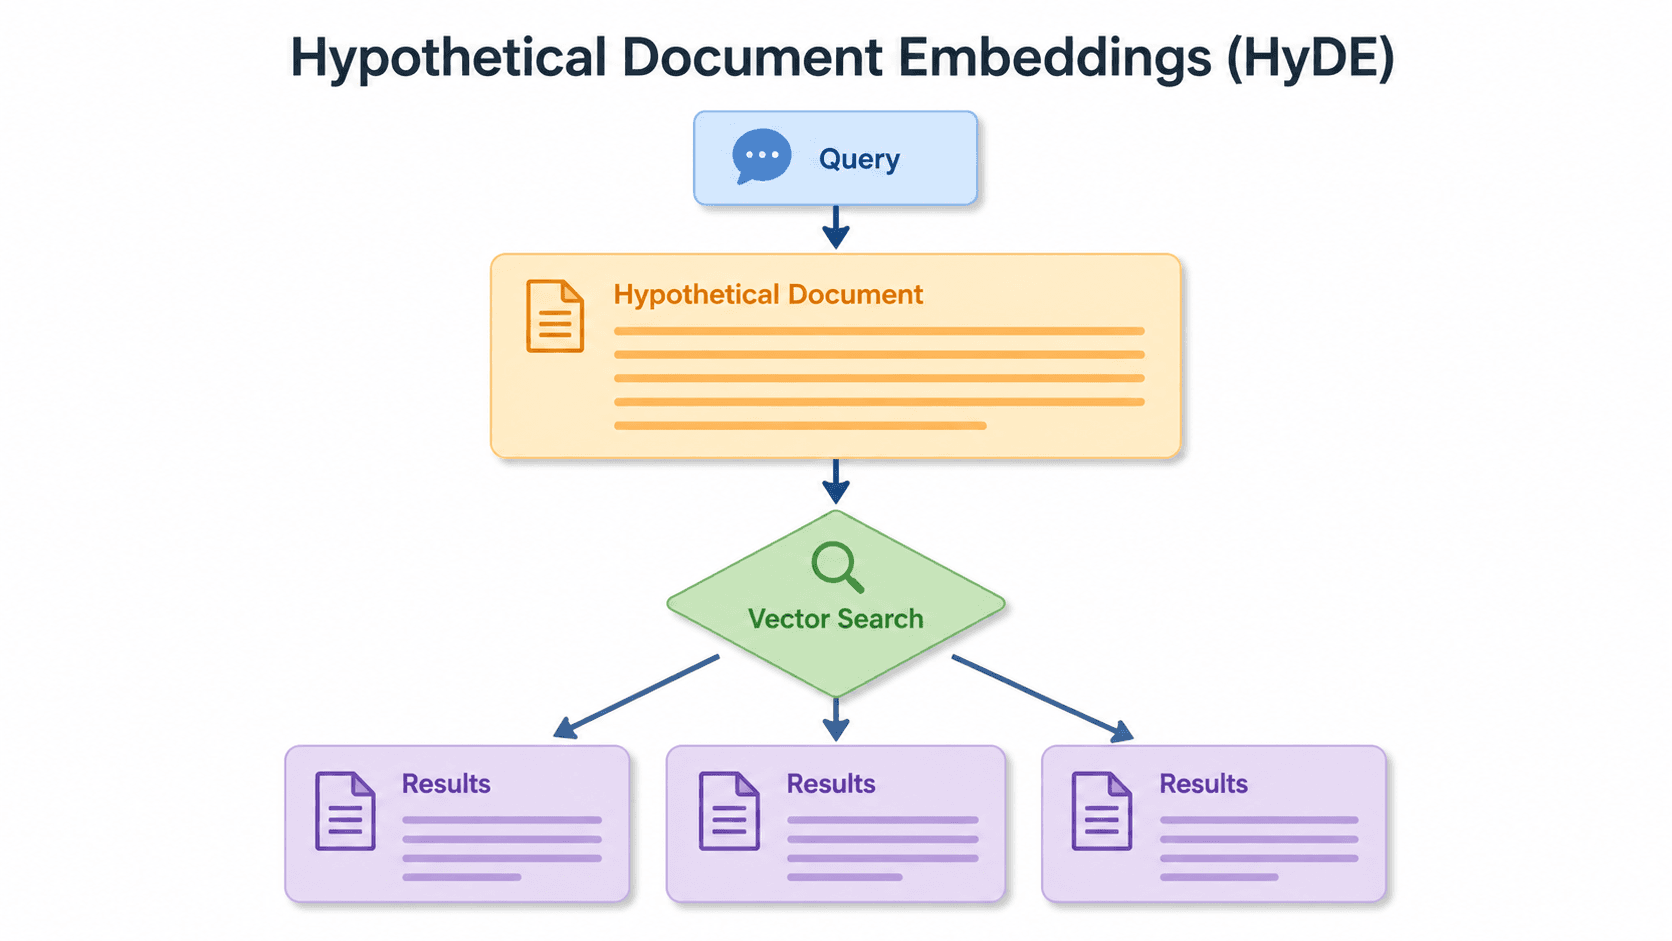
Short queries, formal documents: how HyDE improved semantic search precision by 50% in Elasticsearch
HyDE boosts semantic search precision and recall by 50% on short queries. Here's how to implement it in Elasticsearch with the Inference API and semantic_text.
June 24, 2026
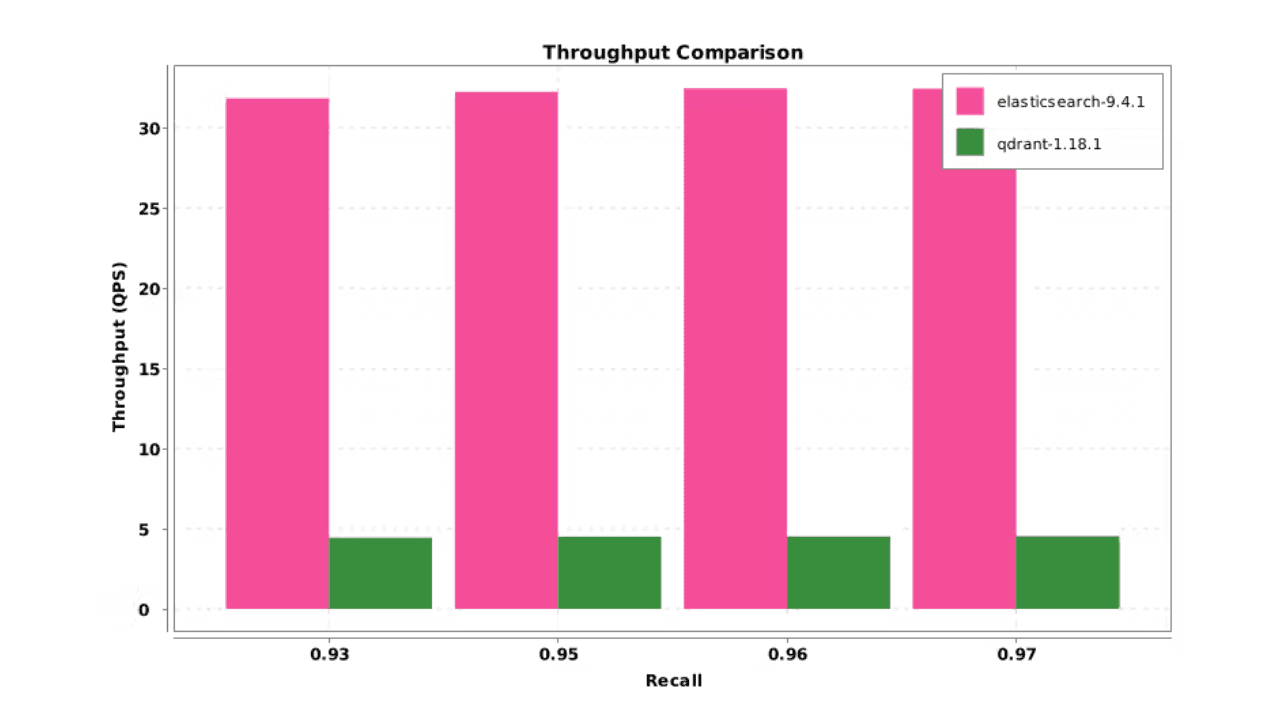
Elasticsearch DiskBBQ delivers 7x faster vector search than Qdrant on network-attached storage
Elasticsearch DiskBBQ achieves up to 7x higher vector search throughput than Qdrant at comparable recall on network-attached storage. Explore the benchmark methodology and full results.
July 6, 2026
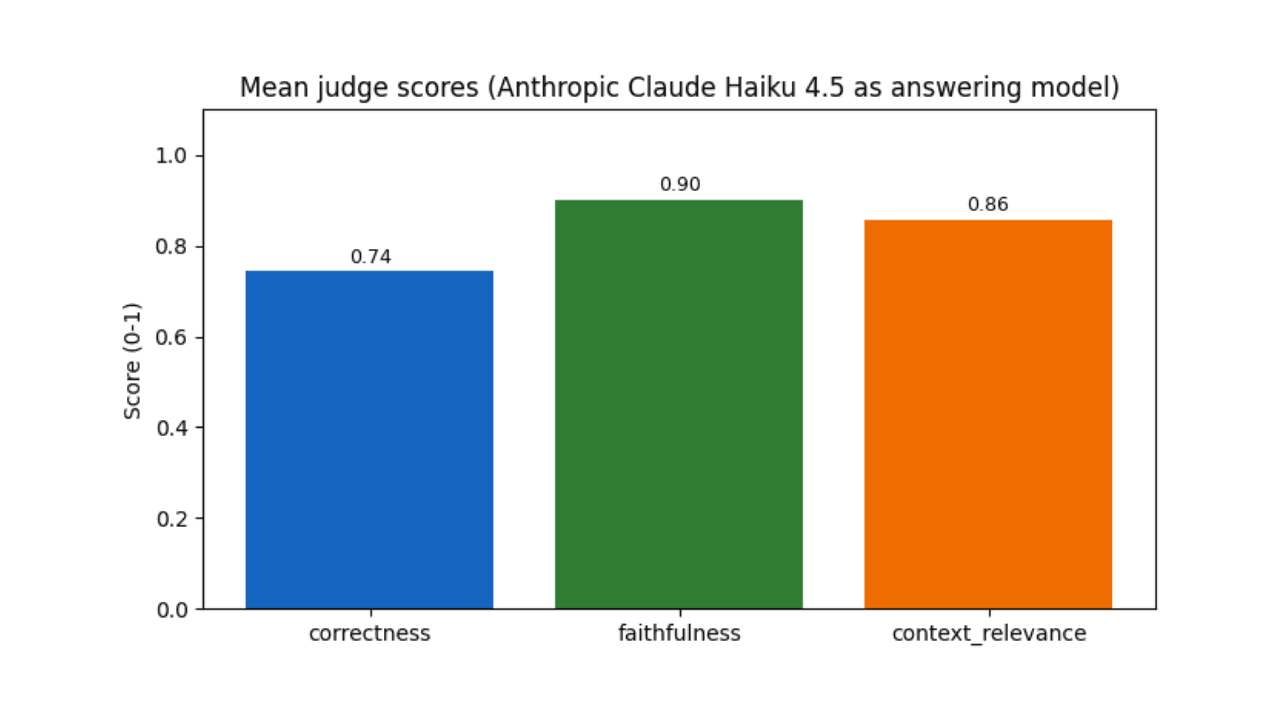
Who grades the grader? LLM-as-a-Judge inside Elasticsearch Workflows
Find out if your RAG agent is ready to ship. Score it on correctness, faithfulness and retrieval quality using only Elasticsearch Workflows and two Claude models.

June 15, 2026
Your search index is already an agent memory system: Persistent agent memory for Claude Code with Elasticsearch
Give your AI agent persistent cross-session memory using Elasticsearch: Hybrid recall, a knowledge graph, and cross-device handoffs. Three commands to install.

June 15, 2026
Your FAQ bot doesn't need a PhD: LLM query routing with Elastic Workflows
Route LLM queries by complexity using Elasticsearch search metadata: Mistral Small for FAQ questions, Claude Sonnet for multi-source synthesis.