Elastic Logs 7.8.0 released
We are pleased to announce the release of Elastic Logs 7.8.0 — available on Elasticsearch Service, or when you download the Elastic Stack. This release brings you quick and easy alerting, the ability to view contextual logs, and filtering for datasets during machine learning job configuration.
Viewing logs in context
A frequent use case in log exploration is filtering logs with terms that carry context from outside of logs, such as API route, customer ID, or error text from a triggered alert. Once the logs are filtered and an interesting log line is identified, the next step is to learn what happened before and after this log line. That’s exactly what we are solving for with this feature. Keep in mind that simply launching another logs view with the filter term removed will fetch logs from every other log data source, assuming you have a centralized logging system. The real context you are looking for is what happened before and after that log line within that single log data source.
For example, imagine you are running containerized applications on a Kubernetes cluster. You filter the logs for the term “error,” and you find an interesting error log line. The context you are looking for is what happened before and after this error line within the logs of this specific container and application. So this context is preserved when you click on “view in context” to help you find the root cause as soon as possible.
This feature is free in the Elastic Stack for everyone. Please use it and let us know your feedback in our forums.
Alerting-based log patterns
We are very happy to announce that we are supporting threshold-based alerting in the Logs app. Alerts for all observability products can be created and managed from a central place in Kibana. However, from a usability perspective, we created a smoother experience by allowing you to create alerts right in the Logs app:
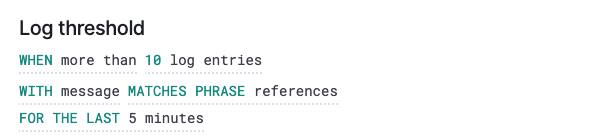
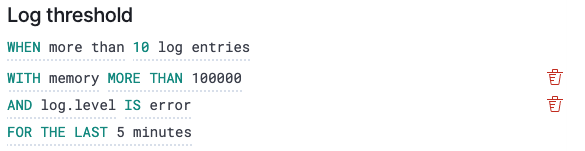
We support several key alerting use cases as shown below.
Alerts based on fields containing or matching a text pattern:
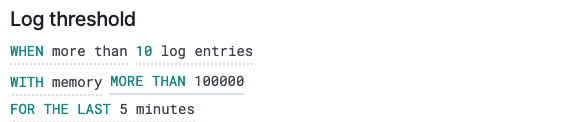
Alerts based on numeric field and arithmetic operator:
Single alert with multiple conditions:
Alert connectors
We support many common enterprise connectors as built-in integrations shown below, as well as document indexing and Kibana server logging.
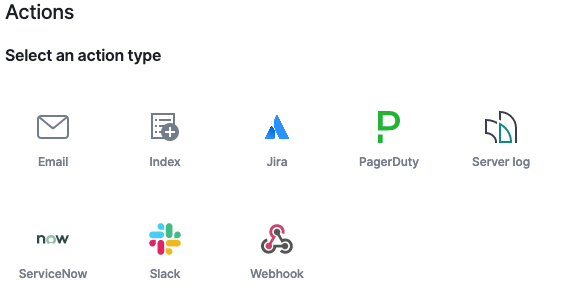
And, of course, you can connect and notify any other system with the use of webhooks.
Did we mention that it’s free? That’s right — the new alerting for logs is free for everyone to use, including the server log and index notification actions! So give it a try: download the latest version of the Elastic Stack or use it on Elastic Cloud and let us know what you think! Ask a question or leave feedback in our forums.
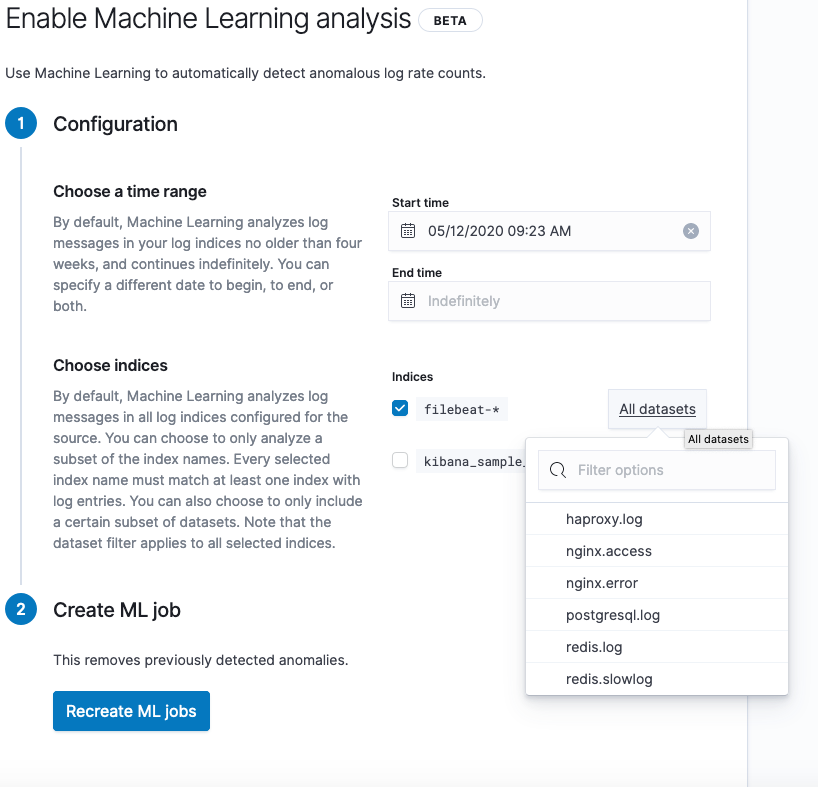
Allowing users to filter datasets in machine learning job configuration
Now we are extending the machine learning job configuration to allow you to filter datasets. This helps to have granular control over machine learning jobs, which is useful when you are trying to reserve machine learning capacity on the datasets that matter the most as well as filter out datasets not suitable for categorization.
See it in action!
You can access the latest version of the Elastic Logs app on Elasticsearch Service on Elastic Cloud by creating a new cluster, upgrading an existing cluster the day of release, or by downloading the Elastic Stack.