Reduce storage for metrics by 70% and simplified vector search all in 8.7

 Share on Twitter
Share on Twitter

 Share on LinkedIn
Share on LinkedIn

 Share on Facebook
Share on Facebook

 Share by Email
Share by Email

 Print this page
Print
Today, we are pleased to announce the general availability of Elasticsearch 8.7. Elasticsearch 8.7 significantly reduces the storage of metric data for time series use cases (time series database) and introduces a single one-step API to greatly simplify vector search to implement semantic search on text data. Also, we’ve made performance improvements and added monitoring capabilities for ingest pipelines and continued functionality within geo-spatial data.
Looking for 8.7 updates on Kibana and Elastic Cloud? Head over to this blog.
Elastic Stack 8.7 is available on Elastic Cloud — the only hosted Elasticsearch offering to include all of the new features in this latest release. You can also download the Elastic Stack and our cloud orchestration products, Elastic Cloud Enterprise and Elastic Cloud for Kubernetes, for a self-managed experience.
What else is new in Elastic 8.7? Check out the 8.7 announcement post to learn more >>
Efficient storage of metrics with TSDB, now generally available
Data is growing at an exponential rate, along with the cost to store it. Most organizations need to make a difficult decision about what data to keep or delete to stay under budget. Elastic is announcing several features that are generally available to help greatly improve storage efficiency for metric data:
- Downsampling reduces the footprint of time series by storing them at lower granularity, giving you greater control in deciding how much historical metric data can be stored within your budget. And since downsampling “just works” in Kibana with 8.7, it also speeds up visualizations using Lens, Timelion, or TSVB on large data sets.
- Time series data streams (TSDS) leverage specific organization of time series data (e.g., by timestamp and dimension fields) to sort and store metric data more efficiently — 30% less disk space in our benchmarks!
- Synthetic source reduces storage space by not saving the original document data in _source, and instead reconstructing it from doc_values when needed. We observed space saving of 40%, depending on index configuration.
At Elastic, we love our community. It builds social connections and a network for people who want to help build great software and provide guidance to others. One of our community contributors, Wei Zijun, contributed to more than 40 PRs and was deeply involved in improving the performance of TSDB features. Without him and many other community members, Elastic wouldn’t be what it is today. Thank you Wei Zijun, and thank you to our great community members!
Simplifying vector search and production ready NLP
Elastic is focused on delivering vector search and natural language processing (NLP) for quite some time and it shows in the maturity of these capabilities. With 8.7, implementing semantic search becomes as easy as passing the text query and embedding model in a query_vector_builder clause to the familiar knn endpoint. Also, you can perform HNSW based KNN vector search over multiple vector fields. For example, if you have images and textual descriptions, vector search can now draw on both these sources. Finally, the support for “transformer” NLP models that we initially released with 8.0 is now generally available.
Semantic search with streamlined text embeddings
For vector search specifically, we are getting the text embedding inference step out of your way. Just determine the trained model that you want to use with your vector search or hybrid query, and the text embedding step happens transparently under the hood.
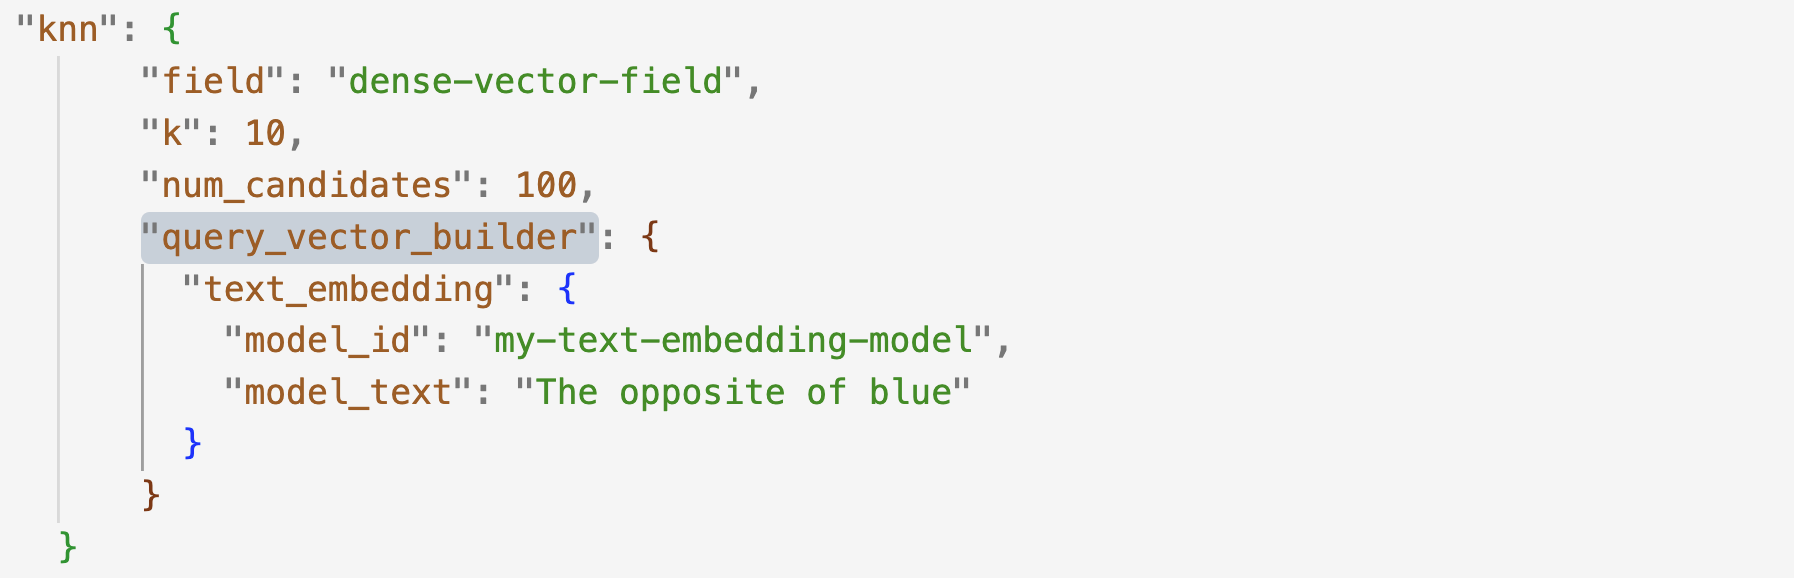
Note that while the text embedding inference through the ingest processor or the direct _infer call is now GA, the text embedding query vector builder remains in technical preview.
Searching multiple vector fields
Sometimes you want to perform relevance ranking based on multiple vector fields. Perhaps that’s because you have one vector representing an image and another representing the text describing that image, or you may simply have multiple textual fields for every document and have created an embedding vector for each of them. In Elasticsearch 8.7, we introduce the ability to perform HNSW based KNN vector search over multiple vector fields. The overall relevance is obtained by setting a boost for each of the vector fields.
Elastic NLP is GA
In 8.7, the NLP capabilities of the Elastic product become GA. You can deploy and manage your trained NLP models in order to perform an array of tasks, such as text classification (including zero-shot), question answering, named entity recognition, and more. The machine learning product supports some of the most powerful state-of-the-art transformer architectures. Transformers allow you to run your most performant models with your workflows and data in Elastic, at the scale and speed that Elastic offers.
The Trained Models UI and the corresponding machine learning APIs streamline the deployment and management of your NLP models in one place within the Elastic product. In addition, you can easily test your models by using indices or simply entering your test text in the UI. The Eland client provides the Python tooling that serializes and optimizes your trained models for deployment within Elastic.
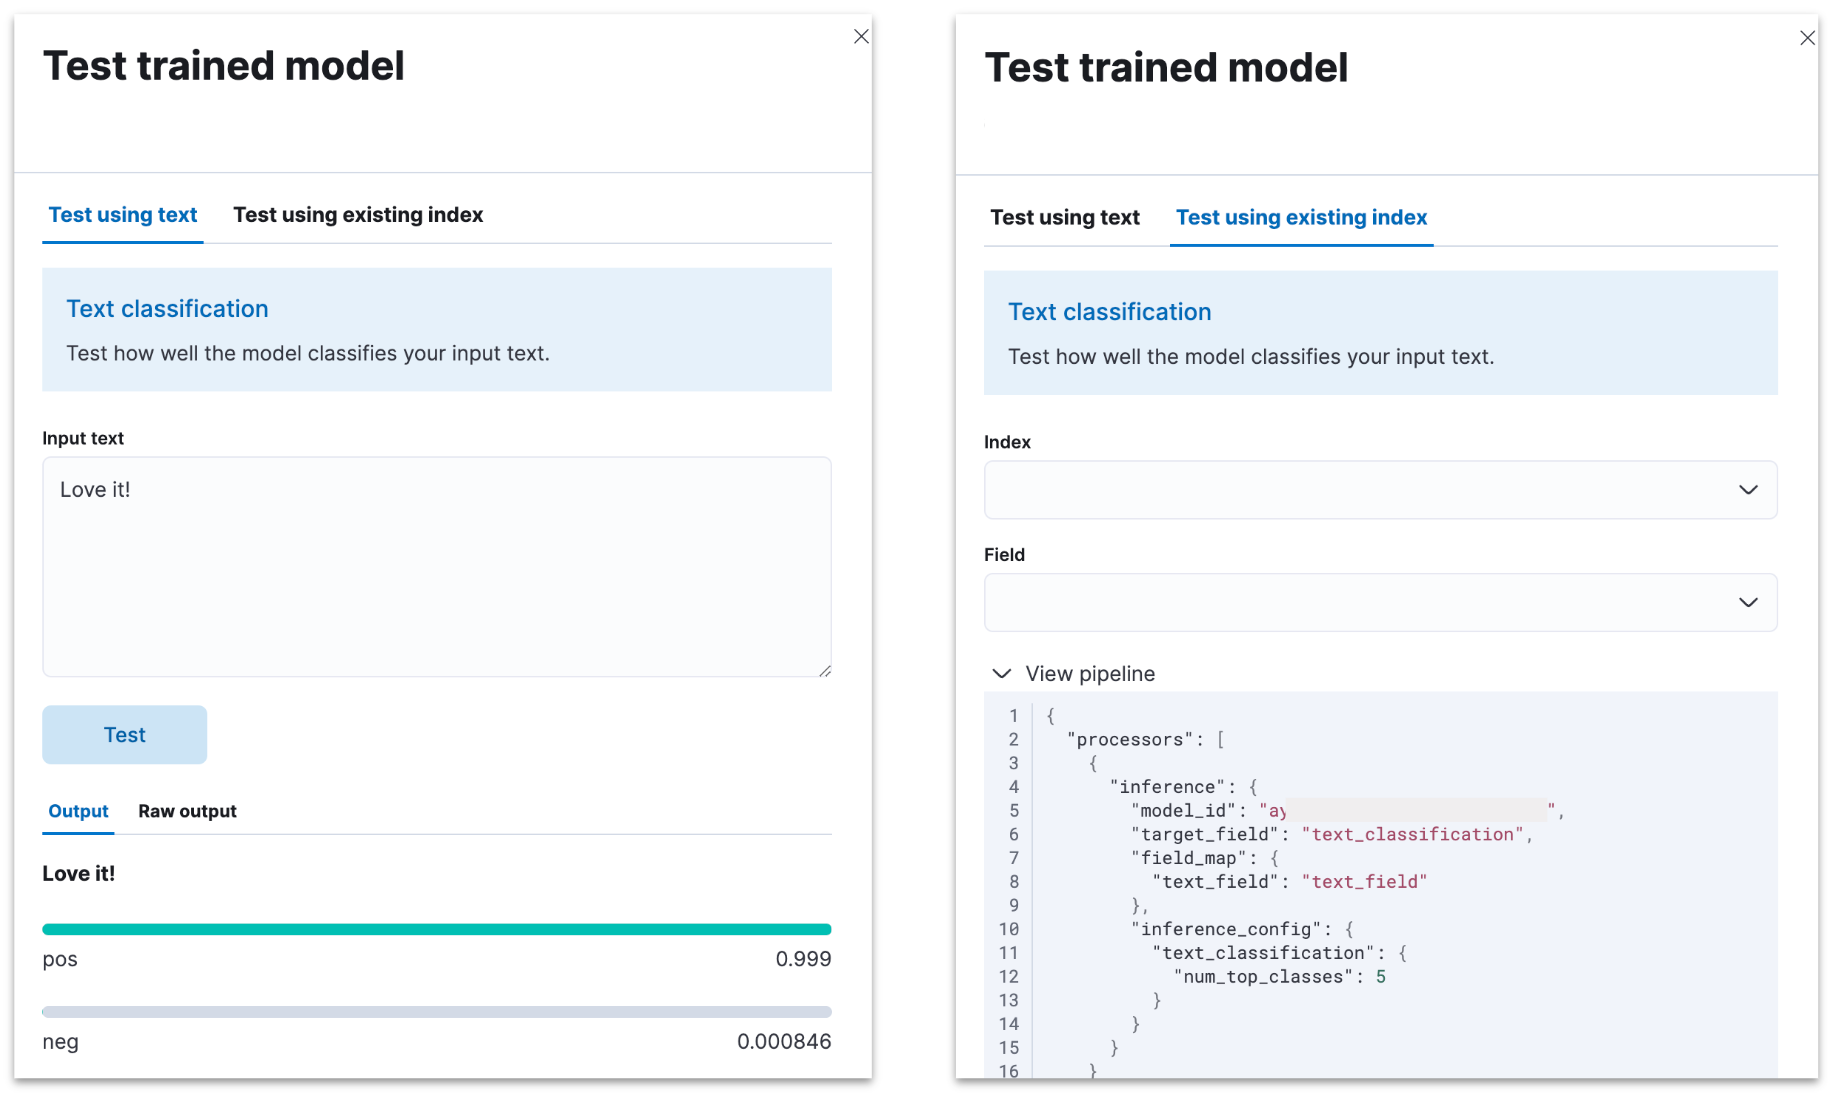
Of course inference goes well beyond the UI — you can use your NLP model in ingest pipelines. To do so, just add an inference processor that leverages your trained model of choice for your NLP task.
Geohex_grid aggregation on geo_shapes
Elasticsearch has supported geohex_grid for display and analysis of geo_points on the H3 tiling grid since 8.1. This hex tiling method has become increasingly popular among Elastic users, since it provides many advantages, like similar distance between the centers of all neighboring tiles and similar border length between a tile and all its neighbors (both in comparison to rectangle tiles). Users also report they find the hex tiles more visually appealing than the rectangle tiles alternative. With that in mind, we now added support for geo_shapes. To read more on our work with geohex, be sure to check out the following blog.
Geo-grid processor
We have added an ingest processor that accepts the definition of a geo-tile (in z/x/y format) and outputs the geo_shape that aligns with that tile. It is useful to index that geo_shape that aligns with the tile in order to later interact with the tile after the document is indexed. The geo_grid processor supports both hex and rectangle tiles.
Ingest pipeline performance improvements and features
Ingest pipelines up to 45% faster
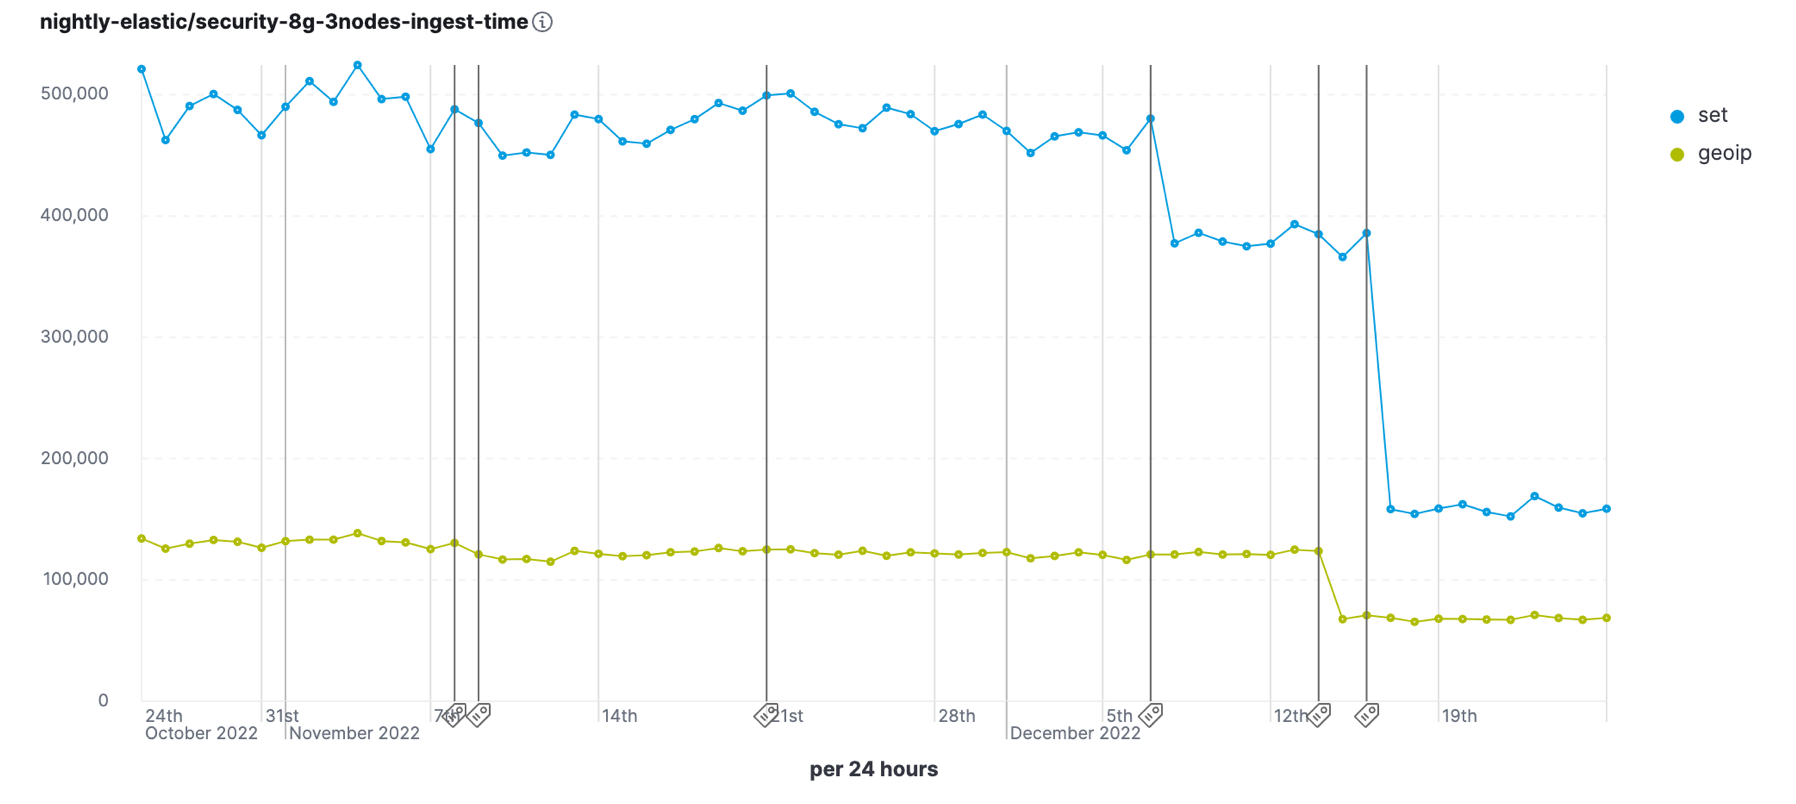
Need to ingest a lot of data using our ingest pipelines and integrations? We made ingest processing much more efficient in 8.7, speeding up overall execution for any ingest pipeline, as well as optimizing specific processors like Date, Set, Append, and GeoIP.
Comparing performance from 8.6.0 versus all the improvements in 8.7.0, we’re seeing 45% better ingest performance for the Security benchmark and 35% better ingest performance for the Logging benchmark. Now your data nodes can have more resources available for indexing and search, while keeping your ingest processing centrally scalable in Elasticsearch to avoid processing at the edge or deploying additional tools.
Ingest statistics are included in the node stats API output. While working on the performance improvements, we discovered that in some circumstances Elasticsearch node stats would display a misleading processor name for the reported ingest stats — that has been fixed. The result is greatly improved clarity and consistency for the names and types that we report for ingest stats. This comes in handy for the next new feature…
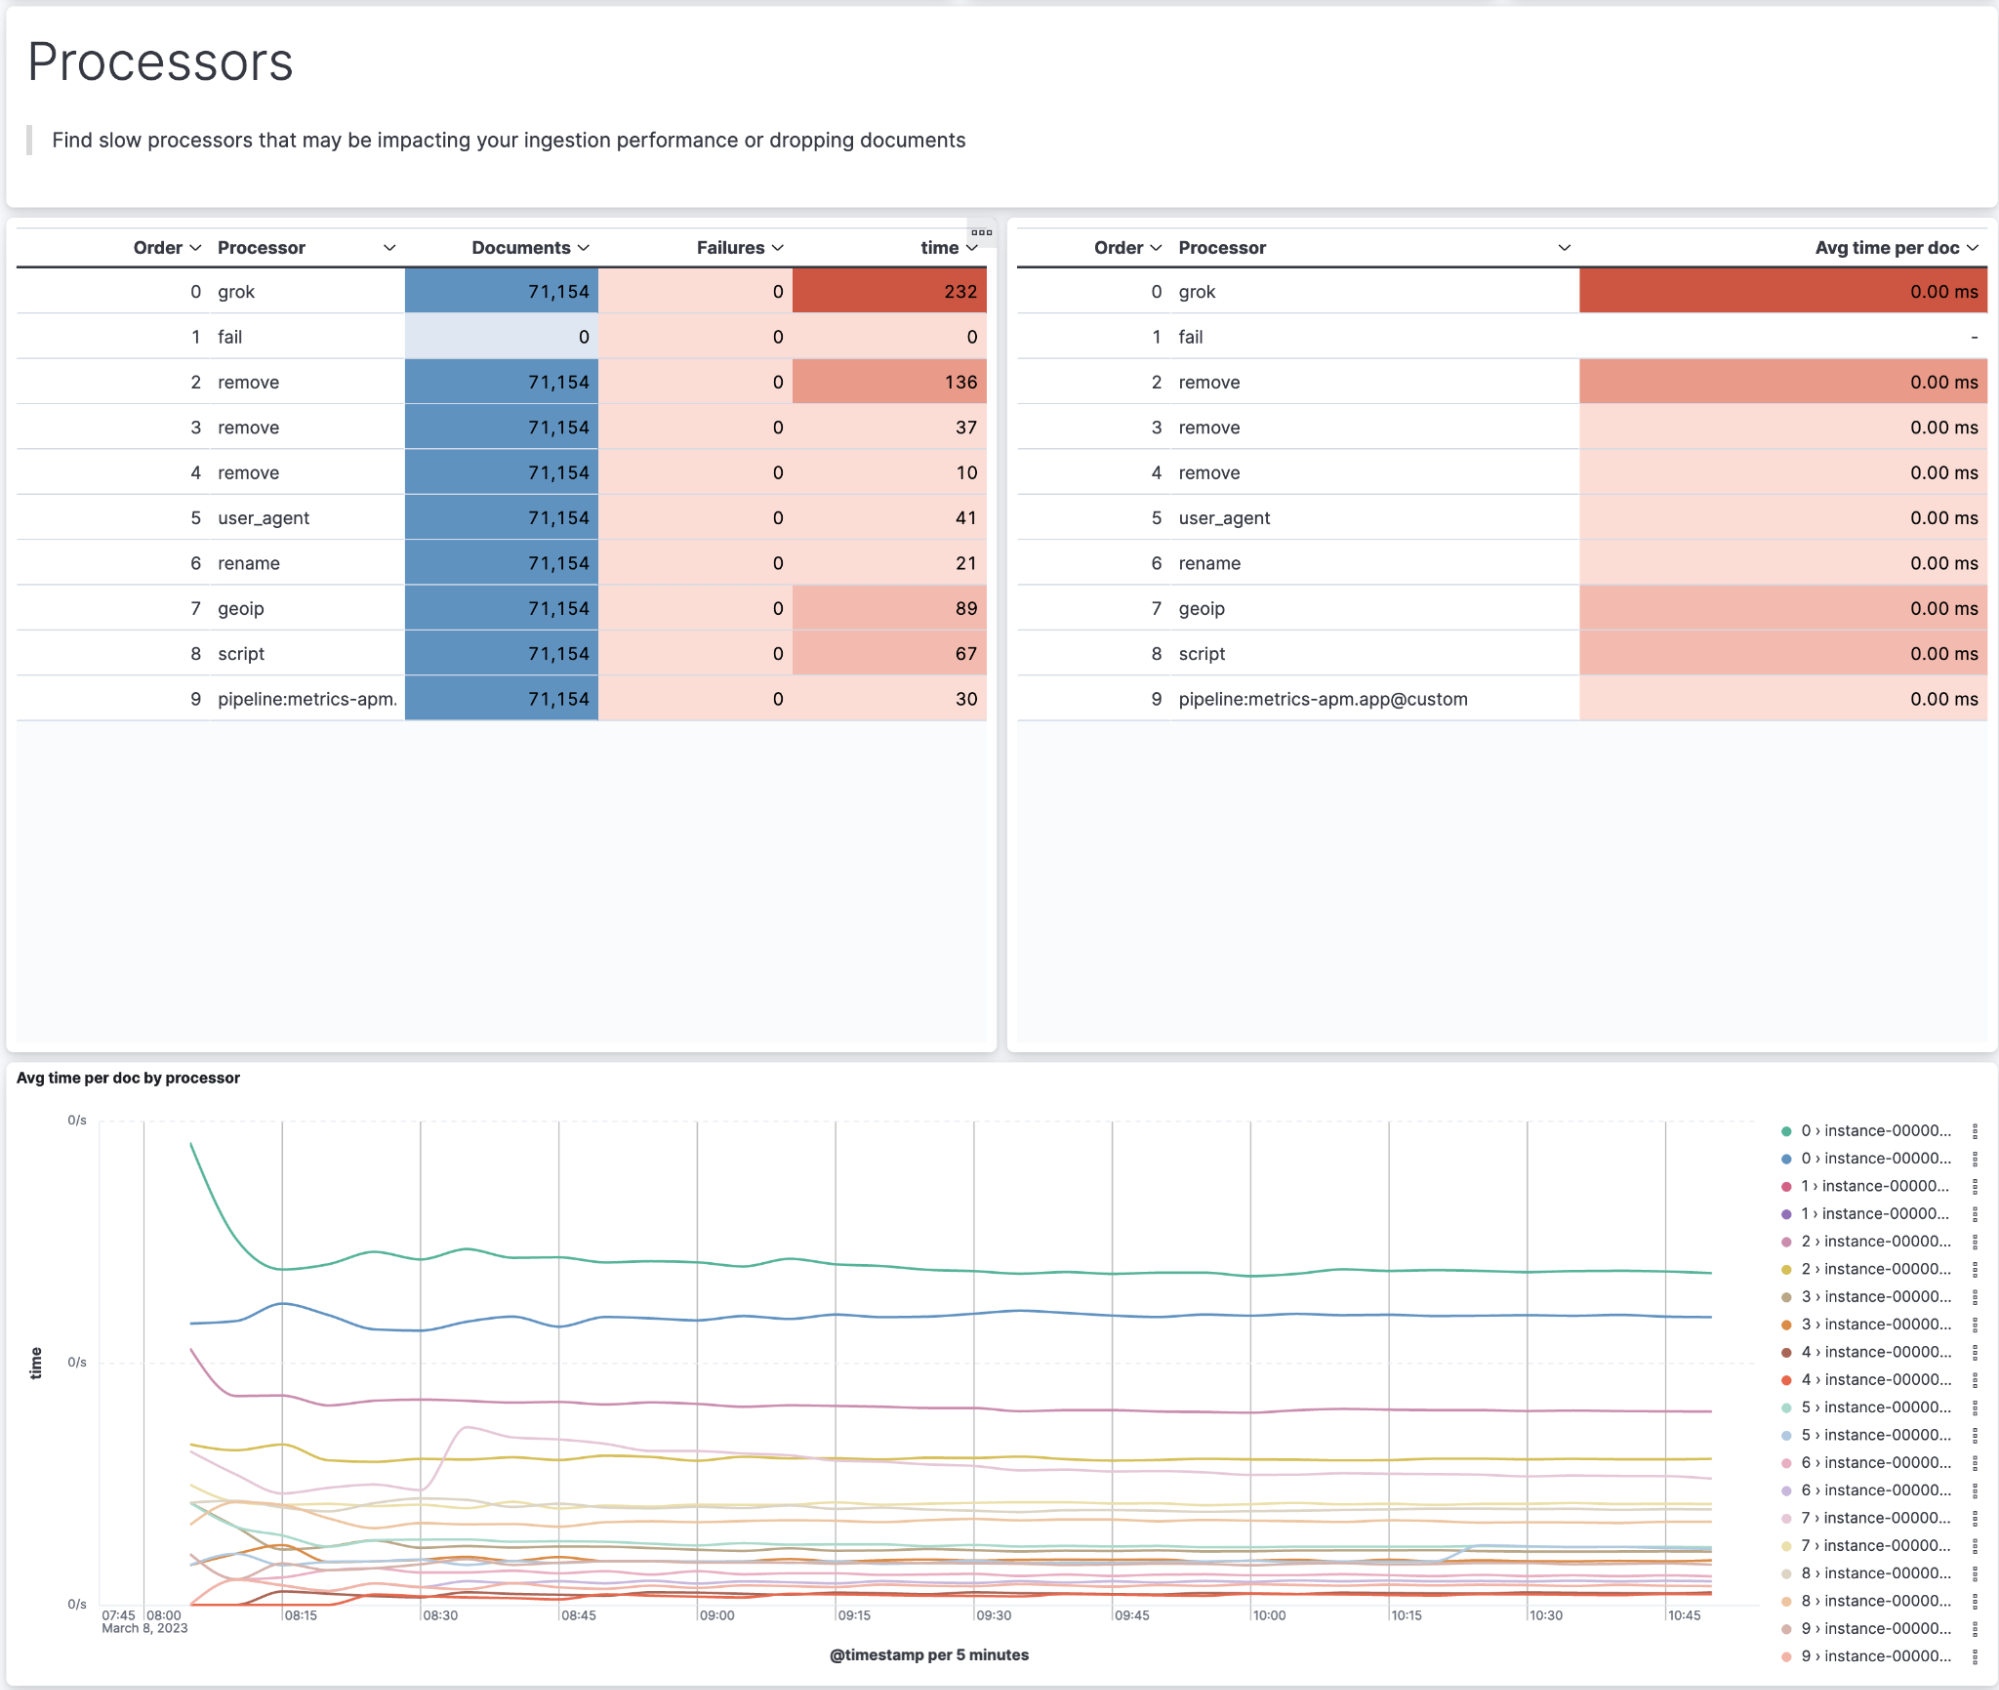
Ingest pipeline monitoring dashboards
Inspecting ingest statistics using the node stats API has long been possible, but we were missing a convenient way to monitor your ingest pipelines visually. How many documents per second is each pipeline processing? How long is each processor taking? Are many events failing in a pipeline, and at which processor? Which pipelines are consuming resources on each node?
Elastic 8.7 adds prebuilt dashboards of ingest pipeline metrics, so you can easily observe and inspect how your ingest pipelines are performing.
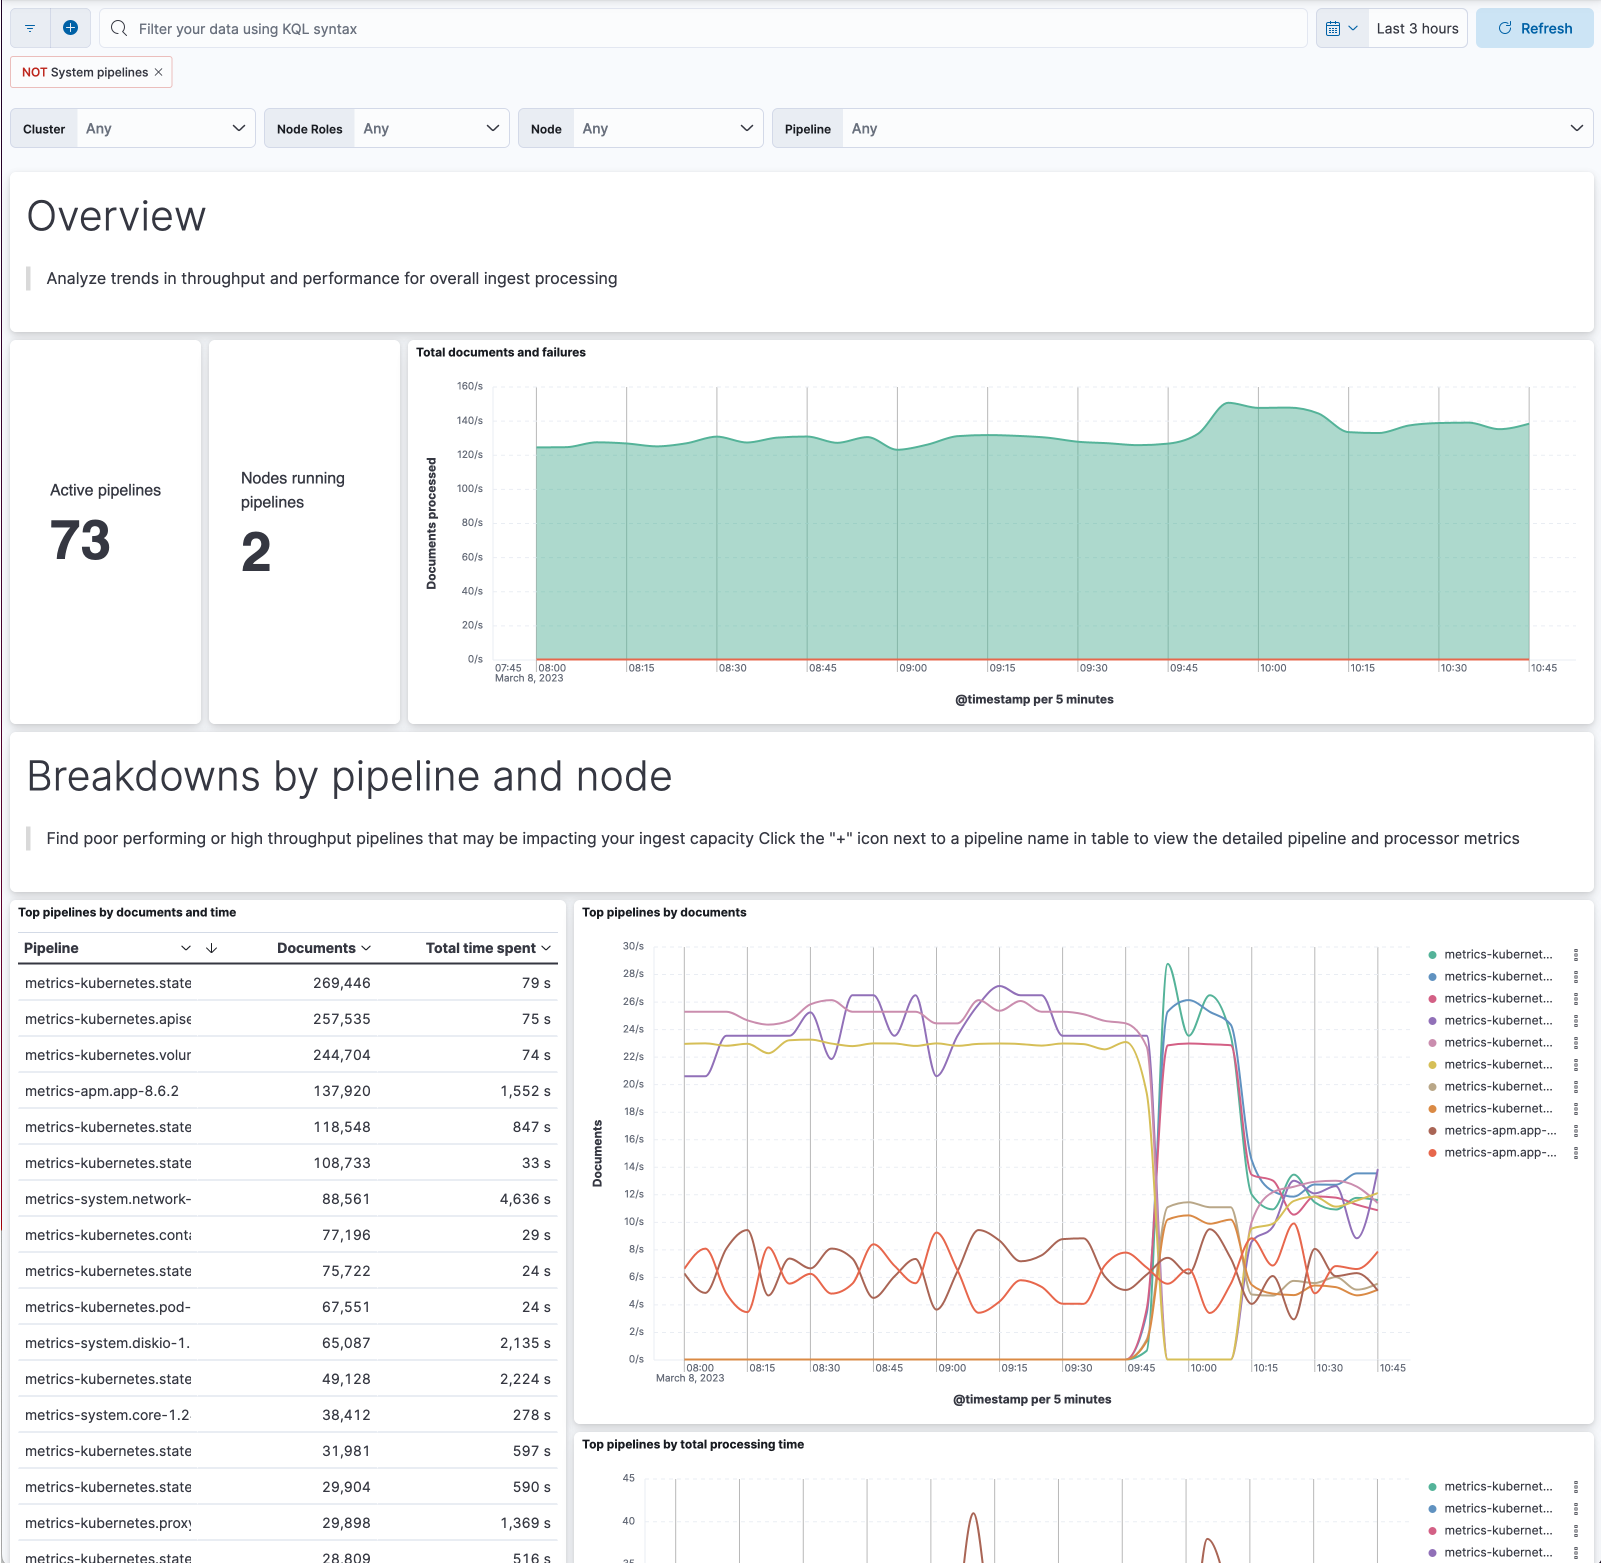
This dashboard is implemented as a new metricset within the Elasticsearch integration package. You can get to the dashboards from a link in the Stack Monitoring UI. If you don’t have the Elasticsearch package installed, you’ll be prompted to install it. It’s even easier for Elastic Cloud users, who just need to enable metrics in the Cloud UI. This feature is in beta in 8.7.
Health reporting API is now GA
Your Elasticsearch deployments are important to you and your users. Maybe they’re at the heart of your ecommerce store, they provide observability for your mission-critical services, or they help you defend against cyber attacks. You need to know if they are healthy, and if not, why not?
The new Health API is the place to go. This API is used by the Cloud Health UI for Elastic Cloud deployments to indicate the overall health (green, red, or yellow) and populate the impact and recommended actions. It is also available to poll directly for your own monitoring and troubleshooting needs on Cloud or self-managed clusters, in a simple and actionable way. Available as an experimental feature since 8.3, the Health API is now generally available. (Note: the endpoint changed from /_internal/_health to /_health_report).
You might be familiar with the existing cluster health API (/_cluster/health). That is only considering index health status (shards allocated or not), whereas the new Health API looks at multiple facets of cluster health: Is the master election stable? Are there issues with ILM or Snapshots? Do we have enough disk space? It also reports on the index status, making it a fine replacement for the cluster health API. To learn much more, with examples, check out our blog on the new Health API.
Try it out
Read about these capabilities and more in the release notes.
Existing Elastic Cloud customers can access many of these features directly from the Elastic Cloud console. Not taking advantage of Elastic on cloud? Start a free trial.
The release and timing of any features or functionality described in this post remain at Elastic's sole discretion. Any features or functionality not currently available may not be delivered on time or at all.
Share
- Share on Twitter
Share on Twitter
- Share on LinkedIn
Share on LinkedIn
- Share on Facebook
Share on Facebook
- Share by Email
Share by Email
- Print this page
Print