PSD2: Monitoring Modern Banking API Architectures with the Elastic Stack, Part II
At Elastic, we :heart: APIs because developers love to work with them to get things done. APIs also have the power to change (or disrupt) an industry quickly and decisively, as is the case with The Revised Payment Service Directive (PSD2). APIs make it possible to seemlessly switch from Web browsers to apps, to deploy content to any platform, and to find the best deals among thousands of suppliers. PSD2 sets out to standardize APIs between EU banks and abolish the existing lock-ins that still exist in the industry. Because while financial institutions are closer to the forefront of the innovation curve than almost any other industry, the point can be made that this has not resulted in wide-spread open access to the core banking ecosystems - namely accounts and transactions. PSD2 is a directive from the European Union that will make banks open up access to their, otherwise private, core banking functions in ways that we have not seen before. PSD2 legislation introduces a breadth of opportunity for retail banks, while also introducing new risk. The Elastic Stack plays a vital role in many of the world’s banks today, and that will especially be true for PSD2 architectures.
This is Part II of a series on PSD2 in which we will focus on creating “observability” in a public API architecture, that is to say at all times knowing the status of the business service, its anomalies that require attention and all historical raw data around individual users and requests. Part I focuses on using the Elastic Stack for running next-generation retail banking APIs and also gives a general introduction of PSD2 regulation and strategic options for EU retail banks.
- Observability
- “Seeing” all that is happening in a complex architecture. Three distinct but related types of data emerged: Logs, Traces, and Metrics.
- Logs
- Records of discrete events. Often a combination of text and numerical data. Examples: an API request, a transaction error.
- Traces
- Information related to a specific request. Examples: database queries related to a request, or a stack trace of a microservice. Traces look a lot like Logs, but are more verbose and specific to a single action. For simplicity, we will group Traces and Logs together in this article.
- Metrics
- Records of observations on a timeline interval. Aggregatable into higher-level KPIs and usually numerical. Examples: CPU usage, number of transactions.
A Shopping List
At Elastic we get to see many customers running production, value-add installations, the successful deployments provide the business with a platform to leverage for insight. The commonality that can be extracted from these installations include but are not limited to:
- Security and Privacy: This includes corporate and legislative requirements around audit logging, privacy, multi-tenancy, encryption at e and data separation. Running public APIs that give access to funds and transaction histories will be a prima target for bad actors.
- Monitoring and Alerting: The ability to know current and historical status of the service, and be informed of any serious deviations from what is considered normal. We expect SLAs to apply to these services that will demand intelligent monitoring of the whole architecture. Correlation of metrics and logs is vital to quickly understand what actions to take.
- Quality of Service: The ability to throttle in case of overloads, to protect itself from DDoS attacks and to allow the enforcement of Fair Use policies on the public APIs.
- Easy, far-reaching scalability: Scaling the platforms should be simple and painless.
- Real-time answers: Answer calls fast to support the needs and expectations of users, throughout the solution.
- Self-learning and self-service: Getting useful intelligence out of the data without having to foresee and manages what exactly is relevant (because who would know beforehand how security breaches or outages might unfold?) requires abilities to find anomalies, create advanced dashboards, and a raw data store. It also requires tooling that enables non-techies to get what they need through self-service BI.
The Elastic Stack for Logging and Metrics
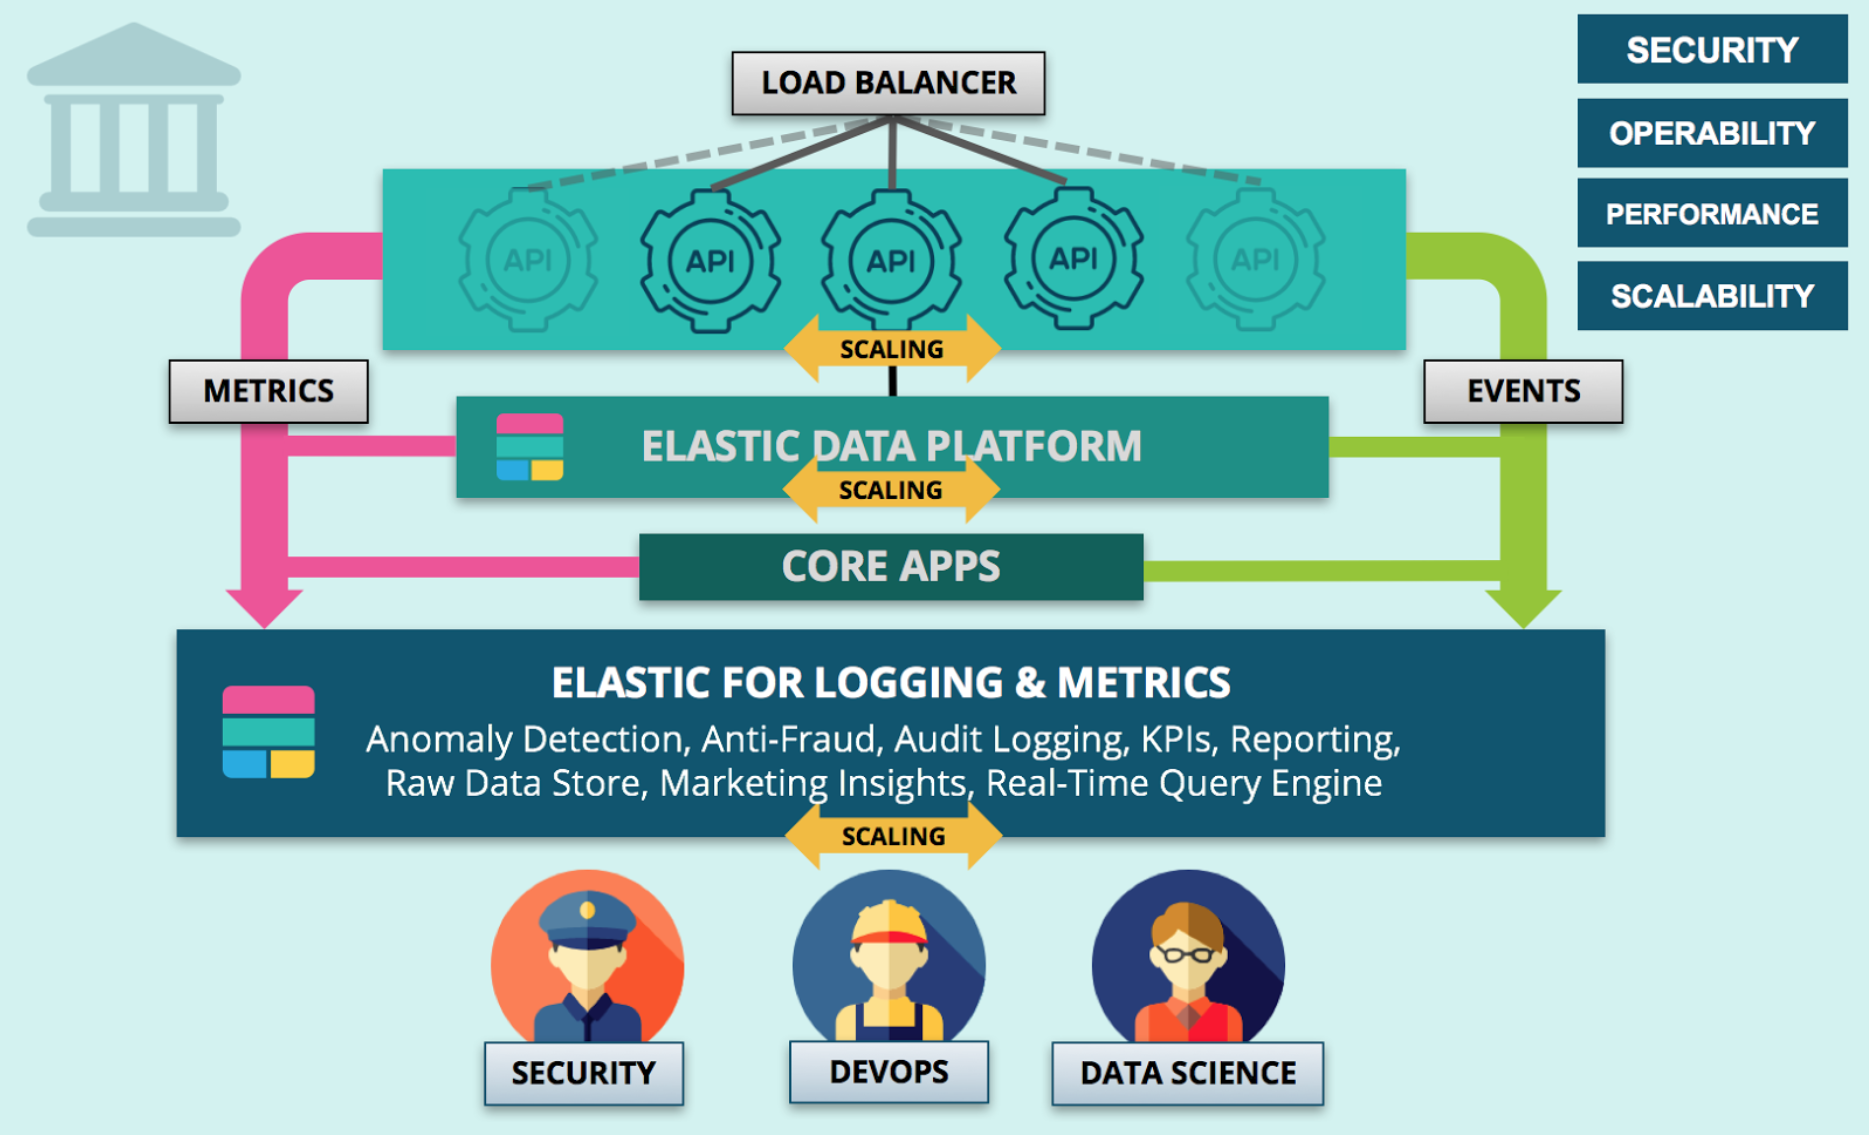
At the highest level, Elastic is functioning as the data platform for all logs, metrics, and traces that are generated in the Elastic data platform. A separate cluster will ensure separation of resources and data. Data agents generate and collect relevant data into a pipeline that transforms the data before ingesting it into a permanent data store. From ingestion, that data is immediately available for automated and manual analytics: machine learning, dashboarding, ad-hoc queries, and the likes.
The Elastic Stack for Logging and Metrics
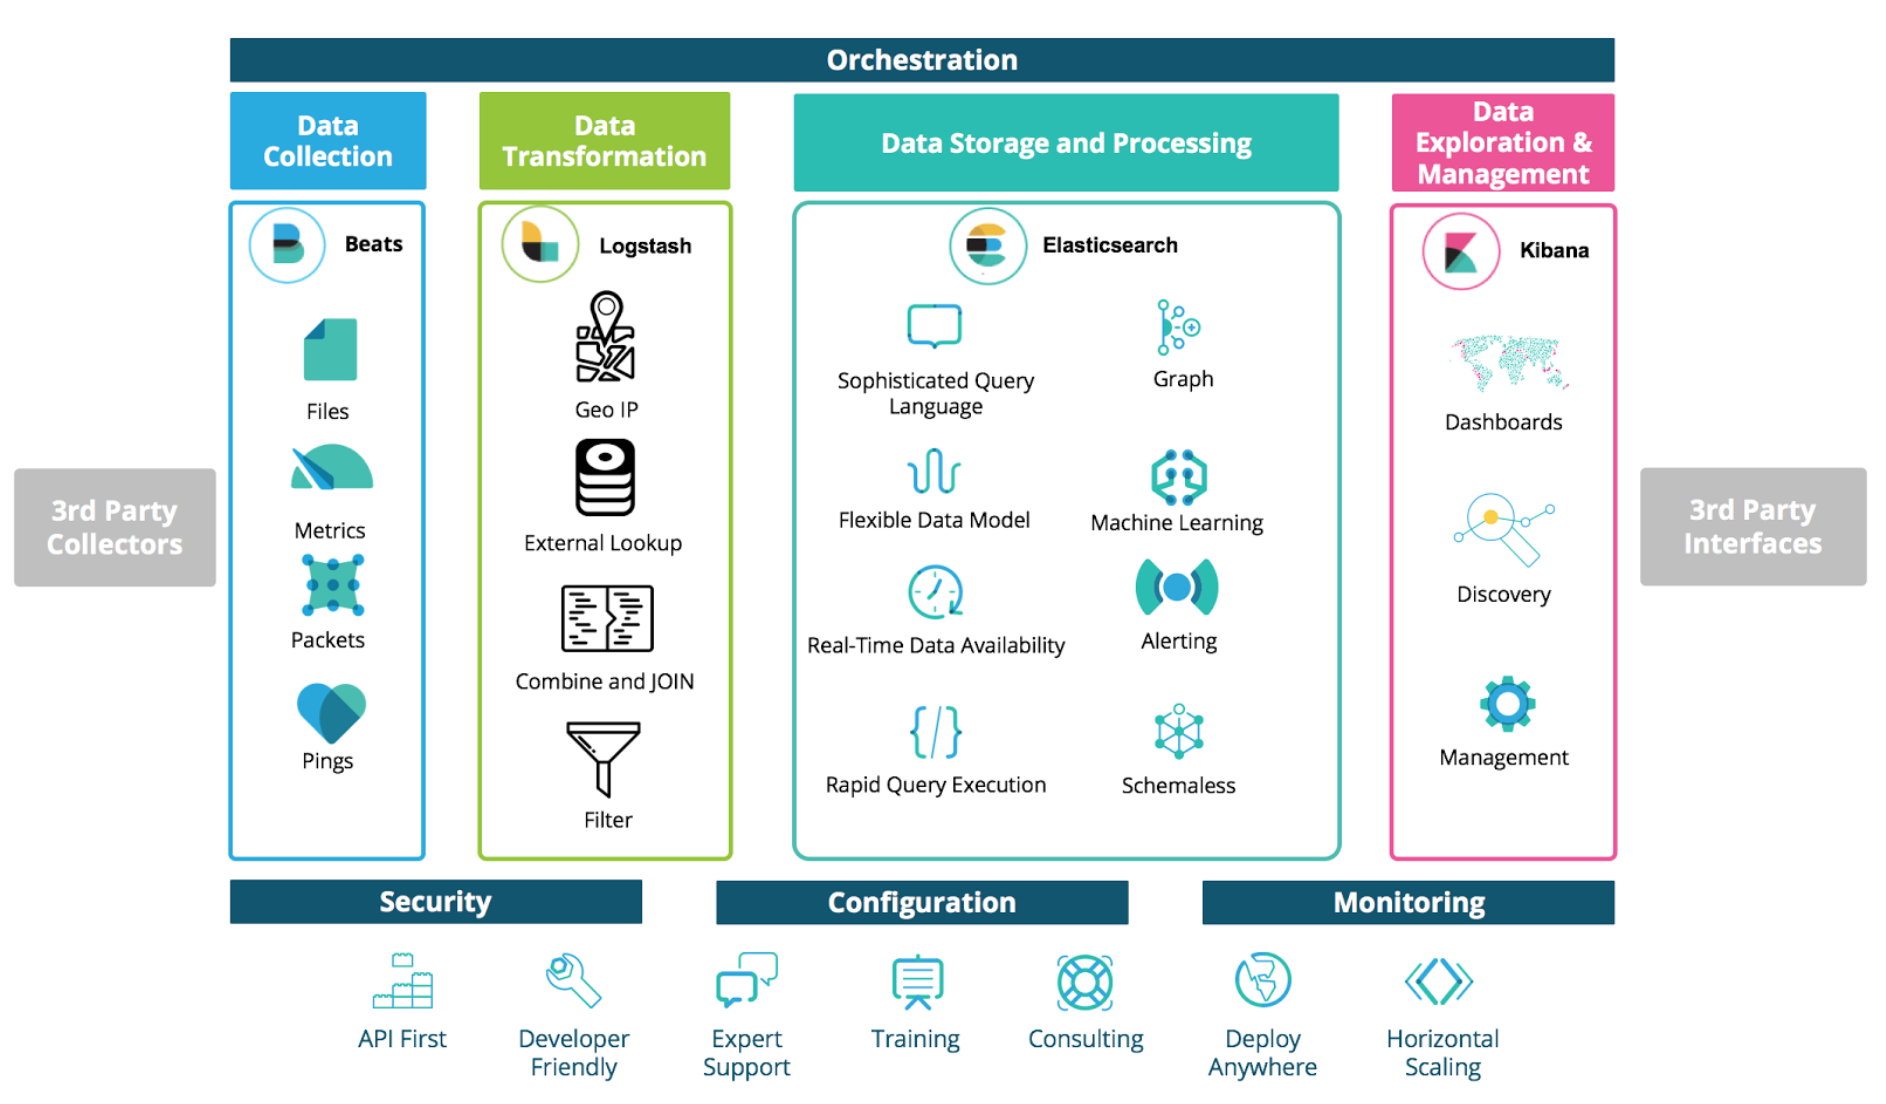
More specifically, the logical architecture looks like pictured above. The Elastic Stack offers a complete suite of products for API observability architectures:
- Beats is a platform for lightweight shippers that send data from edge machines to Logstash and Elasticsearch.
- Logstash is a dynamic data collection pipeline with an extensible plugin ecosystem and strong Elasticsearch synergy.
- Elasticsearch is a distributed, REST API enabled, JSON-based search and analytics engine designed for horizontal scalability, maximum reliability, and easy management.
- Kibana gives shape to your data and is the extensible user interface for configuring and managing all aspects of the Elastic Stack.
- X-Pack is a single extension that integrates handy features — security, alerting, monitoring, reporting, graph exploration, and machine learning
The Elastic Stack logical architecture for Observability combines all these products into an end to end platform with accompanying services, like Consulting and Expert Support. As you have probably read a bunch of times by now, Elastic :heart: APIs. That is why the Elastic Stack products natively supports REST API endpoints for easy integration into any architecture.
Keeping an Eye on Things, All Things
Log events are composed of documents in the 1st Normal Form (1NF), usually with a timestamp. 1NF is important to achieve linear scalability: it is not feasible to arbitrarily join multiple datasets of hundreds of terabytes while the user or a real-time process is waiting for the answer. Of course, it’s a good idea to join those datasets at time of ingestion! That still allows us to scale to billions of events per day without slowing down.
Millions of similar events will stream into the Elastic platform using the Elastic Beats data agent towards Logstash, Elastic’s data processing product. Logstash will be able to enrich, lookup, filter and transform the data in transit before storing it in Elasticsearch. After Logstash, the same document might look like this. It has relevant information added to it that will help the observability of what is actually happening on our APIs. Bold fields added by Logstash. There is ample opportunity to add in any business logic.
A simplified, enriched event log describing a single API call, in JSON format, after enrichment with GeoIP information and a threat score:
[{
  "timestamp": "2018-01-05T18:25:43.512Z",
  "http_method": "GET",
  "request": "transactions/latest",
  "result": 200,
  "error": null,
  "ip": "123.123.123.123",
  "geoip_fields": {
      "country_iso_code": "NL",
      "city_name": "Rotterdam",
      "location": { "lat": 51.922755, "lon": 4.479196 }
      // other fields omitted
  }
  "user": "Alice",
  "user_last_login": "2018-01-01T16:40:09.938Z",
  "threat_score": 0.042,
  "authentication_method": "app_fingerprint",
  ... // other fields omitted
}]
When we pre-filter, pre-aggregate or otherwise remove data before our data store, we will, by definition, lose an unknown amount of information.
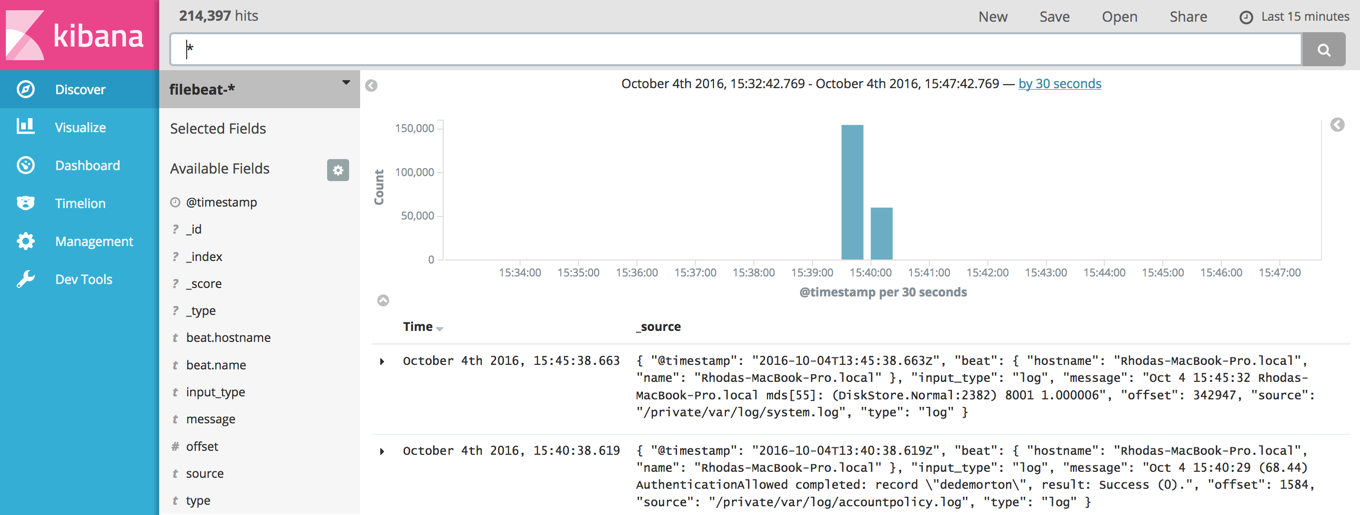
Elasticsearch will take billions of logs and metrics to provide you an unobstructed view of what is actually happening, in real-time. Kibana sits on top of the stack to discover data and manage Elastic components. This is where scalability becomes important. When we pre-filter, pre-aggregate or otherwise remove data before our data store, we will, by definition, lose observability. Luckily, the Elastic Stack can take on any workload, even if you turn out to be the largest retail bank of the globe.
Point Solutions for Logs, Metrics, Metrics
A number of point solutions for a subset of the desired functionality are available, often closed source and not seldom including a form of vendor lock-in. Apart from added complexity in buying, deploying and operating multiple systems where one can suffice, the real problem is the additional overhead of having to deal with multiple ‘truths’ at the same time. While attackers are rampaging through the system, or outages are hampering performance, your SecOps and DevOps might be manually correlating the “logging solution” output, with the “metrics solution” output, possibly demanding another tool to overlay on the said point solutions. And while some integration options are usually available, some of these solutions do not expose their raw data willingly.
Elastic clears these issues completely, by bringing together what should be together.
Scaling Up Within Budget
So, now that we have established the need to save all data and keep it in a real-time data store for enough time to be able to train Machine Learning jobs, understand longer-term patterns of behavior, and investigate interesting events. No one knows what data will become valuable later.
How do we keep costs at bay? Elastic has support for several advanced strategies:
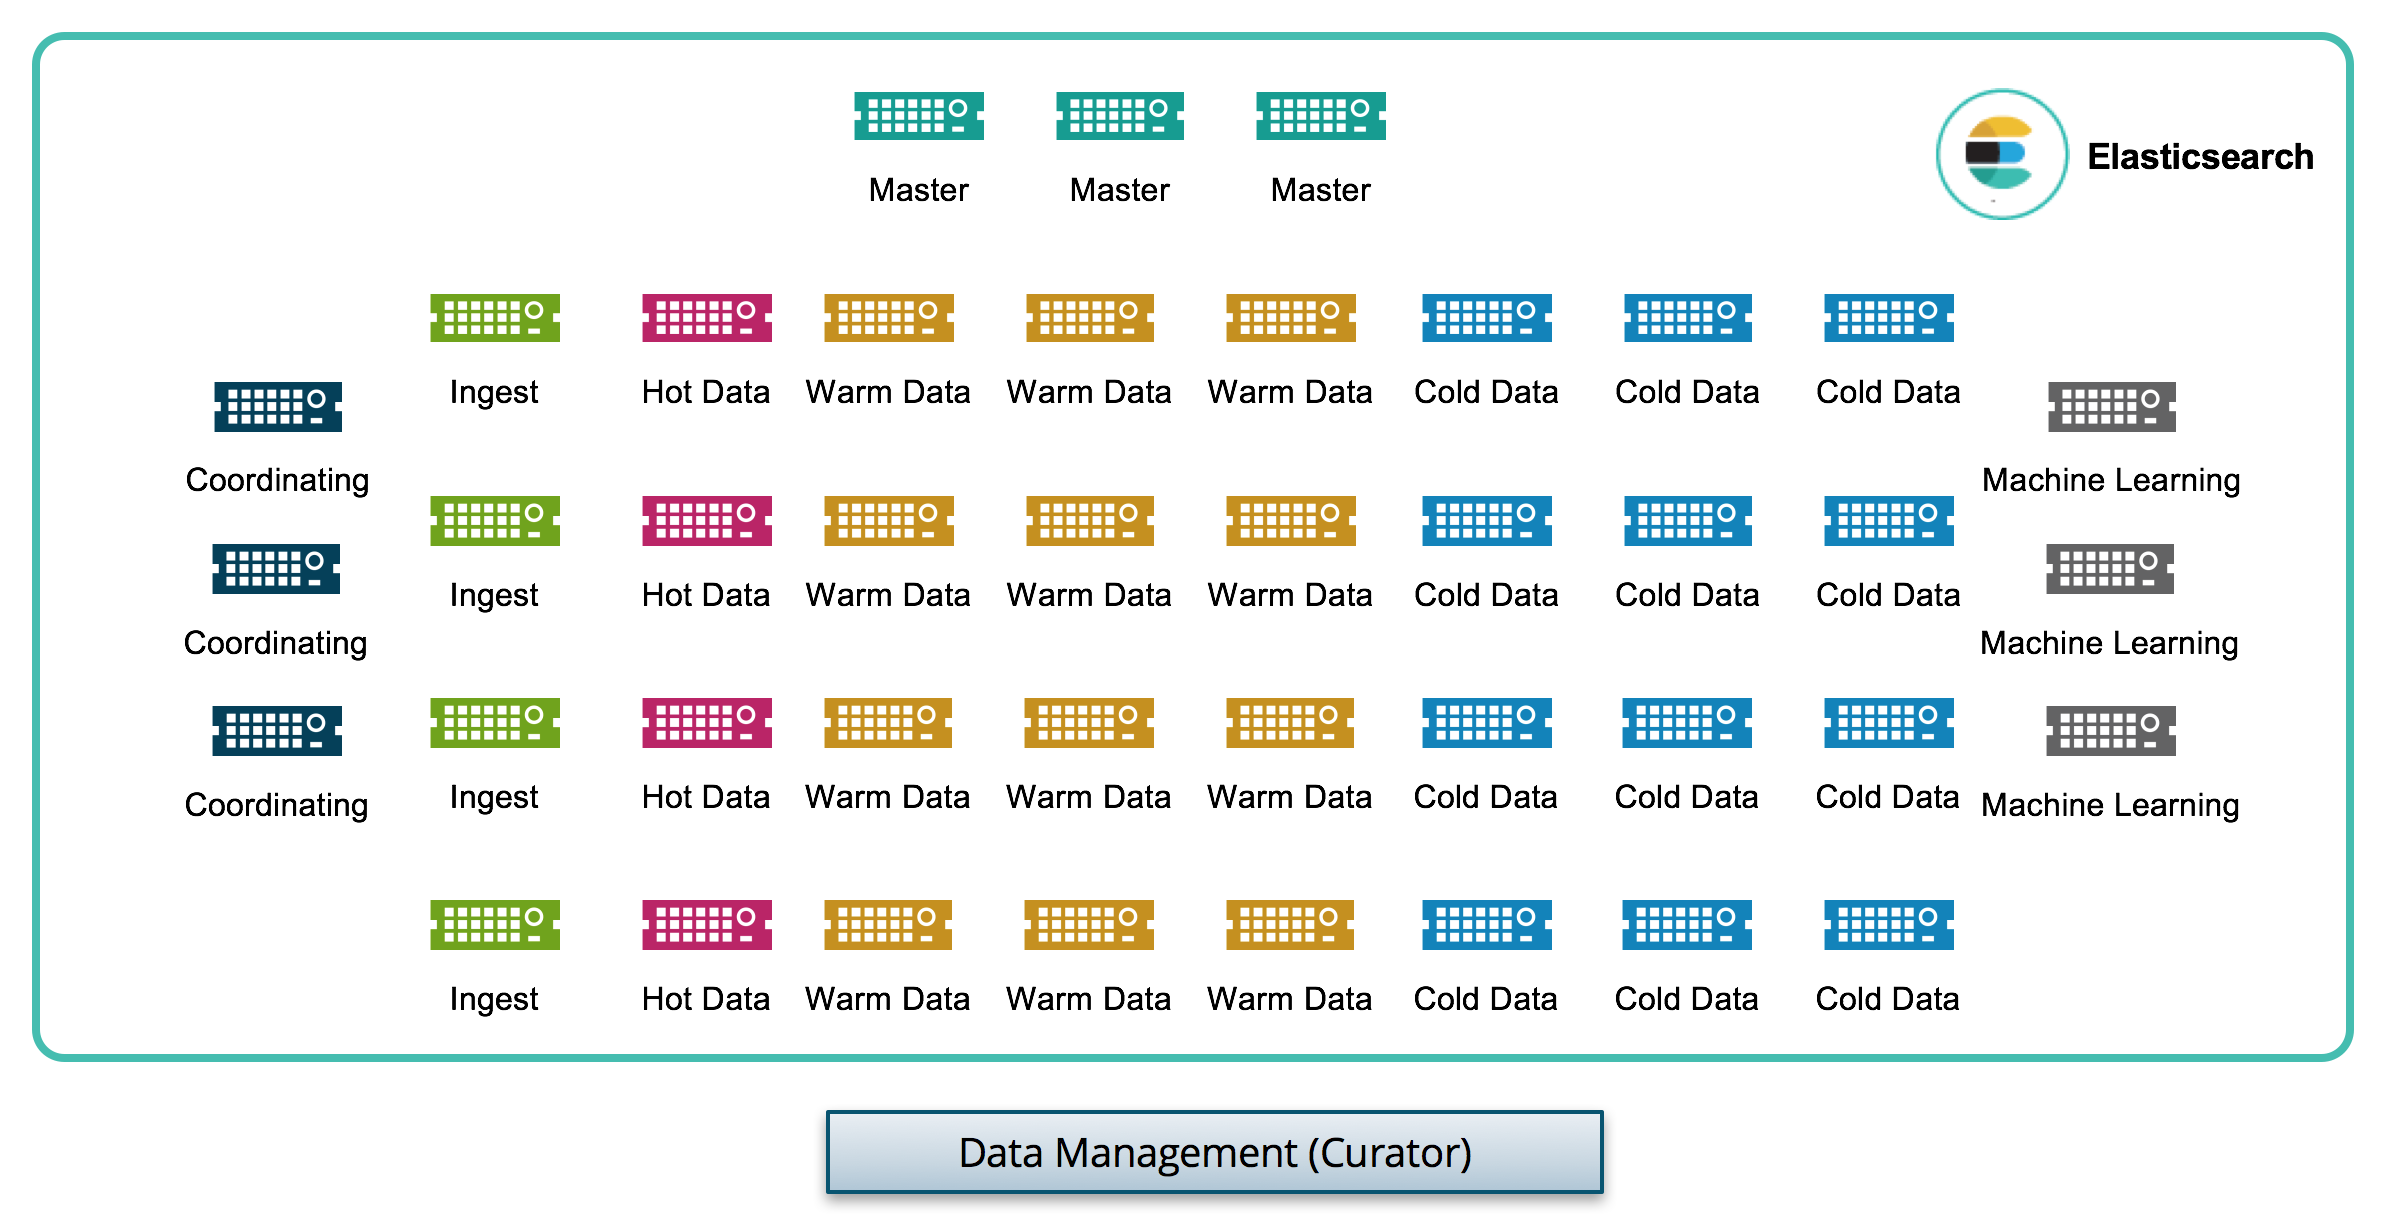
- Multi-tier (or hot/warm) architecture: allocate data in tiers (hot, warm, tapid?) and designate data nodes to exist in one of those tiers. It allows read and write separation (only hot data gets written to), and most importantly an option to store more data on a warm node, allowing a slight performance degradation for older data while saving infrastructure costs at the same time.
- Increase compression on older data
- Optimize data for Warm Archive: this goes a bit ‘under the hood’, but there are a number of actions you can take on your older shards to optimze them for reading in a Warm zone: Merge Segments, Shrink to less Shards
A multi-tier data architecture looks like this:
Monitoring a World-Class API Service
All these provide their own perspective on what is happening in the system. So it helps to keep them in the same place. This is where the agnostic nature of Elastic shines: it really does not limit the types of data that can be used on it. You can happily aggregate metrics into KPIs on dashboards, alongside frequent errors taken from log files, with stack traces on the same data store so that DevOps Engineers can dive into anything interesting in seconds.
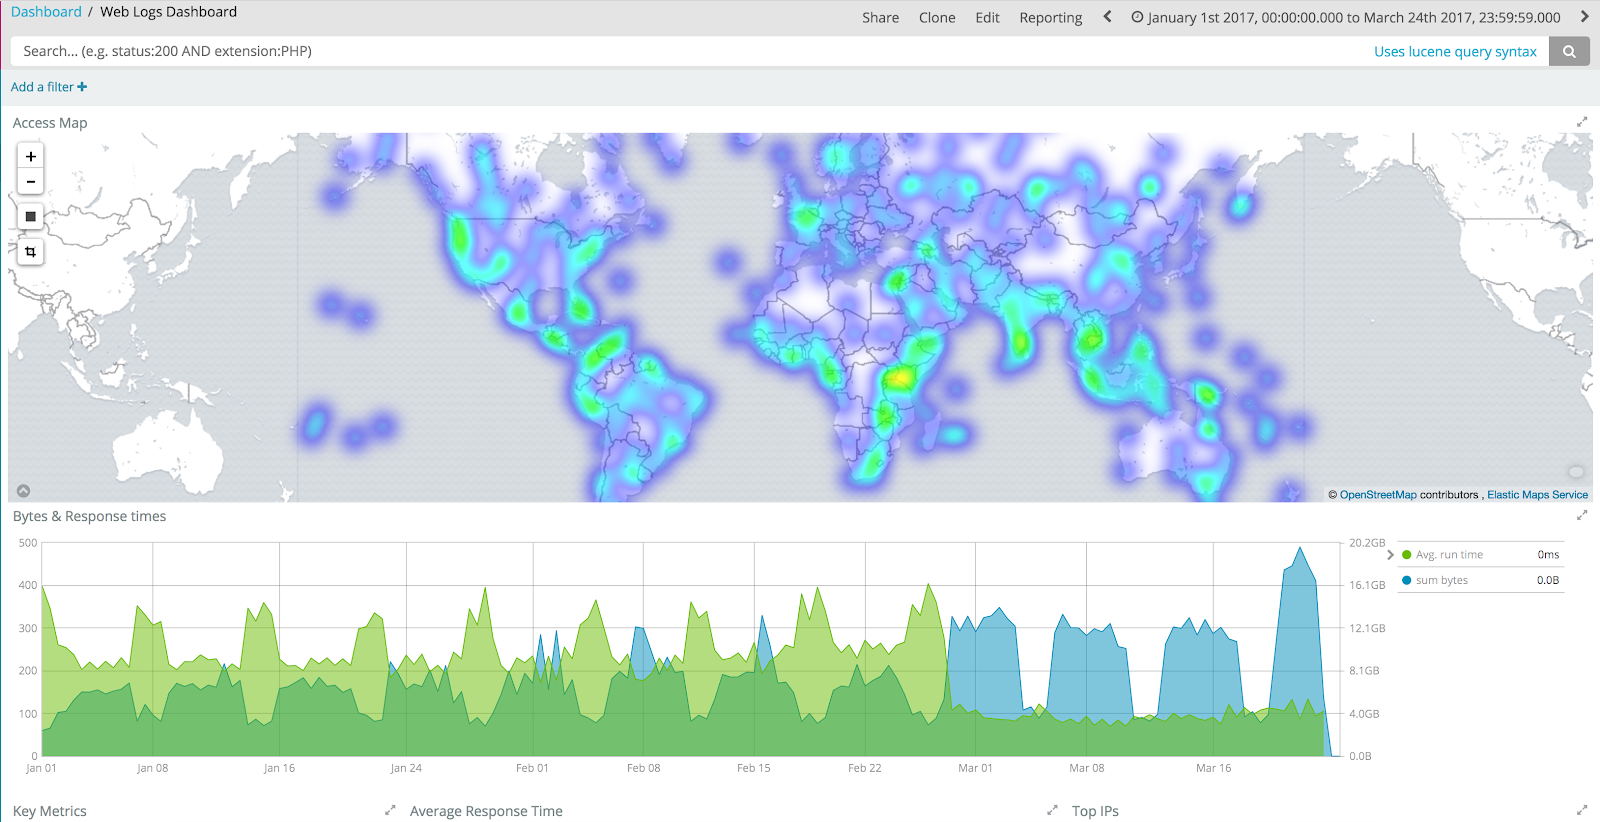
Kibana makes it possible for everyone to create the most relevant perspective on the data, and share those visualizations, dashboards, graphs and machine learning jobs with the organization. Or just keep it for themselves.
The (Un)known (Un)knowns with X-Pack Machine Learning
Self-learning anomaly detection is all about tackling both knowns and unknowns. We believe that even if nobody has predicted something could happening, does not mean it’s not relevant if it does. At the same time, you probably have other things to do than create alerts for anything that you know could happen.
Solutions for…
- Known knowns: if an API gets overloaded, we will be in a lot of trouble. We know exactly what to look for, and when to let the alarms go off.
- Known unknowns: we know that users will use our APIs today, but we do not know how many. We can use history to guide us, but we cannot be exact. If we see something “out of the ordinary”, it’s probably worth a look by a human. At least we know what KPIs and metrics are relevant.
- Unknown unknowns: we acknowledge that something might popup at any moment that disrupts our systems, our business. Like a new security vulnerability. We cannot predict which KPIs or metrics will be relevant, but we do know that as long as wel have good observability, the data will have the information we need. If we only know what to look for.
Known knowns we can easily cover with X-Pack Alerting. It uses pre-defined boundaries of what is “OK” and what is “not OK.” It will respond in real-time to anything in the known known department. The other two need something more.
Enter X-Pack Machine Learning. It will learn from history to predict the future, and tell you when something is not right, including the associated probabilities. It covers both known unknowns and unknown unknowns by looking holistically at all the data. At the same time, it’s so easy that a kid can use it, freeing up time from your people with the “sexiest jobs of the 21st century” (Harvard Business Review) to work on other, more complex challenges.
Traces, or action-specific logs
And of course, you’ll be able to dive into anything interesting or suspicious. Across your infrastructure and application stack. Any information that you have made available about a single request (or many!) is right in front of you.
We would love to talk to you some more, but our time is running out. Some good reads on IT Operations Analytics with the Elastic Stack:
- Blog: Using Elastic and Machine Learning for IT Operations
- Webinar: Elastic for Operational Analytics
- Video: 8 Minutes on IT Operations with Machine Learning Demo
Finding Bad Guys
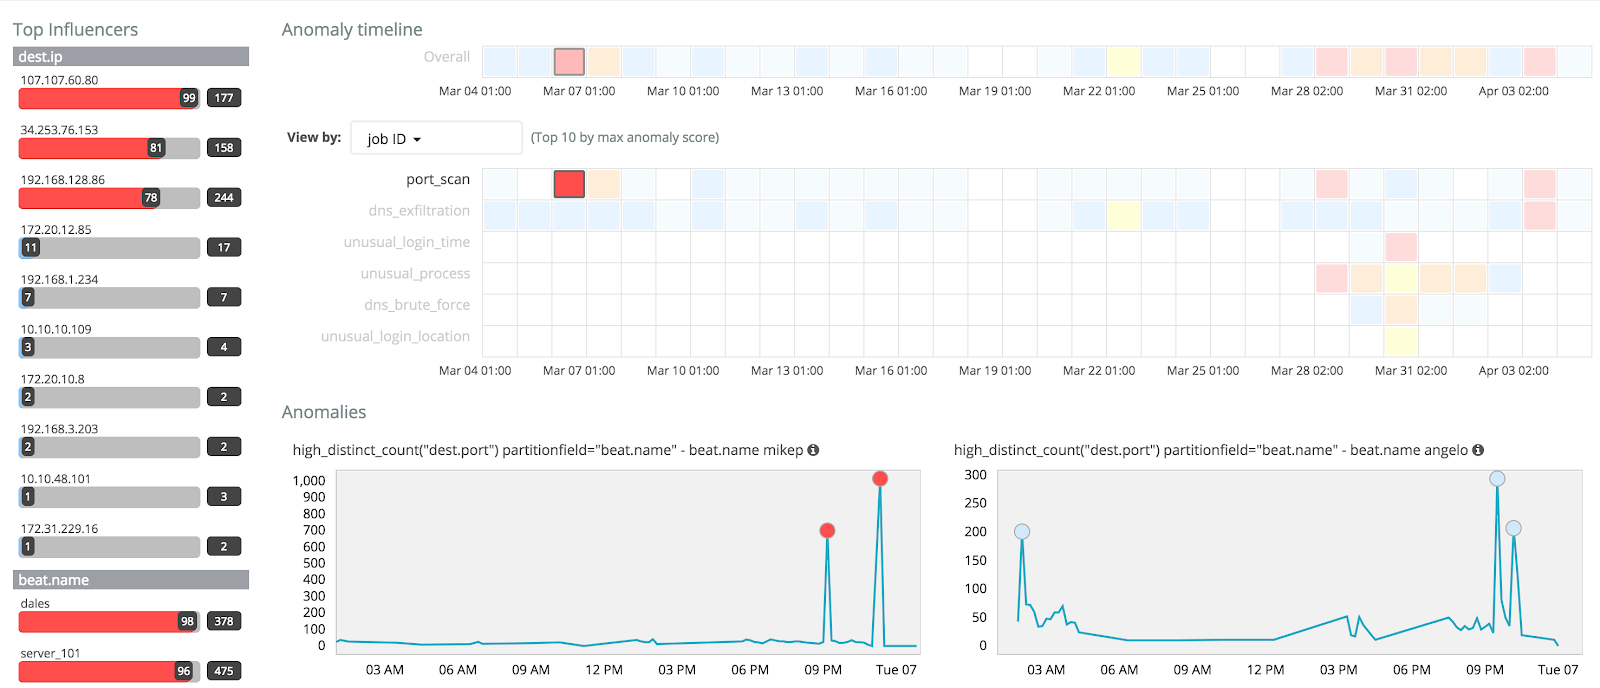
In security as well as with IT operations, we can utilize X-Pack Machine Learning to find unusual patterns in all of our data, with quantitative and qualitative algorithms.
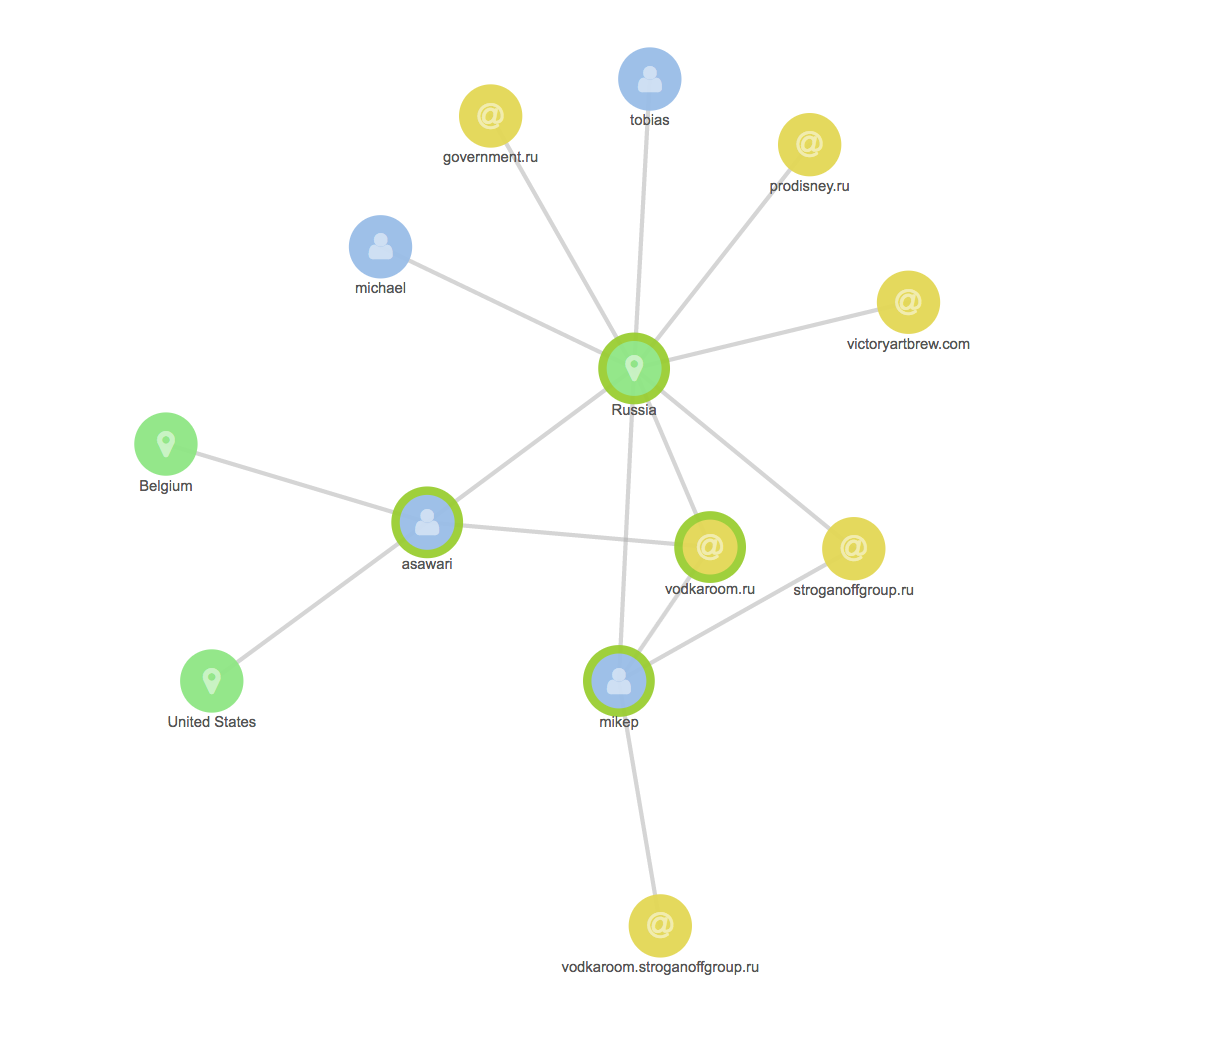
Should we spot suspicious activity, we can utilize X-Pack Graph to create connections between data points and traverse the logs using algorithms that put the relevance first, the popularity second. This is an excellent way to weed out noise that could otherwise interfere with our observability.
We would love to talk to you some more, but this blog is not meant as a comprehensive discussion of how to do API Security Analytics. Luckily, such resources already exist. Some good reads on Security Analytics with the Elastic Stack:
- Blog Series: Integrating Elastic with ArcSight SIEM
- Webinar: Automated Anomaly Detecting with Machine Learning
- Video: 6 Minutes on Security Analytics with Elastic
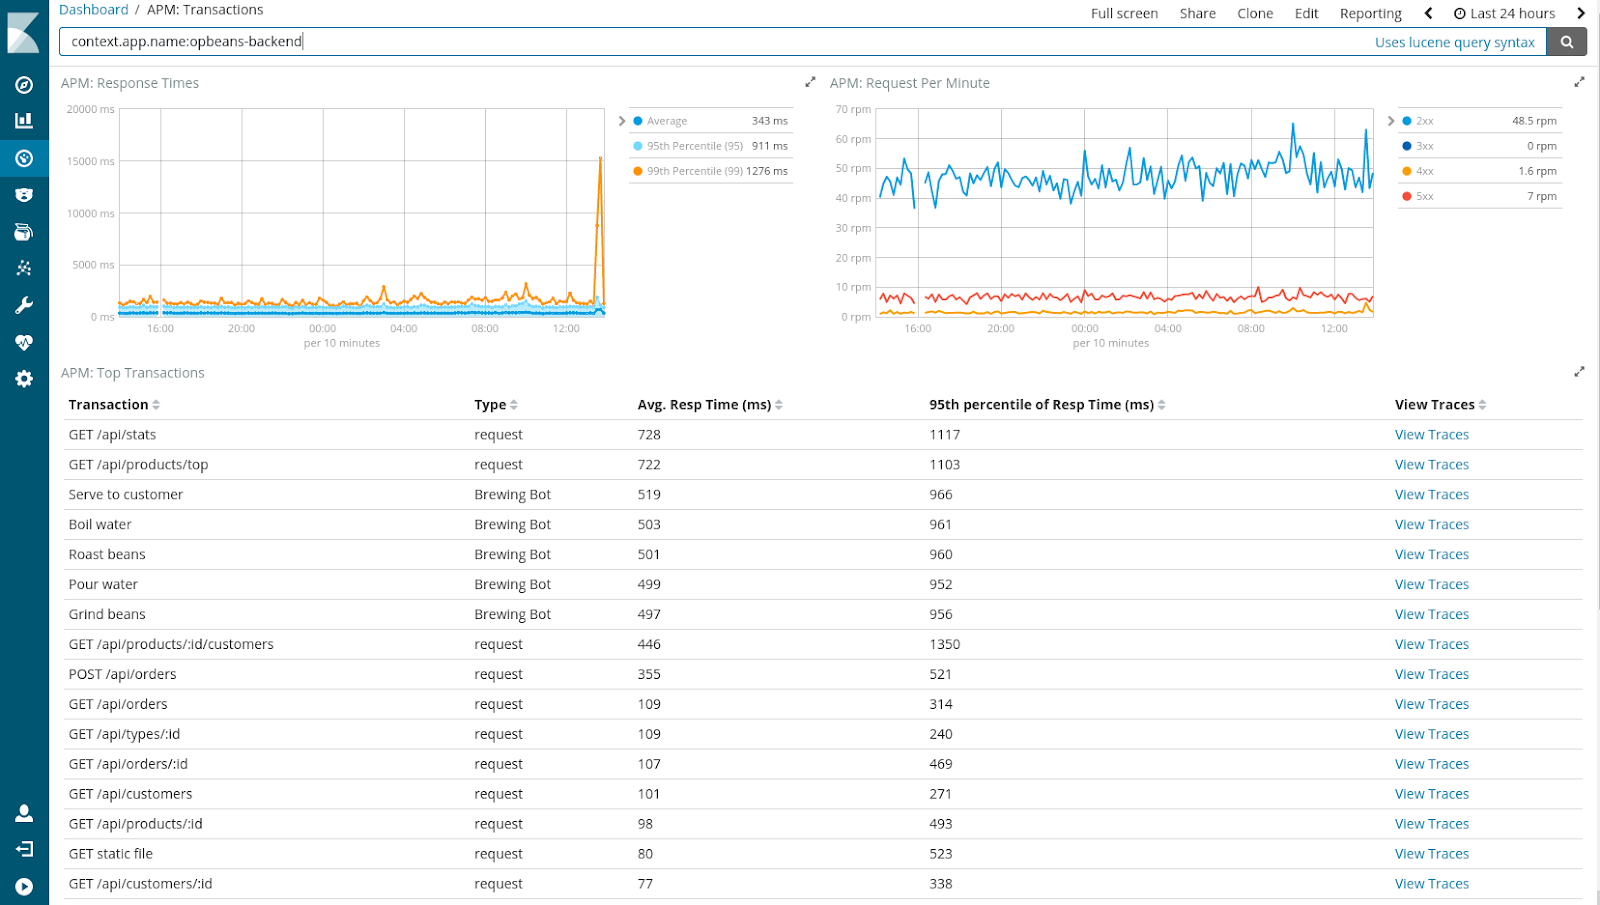
Expand Your Horizon with APM
Adding APM (Application Performance Monitoring) to the Elastic Stack is a natural next step in providing our users with end-to-end monitoring, from logging, to server-level metrics, to application-level metrics, all the way to the end-user experience in the browser or client. It allows for more visibility of the operations of your APIs. APM is currenty in Alpha and hence not quite ready for production today. However, as new, exciting innovations go, it’s worth taking a look at it today!
Some good reads on the upcoming APM module of the Elastic Stack:
Icons made by Freepik from flaticon.com