Elastic Uptime Monitoring 7.7.0 released with alerting, anomaly detection, and more
We are pleased to announce the release of Elastic Uptime Monitoring 7.7.0, available on the Elasticsearch Service, or when you download the Elastic Stack. This release is absolutely chock full of new features that our users have been asking for and we can’t wait for you to get your hands on them. Let’s dive into what’s new!
Monitor status alerting
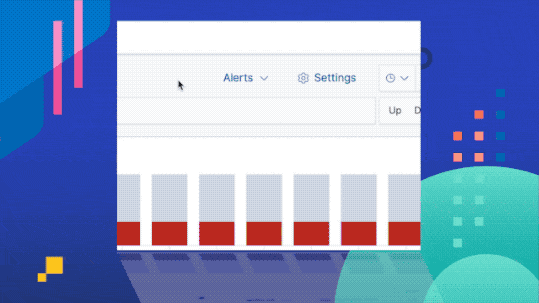
Uptime has always been fantastic at leveraging the simple yet powerful nature of Heartbeat to tell if your monitored website or endpoint is up or down as well as how long it takes for a response to come back and displaying those test results in the Uptime app. With the 7.7 release, we’re supercharging these capabilities by proactively alerting you if your monitors are down! Simply click the “Alerts” button in Uptime to get started. Alerts can be viewed in Kibana as well as through dedicated integrations with Slack and PagerDuty or they can be sent via standard webhooks or email. This is the first of many alerting capabilities that we’ll be bringing to Uptime and we think you’re going to really like it!
Response duration anomaly detection
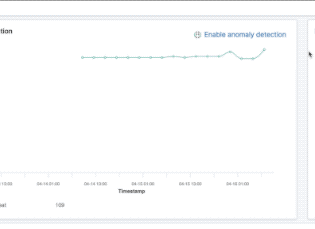
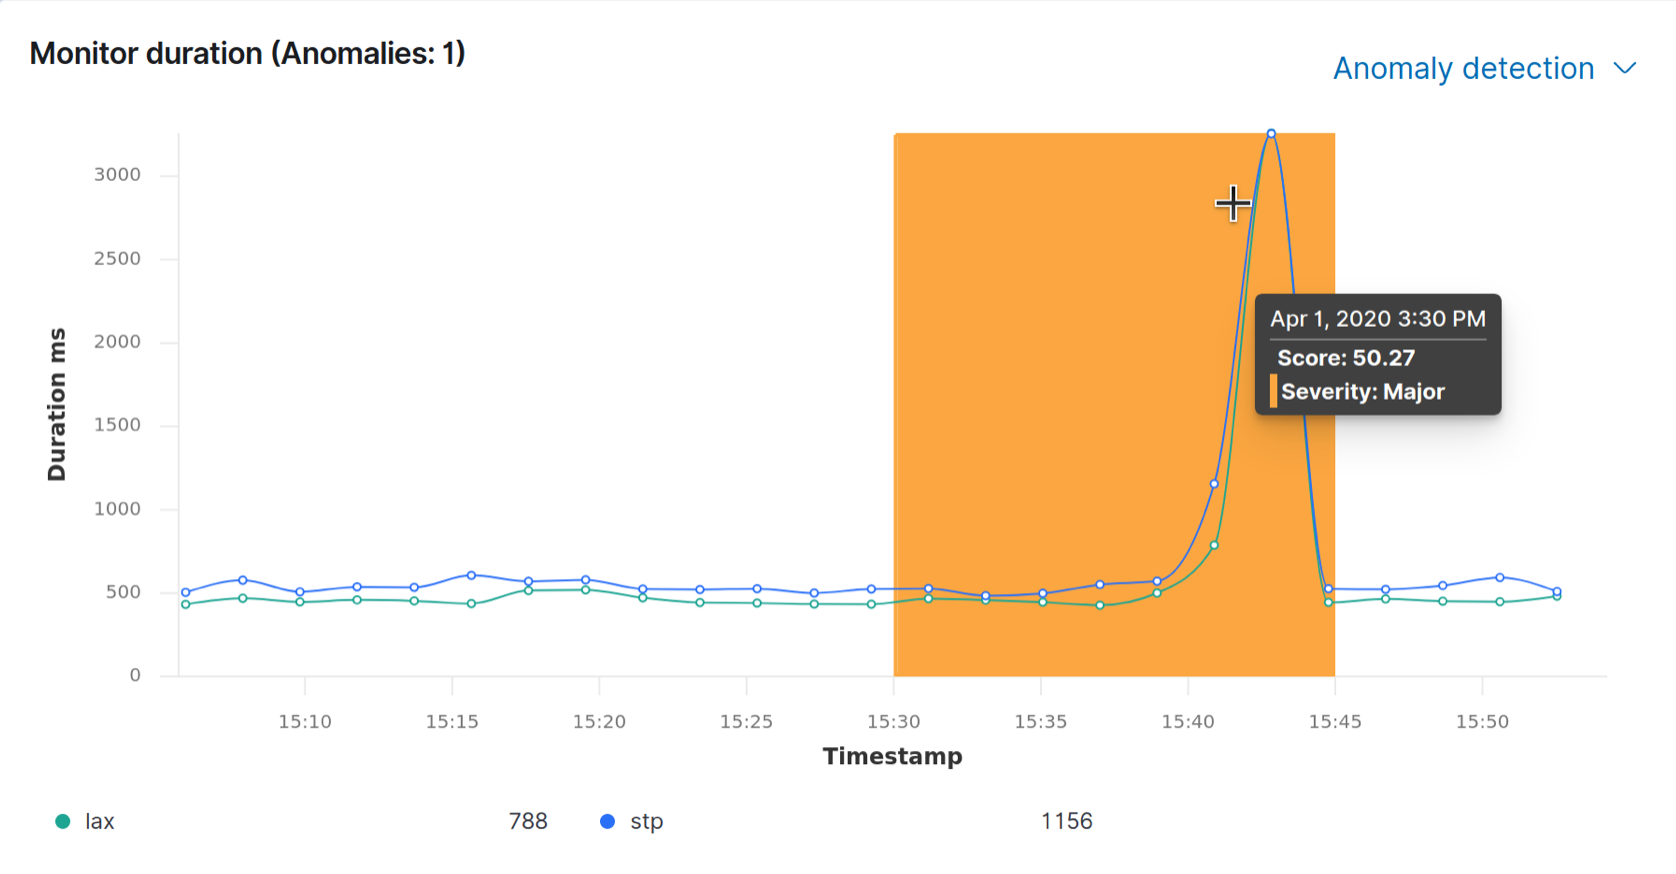
Let’s face it, as much as I would like to imagine our users spend all of their time doing nothing but looking for variations in their response duration charts within Uptime, my instinct (and a fair amount of user research) says that this is not true! We’re all busy and Uptime is a small part of your overall toolset. With this in mind, we’ve leveraged the power of our Elastic machine learning engine to watch the response durations for all of the geographic locations in each monitor. When an anomaly is detected, we’ll highlight it on the chart so you can spend less time measuring changes and more time detecting potential service-impacting issues.
Custom index patterns and cross-cluster search support
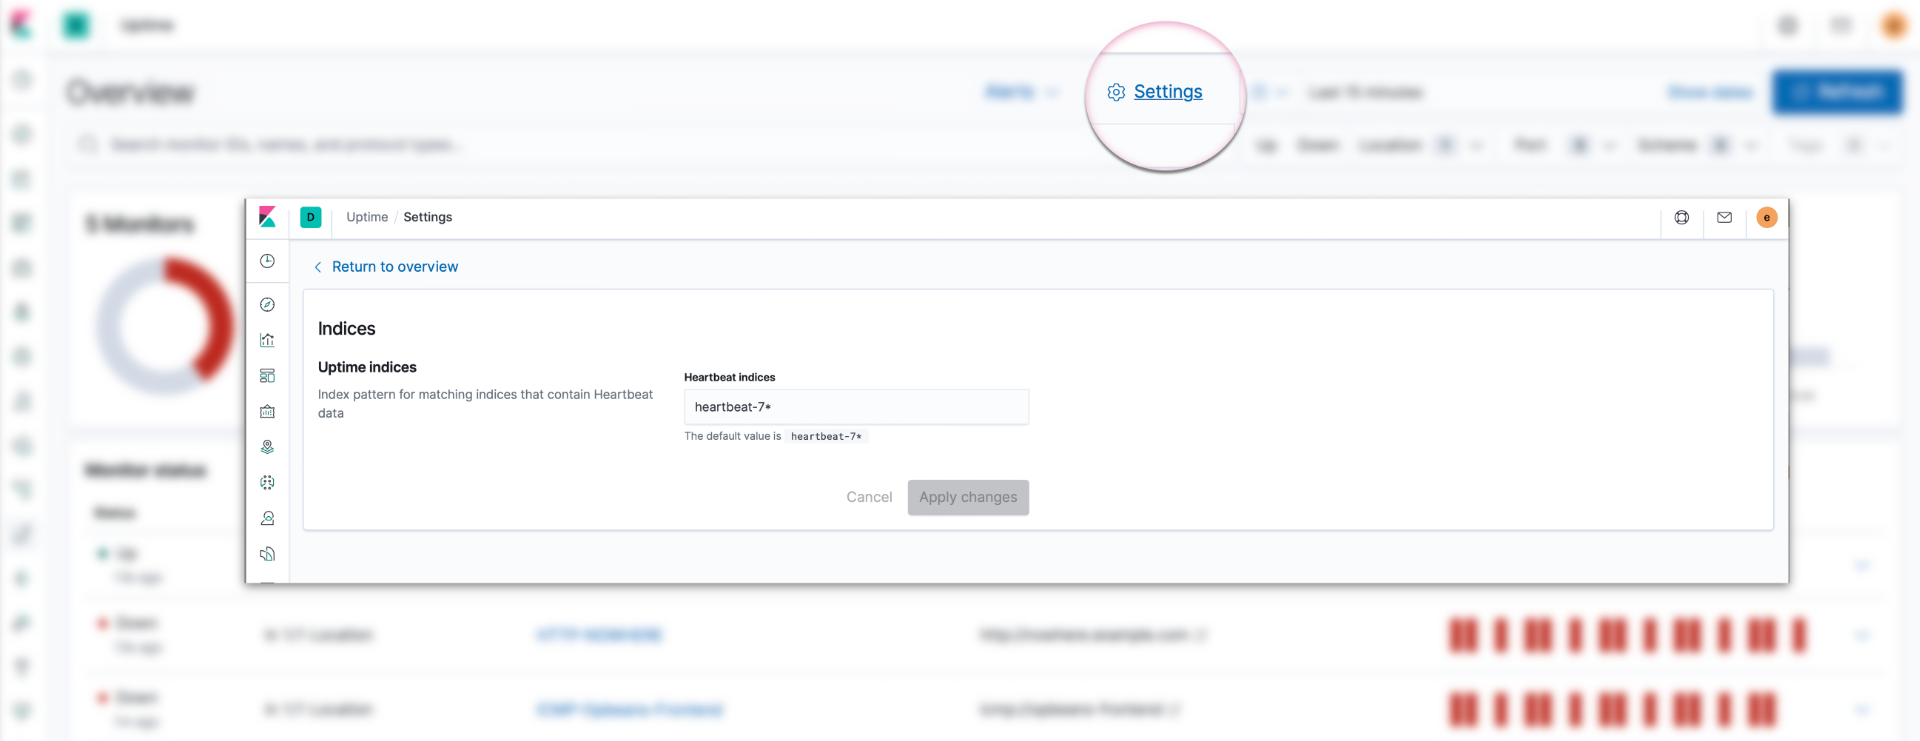
The team has been very excited to see the continuing growth of Uptime adoption. One request that has come out of this growth is for Uptime to support custom index patterns and, by extension, cross-cluster search. With the 7.7 release of Uptime, you can now specify custom index patterns. To get started, click on the new Settings button on the Monitors overview page in Uptime.
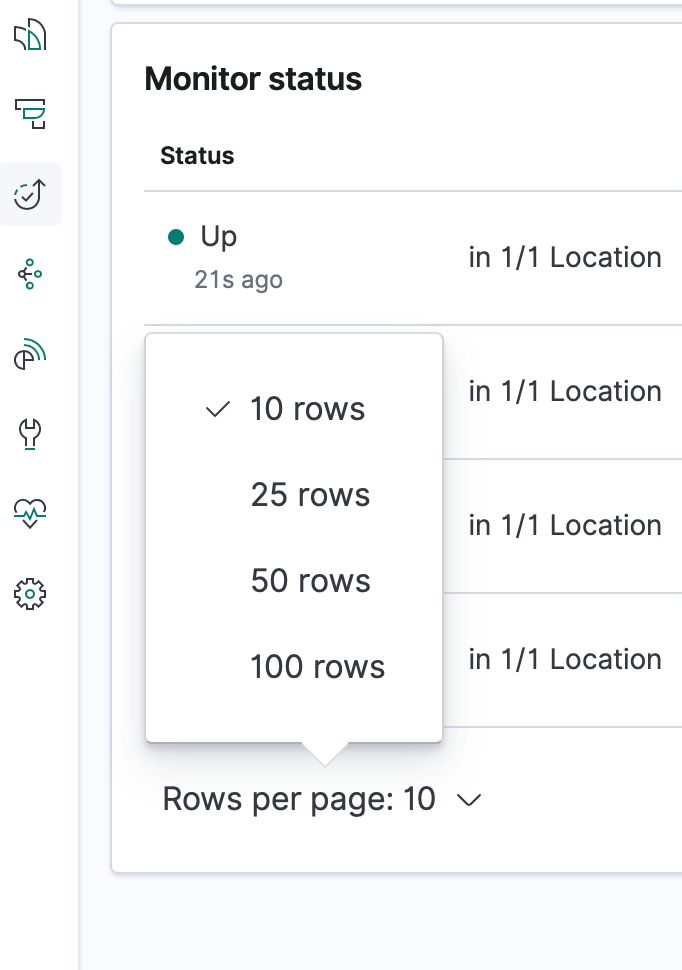
Choose how many monitors to display at one time
If you’ve been following the development of Uptime, you may have noticed that we’re sprucing the place up a bit! One big area of improvement has been on the Monitors Overview page. It’s a lot easier to read and consume essential data with a single glance. Unfortunately, we made a fairly obvious omission when we updated the list of monitors and set the default pagination to ten monitors with no way to display more in a single view. This resulted in more empty white space than the Arctic after a snowstorm on bigger monitors. Mea culpa. In 7.7, you can choose how many monitors you want to see displayed by default.
Want to see it in action?
You can access the latest version of the Elastic Uptime app on the Elasticsearch Service on Elastic Cloud by creating a new cluster, or upgrading an existing cluster the day of release, or you can download the Elastic Stack.