Anomaly Detection with Machine Learning
editAnomaly Detection with Machine Learning
editMachine learning functionality is available when you have the appropriate license, are using a cloud deployment, or are testing out a Free Trial.
You can view the details of detected anomalies within the Anomalies table
widget shown on the Hosts, Network and associated Details pages, or even narrow
to the specific date range of an anomaly from the Max Anomaly Score details
in the overview of the Host and IP Details pages. Each of these interfaces also
offer the ability to drag and drop details of the anomaly to Timeline, such as
the Entity itself, or any of the associated Influencers.
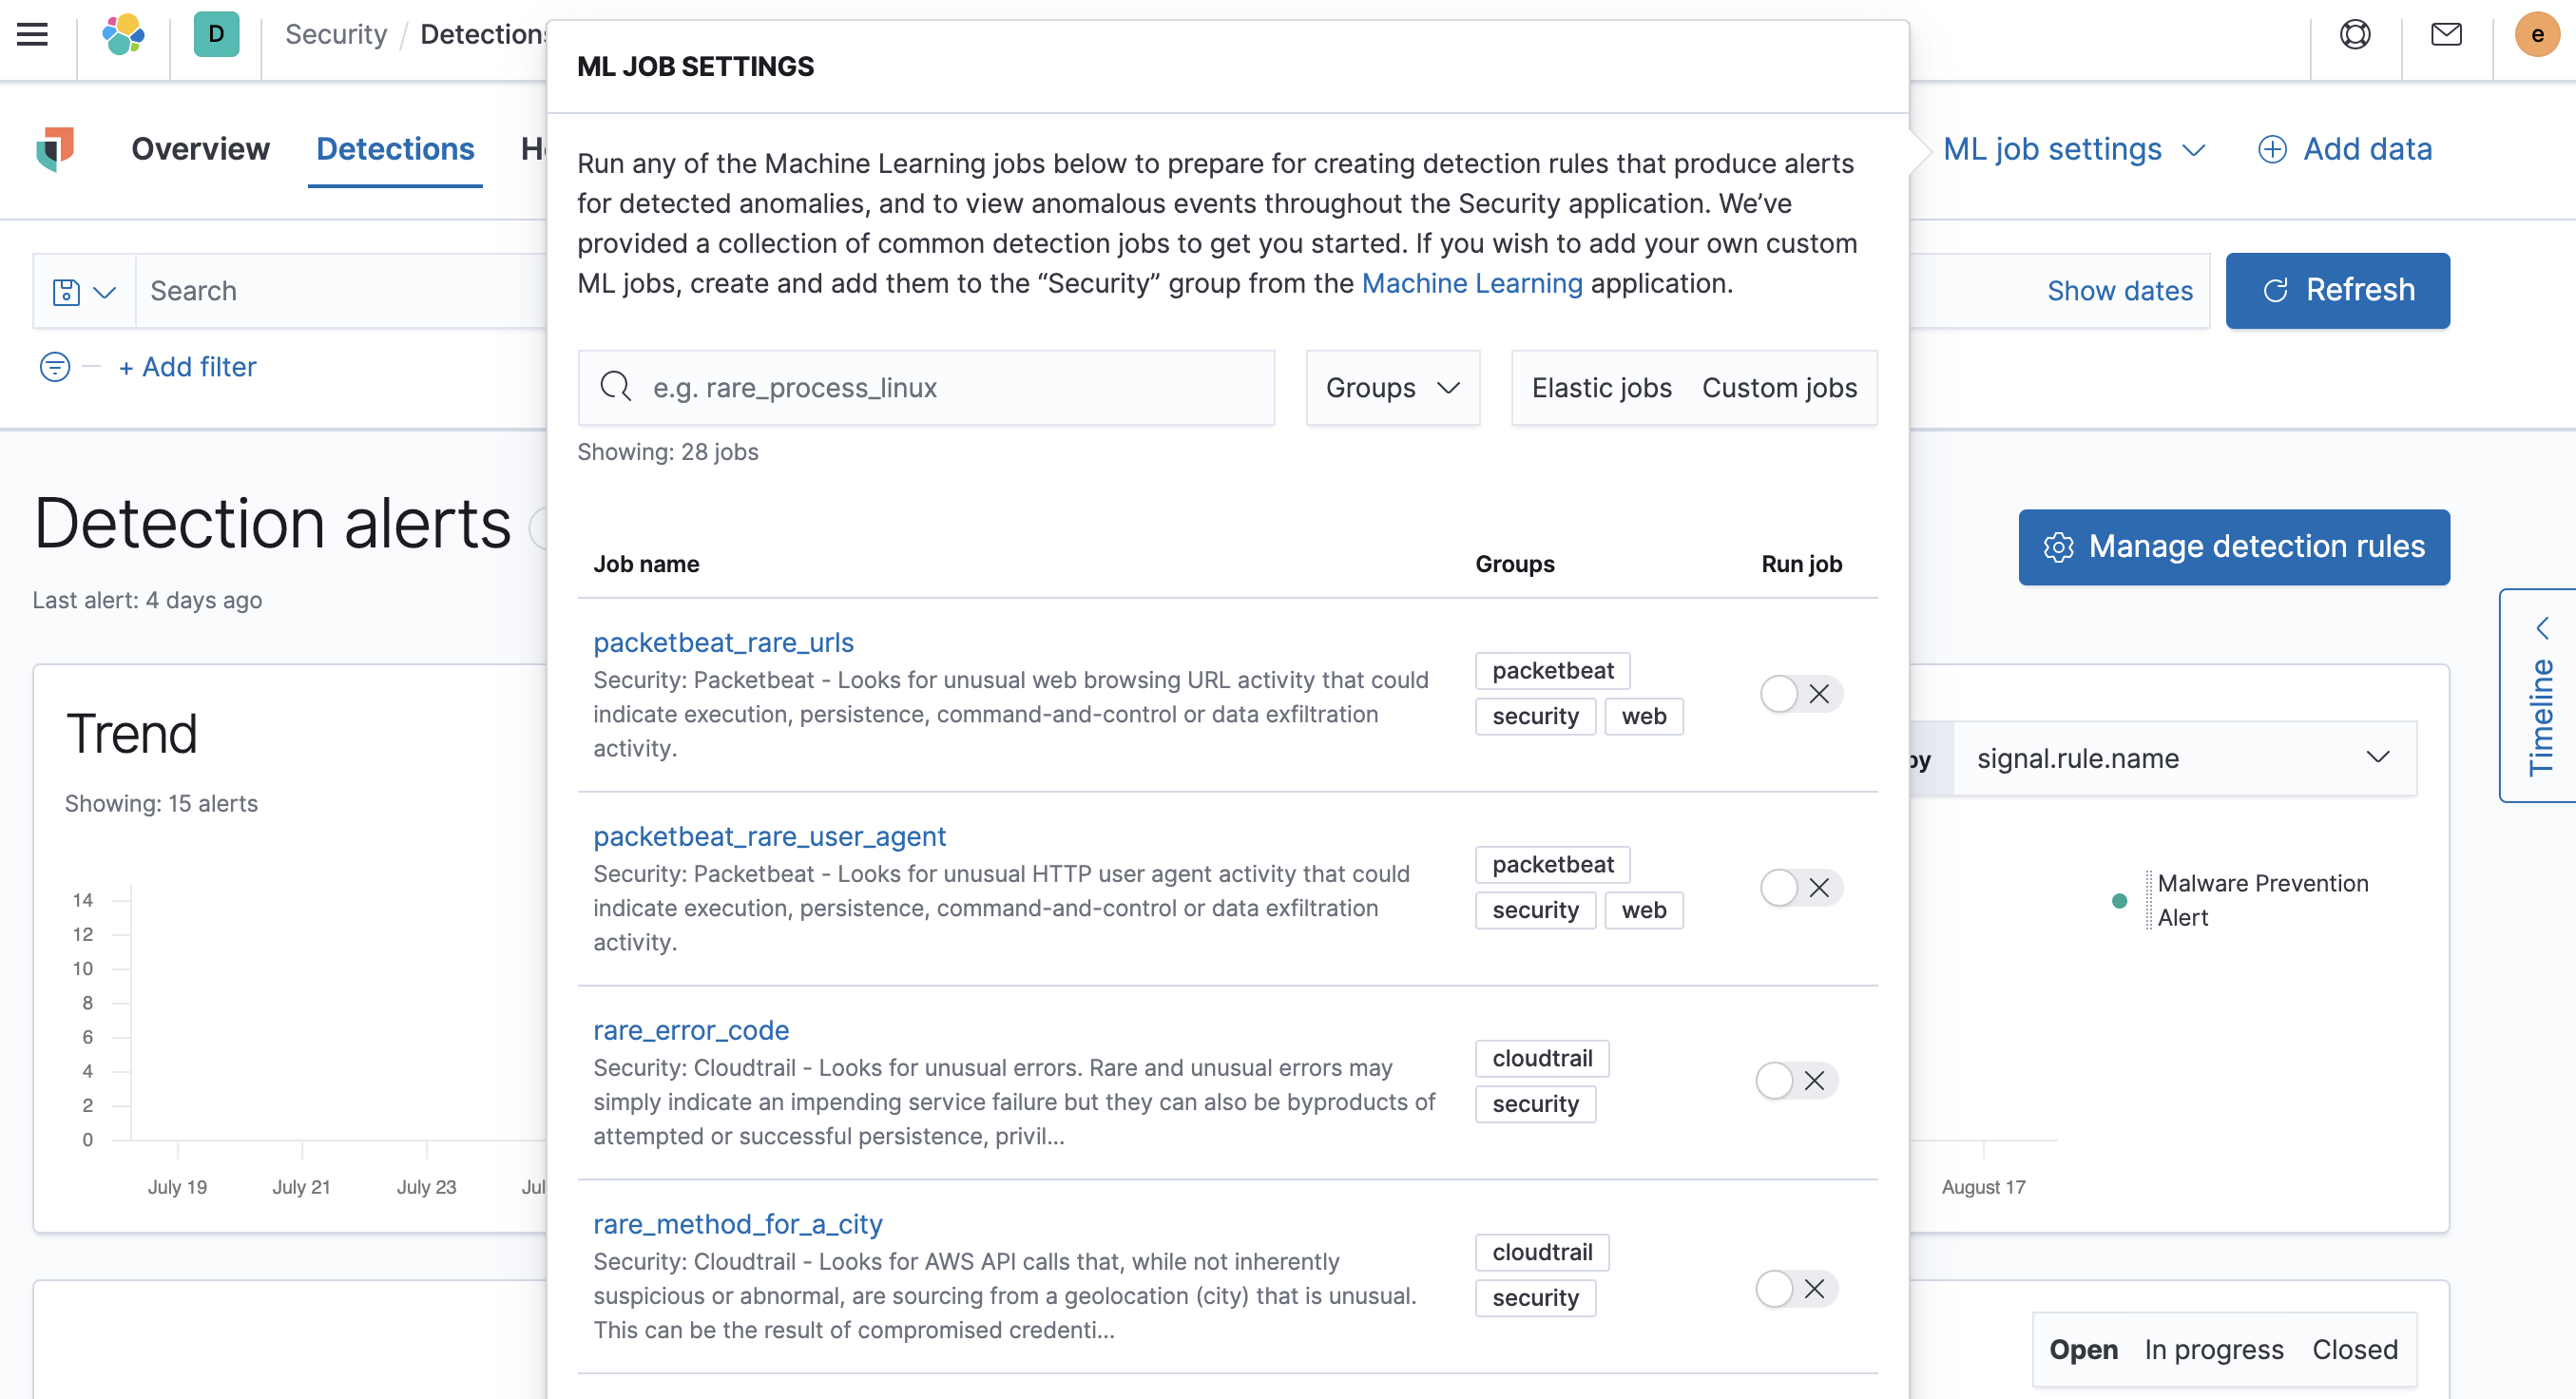
Manage machine learning jobs
editFor users with the machine_learning_admin role, the ML job settings
interface on the Detections page can be used for for viewing, starting, and
stopping Elastic Security machine learning jobs.
To add a custom job to the ML job settings interface, add Security to
the job’s Groups field (Kibana → Machine learning → Create/Edit job → Job
details).
Prebuilt jobs
editElastic Security comes with prebuilt machine learning anomaly detection jobs for automatically detecting
host and network anomalies. The jobs are displayed in the Anomaly Detection
interface. They are available when either:
-
You ship data using Beats or the
Elastic Agent and Kibana is configured with the required index
patterns (such as
auditbeat-*,filebeat-*,packetbeat-*, orwinlogbeat-*in Kibana → Stack Management → Index Patterns).
Or
- Your shipped data is ECS-compliant, and Kibana is configured with the shipped data’s index patterns.
Prebuilt job reference describes all available machine learning jobs, and lists which ECS fields are required on your hosts when you are not using Beats or the Elastic Agent to ship your data. For information on tuning anomaly results to reduce the number of false positives, see Optimizing anomaly results.
Machine learning jobs look back and analyse two weeks of historical data prior to the time they are enabled. After jobs are enabled, they continuously analyse incoming data. When jobs are stopped and restarted within the two week time frame, previously analysed data is not processed again.
View detected anomalies
editTo view the Anomalies table widget and Max Anomaly Score By Job details,
the user must have the machine_learning_admin or machine_learning_user role.
To adjust the score threshold that determines which
anomalies are shown, you can modify Kibana →
Stack Management → Advanced Settings →
securitySolution:defaultAnomalyScore.