Administration page overview
editAdministration page overview
editThe Administration page enables admins to view and manage endpoints that are running Endpoint Security. Admins can also view and manage trusted applications.
In this topic:
Fleet must be enabled in a Kibana Space for administrative actions to function correctly.
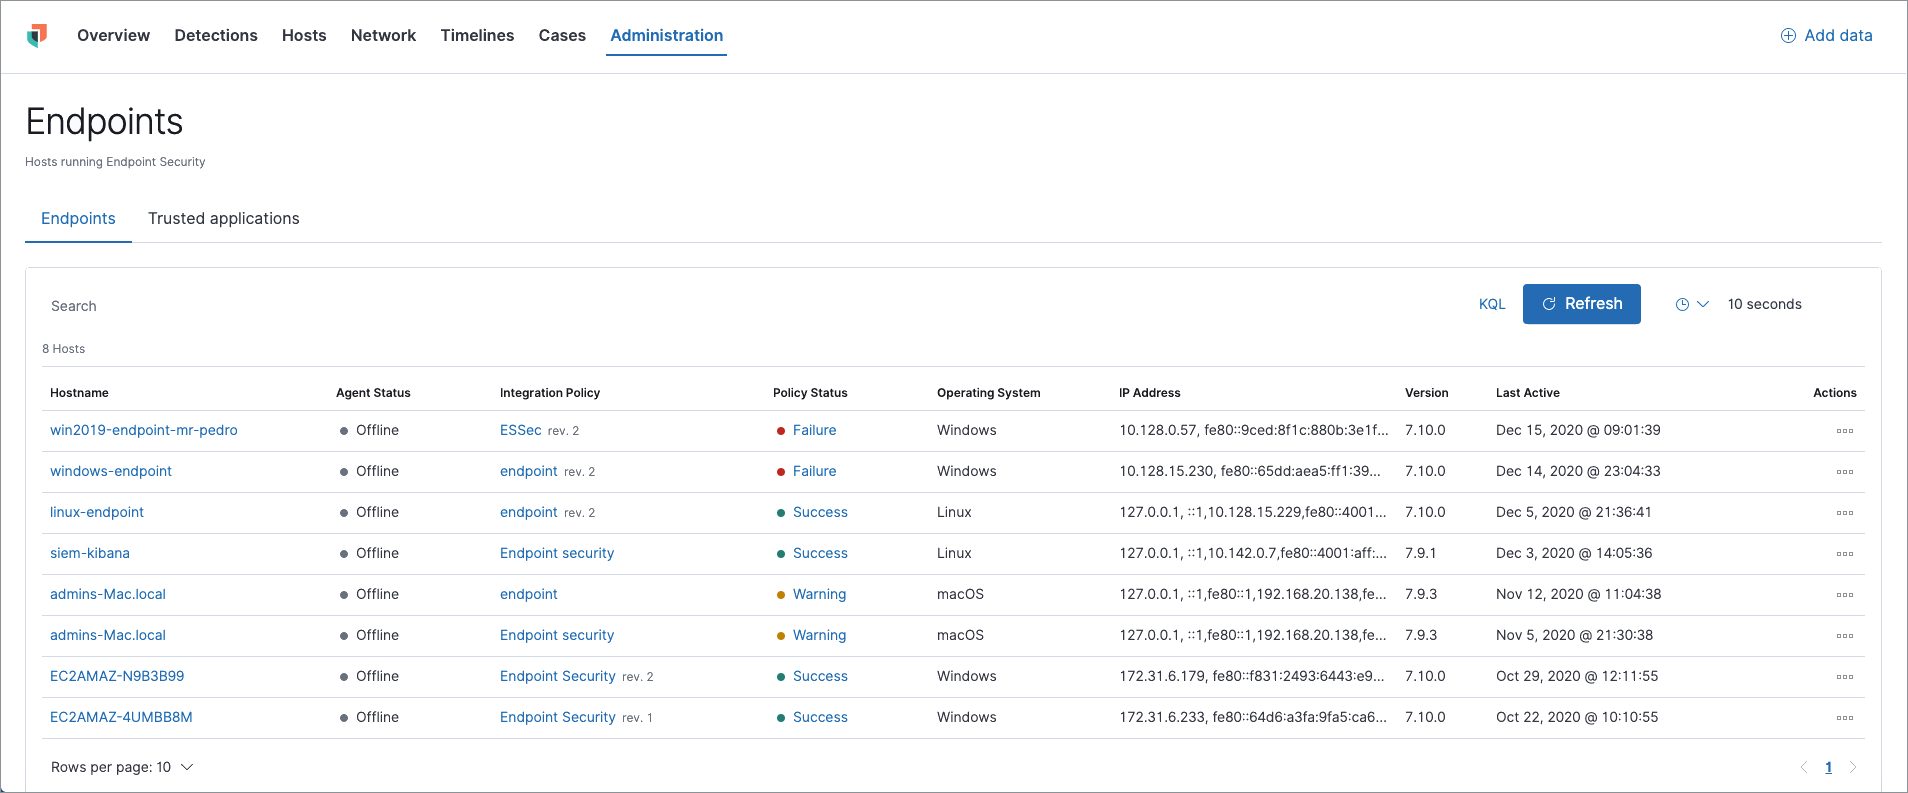
Endpoints list
editThe Endpoints list lists all hosts running Elastic Security and their relevant integration details. Endpoints appear in chronological order, with newly added endpoints at the top. The Endpoints list provides the following data:
- Hostname: The system hostname. Click the link to view host details in a flyout panel, where you can also reassign a Policy.
-
Agent Status: The current status of the Elastic Agent, which is one of the following:
- Online: The Elastic Agent is online and communicating with Kibana.
- Unenrolling: The agent is currently unenrolling and will soon be removed from Fleet. Afterward, the endpoint will also unenroll.
- Offline: The agent is still enrolled but may be on a machine that is shut down or currently does not have internet access. In this state, the agent is no longer communicating with Kibana on a regular interval.
- Error: There is an error with the agent. An Error status can also mean that the endpoint is unable to find the parent agent or is missing the agent ID. It is recommended to look at the agent logs in Fleet to find out more information.
- Integration Policy: The name of the associated Policy when the agent was installed. Click the link to view the Integration Policy page.
- Policy Status: Lists whether the Policy application was a success or failure. Click the link to view response details in a flyout panel.
- Operating System: The associated operating system.
- IP Address: All IP addresses associated with the hostname.
- Version: The Elastic Stack version currently running.
- Last Active: A date and timestamp of the last time the agent was active.
-
Actions: Select the context menu to do the following:
- View Host Details: View host details on the Hosts page in the Elastic Security app.
- View Agent Policy: View the Policy in Fleet.
- View Agent Details: View agent details and activity logs in Fleet.
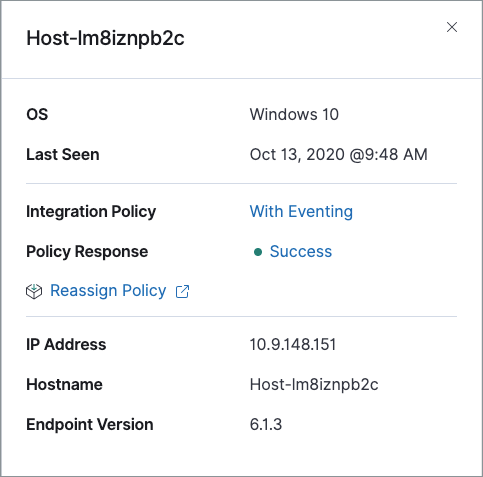
Hostname details
Click a Hostname link to display host details in a flyout panel. This panel also provides shortcut links to view the associated policy, view the response details, and reassign the policy if needed.
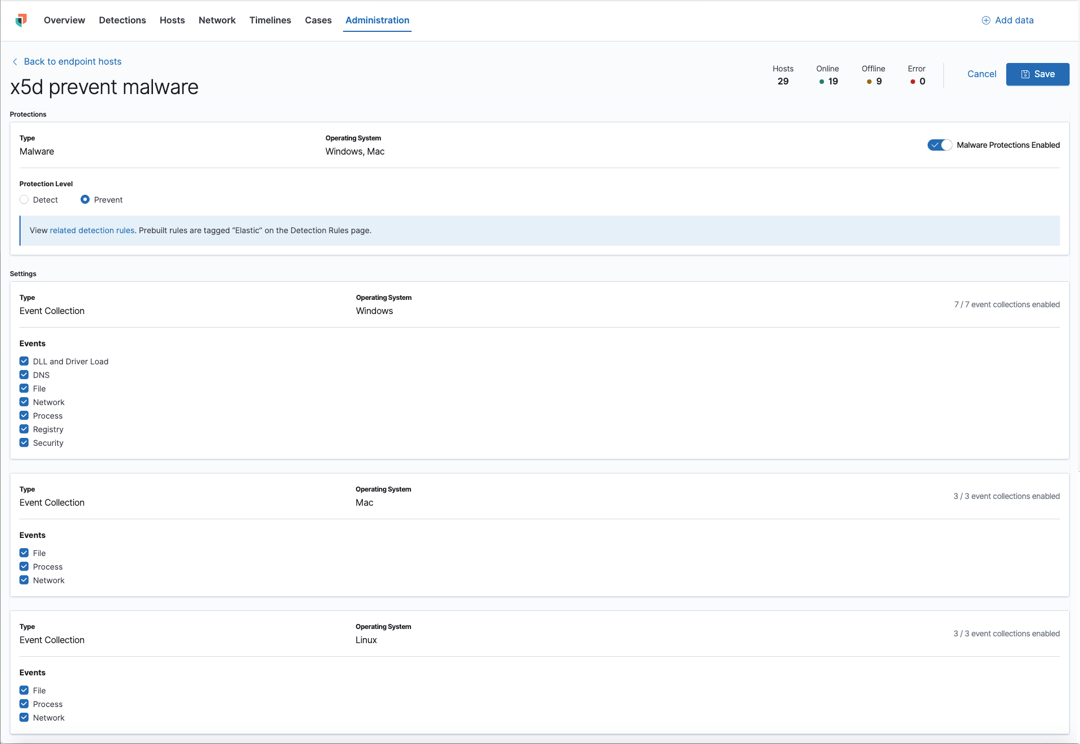
Integration Policy details
To view the Integration Policy page, click the link in the Integration Policy column. If you are viewing host details, you can also click the Integration Policy link on the flyout panel.
On this page, you can view and configure endpoint protection and event collection settings. In the upper-right corner are Key Performance Indicators (KPIs) that provide current endpoint status. If you need to update the Policy, make changes as appropriate, then click the Save button to apply the new changes.
Users must have permission to read/write to Fleet APIs to make changes to the configuration.
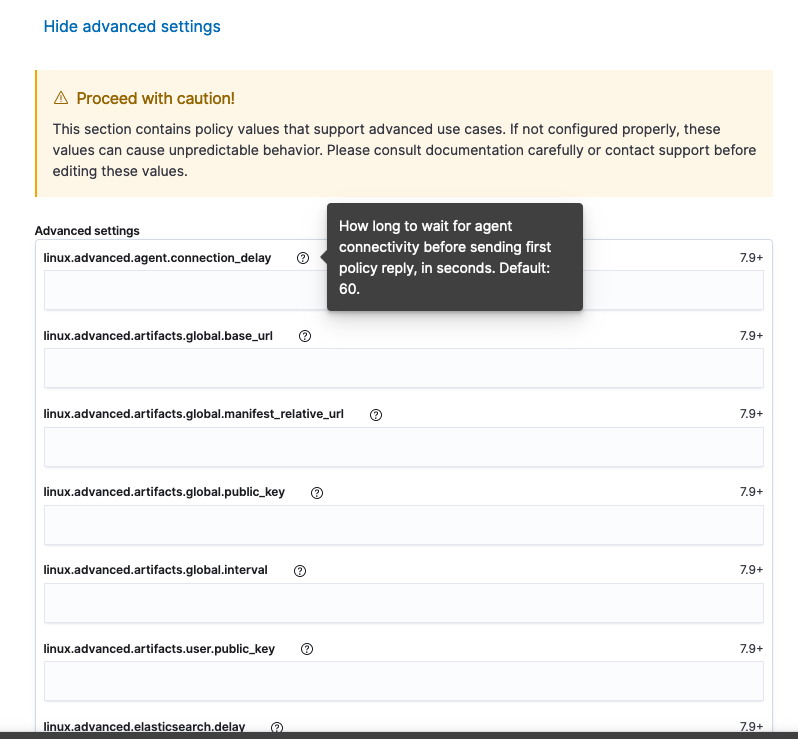
Users who have unique configuration and security requirements can select Show Advanced Settings to configure the Policy to support advanced use cases. Hover over each setting to view its description.
Advanced settings are not recommended for most users.
Policy status
The status of the Policy application appears in the Policy Status column and displays one of the following possibilities:
- Success: The Policy applied successfully.
- Warning or Partially Applied: The Policy is pending application, or the Policy was not applied in its entirety.
In some cases, some actions taken on the endpoint may fail during the Policy application but are not recognized as a critical failure - meaning there may be a failure, but the endpoints are still protected. In this case, the Policy status will display as "Partially Applied."
- Failure: The Policy did not apply correctly. As such, endpoints are not protected.
- Unknown: The user interface is waiting for the API response to return, or, in rare cases, the API returns an undefined error or value.
To view Policy status details, click the link and review the data in the flyout panel. In the following image, you can see that the malware configuration and logging failed, generating a "Failed" Policy status.
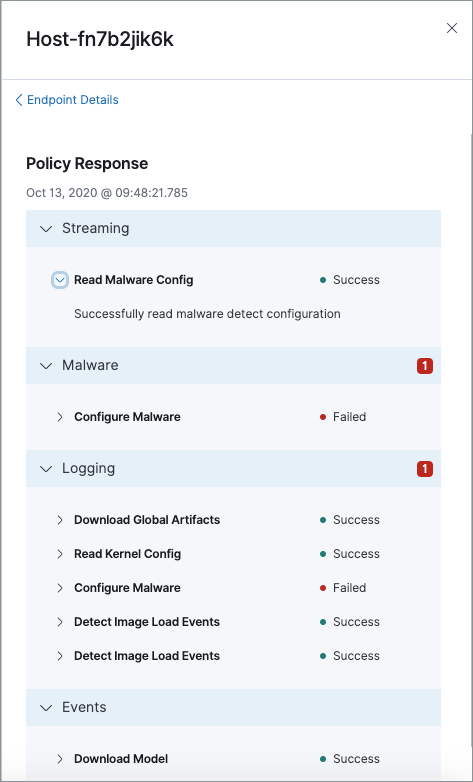
Expand each section and subsection to view individual responses from the agent.
If you need help troubleshooting a configuration failure, see the Fleet troubleshooting topic.
Filter endpoints
To filter the Endpoints list, use the Search bar to enter a query using Kibana Query Language (KQL). To refresh the search results, click Refresh.
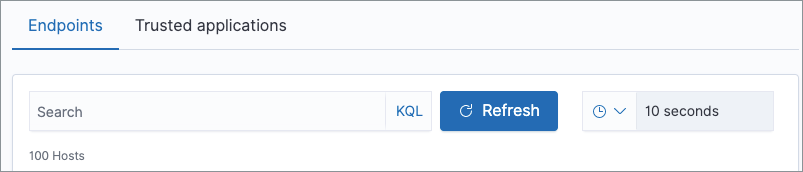
The timepicker on the right side of the page allows you to set a time interval to automatically refresh the Endpoints list — for example, if new endpoints were added or deleted.
Trusted applications
editAdministrators can add Windows, macOS, and Linux applications that should be trusted. By adding these "trusted applications," you can use Elastic Security without compatibility or performance issues with other installed applications on your system. Trusted applications are applied only to hosts running Endpoint Security.
To add a trusted application:
- On the Administration page, select the Trusted applications tab.
- Click Add Trusted Application.
-
Complete the following field requirements in the Trusted Applications dialog:
-
Name your trusted app application: Enter a name for the trusted application. -
Select operating system: Select the appropriate operating system from the drop-down. -
Field: Select the appropriate field you want to use —Hash,Path, or, if you are adding a Windows trusted application,Signature.Hash values must be valid to add the trusted application.
-
Operator: Defaults tois(i.e., "equal to"). This cannot be changed. -
Value: Enter the hash value or file path. To add an additional value, click AND. -
Description(Optional): Enter a description of the trusted application.
-
- Click Add trusted application. If successfully added, the added application appears in the Trusted applications list.
Trusted applications list
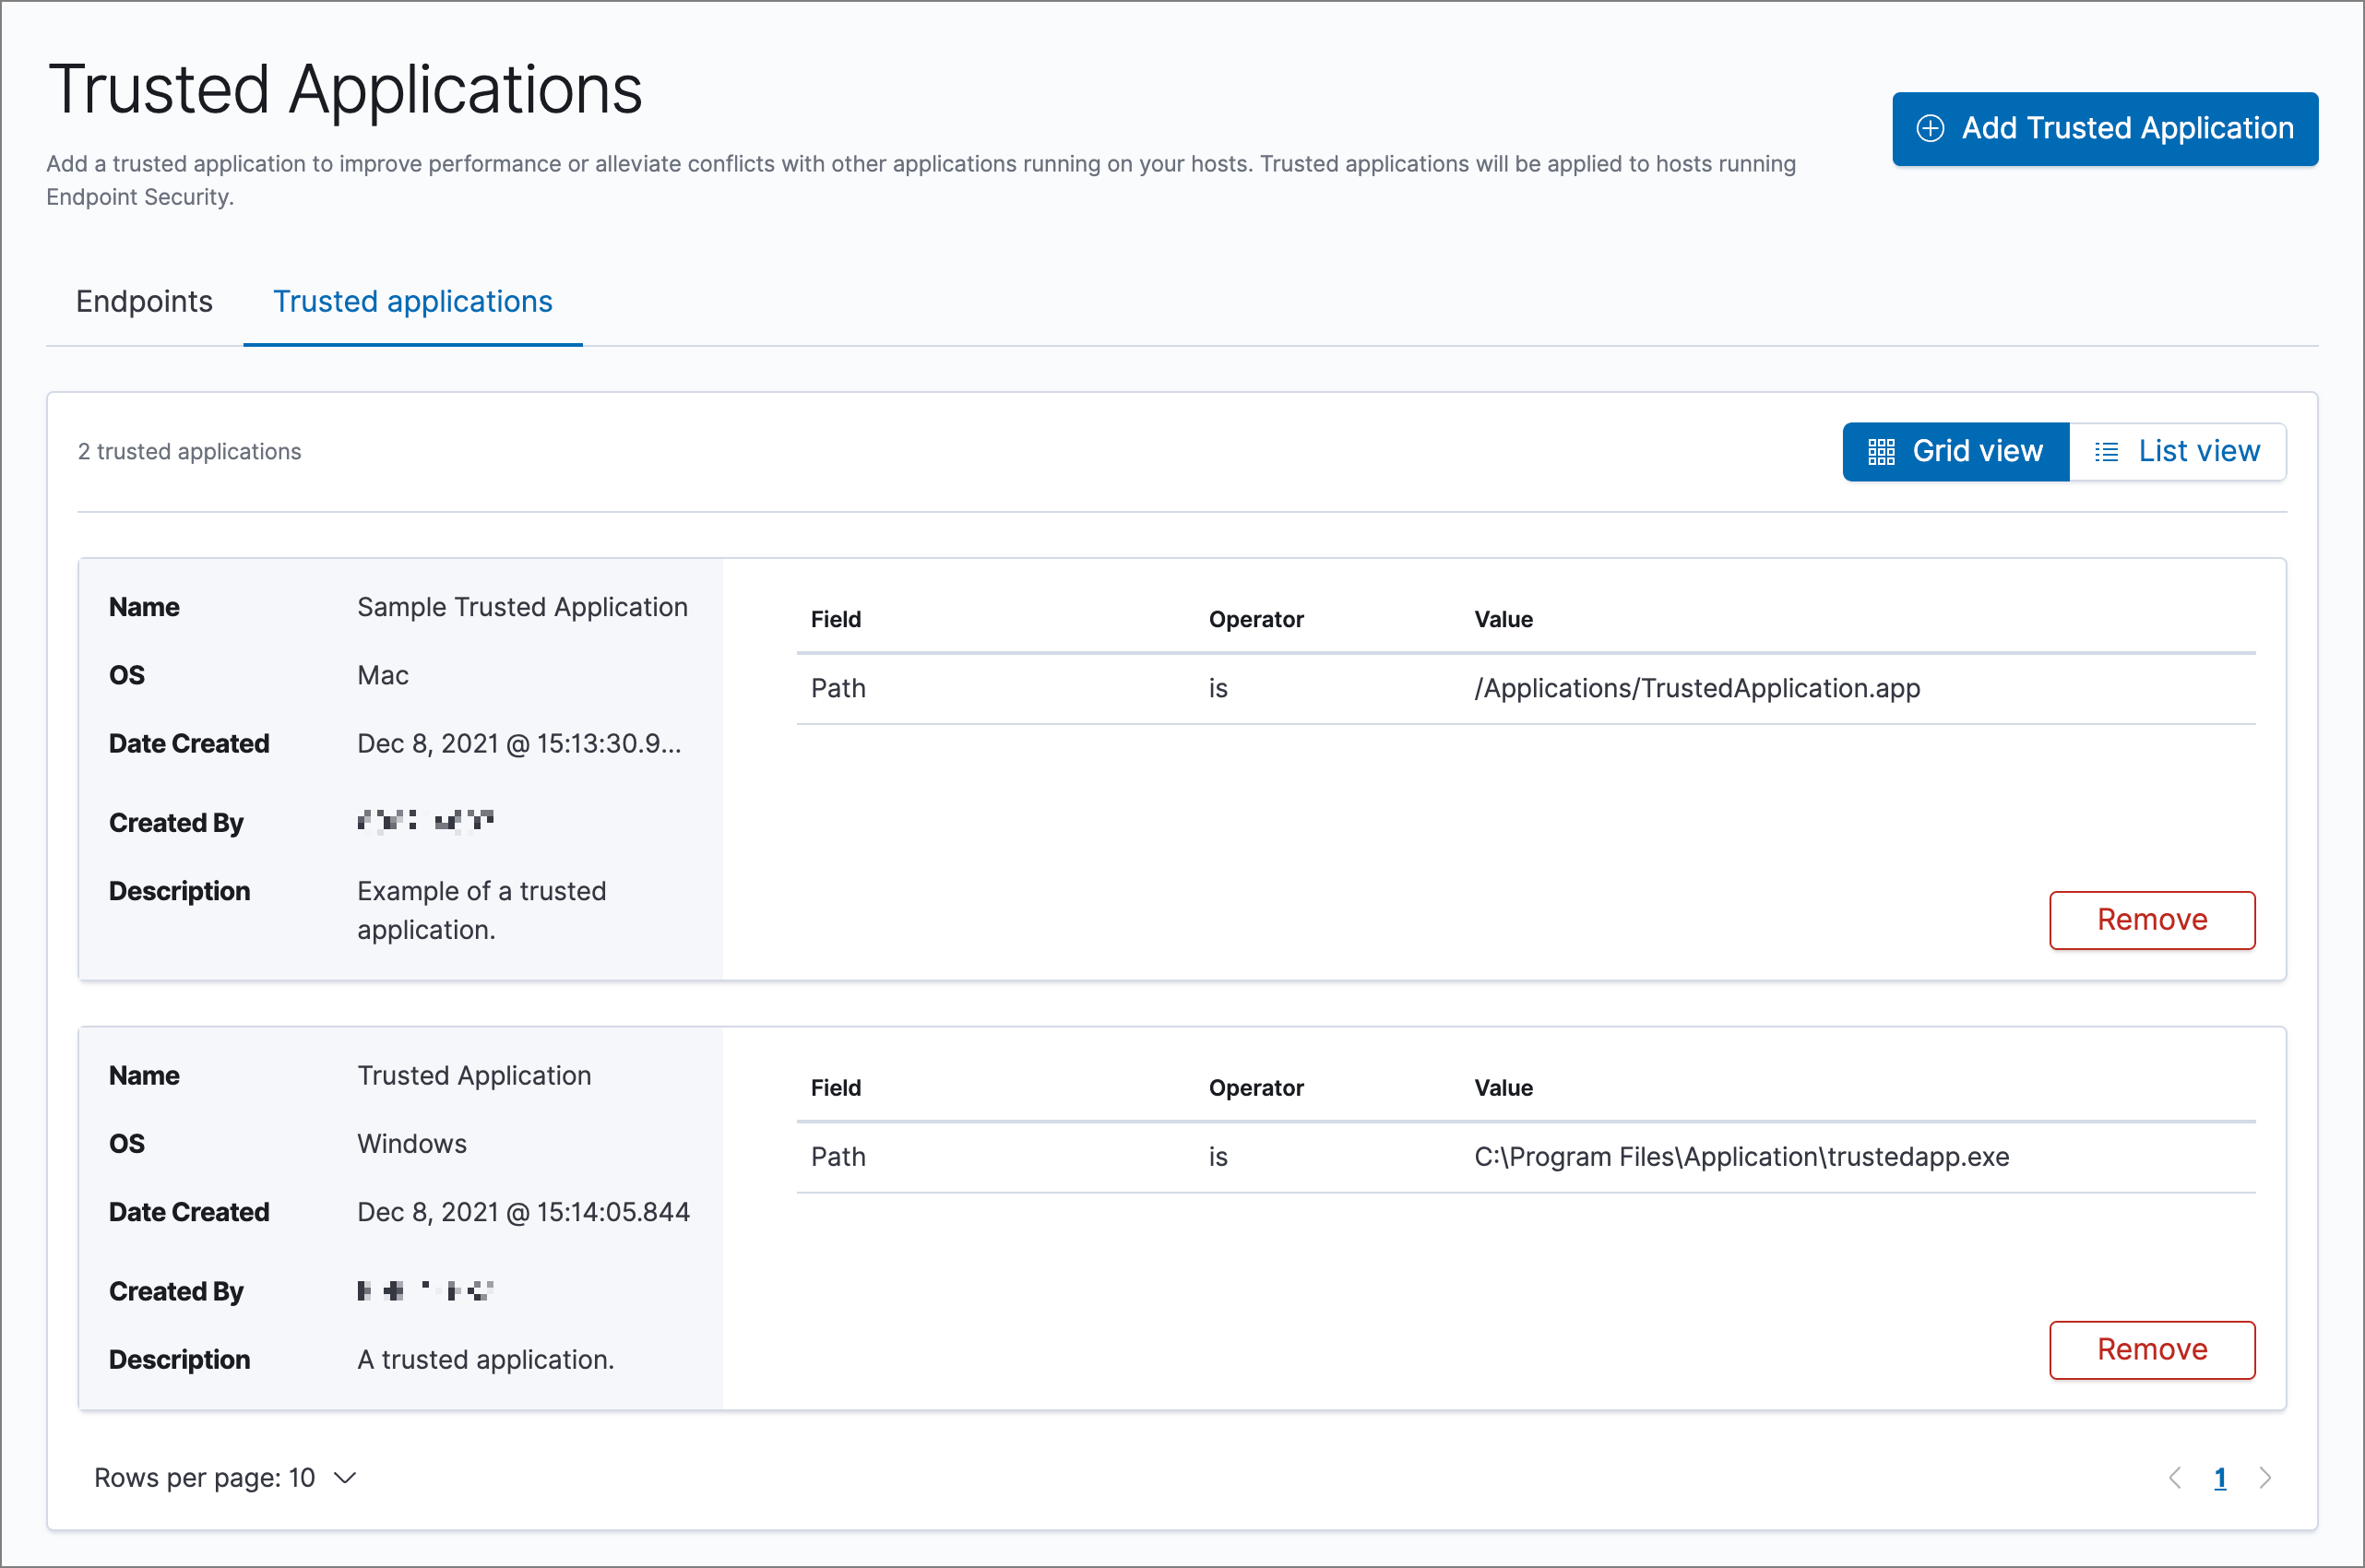
editThe Trusted applications list lists all the trusted applications that have been added to the Elastic Security app. By default, applications appear in Grid view — a comprehensive display of all metadata and field values. To view a condensed version of the list that displays general information, select List view.
In the List view, click the arrow to expand and collapse details.
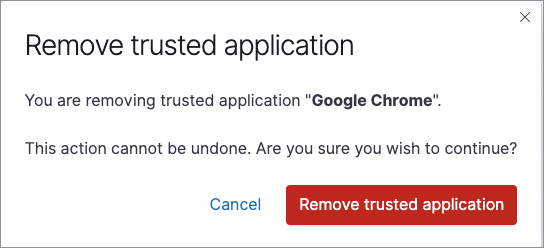
Remove a trusted application
-
If in the Grid view, click Remove on the appropriate application to delete.
If in the List view, click the Remove this entry button that looks like a trash can.
- On the "Remove trusted application" dialog that appears, verify that you are removing the correct application, then click Remove trusted application. A "Successfully removed" confirmation appears.