Monitor Kubernetes: Observe the health and performance of your Kubernetes deployments
editMonitor Kubernetes: Observe the health and performance of your Kubernetes deployments
editApplications running in a containerized environment like Kubernetes pose a unique monitoring challenge: how do you diagnose and resolve issues with hundreds of microservices on thousands (or millions) of containers, running in ephemeral and disposable pods?
A successful Kubernetes monitoring solution has a few requirements:
-
Monitors all layers of your technology stack, including:
- The host systems where Kubernetes is running.
- Kubernetes core components, nodes, pods, and containers running within the cluster.
- All of the applications and services running in Kubernetes containers.
- Automatically detects and monitors services as they appear dynamically.
- Provides a way to correlate related data so that you can group and explore related metrics, logs, and other observability data.
What you’ll learn
editThis guide describes how to use Elastic Observability to observe all layers of your application, including the orchestration software itself:
- Collect logs and metrics from Kubernetes and your applications
- Collect trace data from applications deployed with Kubernetes
- Centralize the data in the Elastic Stack
- Explore the data in real-time using tailored dashboards and Observability UIs
This guide describes how to deploy Elastic monitoring agents as DaemonSets using
kubectl and the Beats GitHub repository manifest files. For other
deployment options, see the Kubernetes operator and custom resource definitions
from Elastic Cloud on Kubernetes (ECK) or the
Helm charts.
Monitoring architecture
editThe Elastic Stack provides 4 main components for monitoring Kubernetes:
- Lightweight agents, called Beats, to collect observability data. Some Beats include preconfigured data collection modules to ease the collection and parsing of data for common applications such as Apache, MySQL, and Kafka.
- APM (described later) to monitor, detect, and diagnose complex application performance issues.
- Elasticsearch for storing and searching your data.
- Observability apps in Kibana for visualizing and managing your observability data.
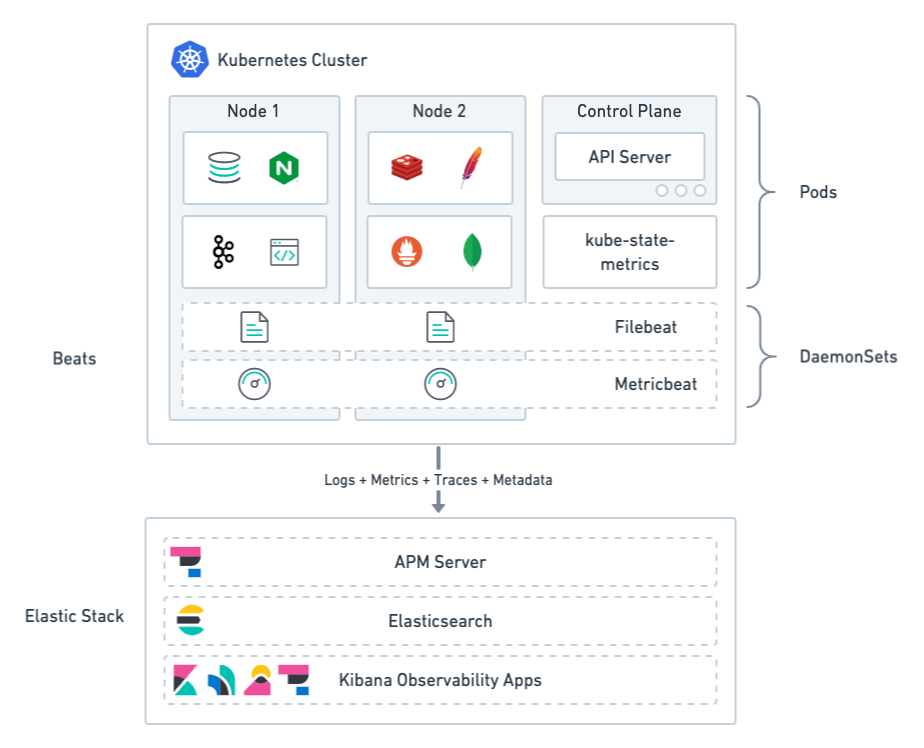
Beats agents are deployed to Kubernetes as DaemonSets. This deployment architecture ensures that the agents are available to capture both system and application-level observability data.
Filebeat: Collects logs from pods, containers, and applications running on Kubernetes.
Filebeat communicates with the Kubernetes API server to retrieve information about the pods running on the host, all the metadata annotations, and the location of the log files.
When autodiscovery is configured, Filebeat automatically discovers what kind of components are running in a pod and applies the logging modules needed to capture logs for those components.
Metricbeat: Collects and preprocesses system and service metrics, such as information about running processes, as well as CPU, memory, disk, and network utilization numbers.
Because Metricbeat runs on each node, it can collect metrics from the Kubelet API. These metrics provide important information about the state of the Kubernetes nodes, pods, containers, and other resources.
For cluster-wide metrics, Metricbeat accesses the kube-state-metrics
service directly or gets metrics scraped by Prometheus.
When hints-based autodiscovery is configured, Metricbeat looks for hints in Kubernetes pod annotations or Docker labels and launches the proper configuration to collect application metrics.
Other Beats (not shown): Collect and process other types of data, such as Uptime data and network traffic.
Metadata
editAll Beats agents provide processors for adding metadata to events. The metadata is valuable for grouping and exploring related data. For example, when you’re analyzing container logs, you want to know the host and container name, and you want to be able to correlate logs, metrics, and traces.
The default deployments include processors, when needed, for enriching events with cloud, Kubernetes, and host metadata.
Now that you have a basic understanding of the monitoring architecture, let’s learn how to deploy monitoring to your Kubernetes environment.
Before you begin
editTo monitor Kubernetes, you need Elasticsearch for storing and searching your observability data, and Kibana for visualizing and managing it. For more information, see Spin up the Elastic Stack.
Part 1: Monitor logs
editCollecting and analyzing logs of both Kubernetes Core components and various applications running on top of Kubernetes is a powerful tool for Kubernetes observability. Containers running within Kubernetes pods publish logs to stdout or stderr. These logs are written to a location known to Kubelet.
To collect pod logs, all you need is Filebeat running as a DaemonSet in your Kubernetes cluster. You configure Filebeat to communicate with the Kubernetes API server, get the list of pods running on the current host, and collect the logs the pods are producing. Those logs are annotated with all the relevant Kubernetes metadata, such as pod ID, container name, container labels and annotations, and so on.
Deploy Filebeat to collect logs
editTo start collecting logs, deploy and run an instance of Filebeat on each Kubernetes host. Filebeat communicates with the Kubernetes API server to retrieve information about the pods running on the host and all the metadata annotations.
To deploy Filebeat to your Kubernetes cluster:
Step 1: Download the Filebeat deployment manifest
editTo make deployment easier, Elastic provides a YAML file that defines all the required deployment settings. In many cases, you can change the connection details and deploy with default settings to get started quickly.
curl -L -O https://raw.githubusercontent.com/elastic/beats/8.2/deploy/kubernetes/filebeat-kubernetes.yaml
Step 2: Set the connection information for Elasticsearch
editBy default Filebeat sends events to an existing Elasticsearch deployment on elasticsearch:9200, if present.
To specify a different destination, change the following settings in the
filebeat-kubernetes.yaml file:
env:
- name: ELASTICSEARCH_HOST
  value: elasticsearch
- name: ELASTICSEARCH_PORT
  value: "9200"
- name: ELASTICSEARCH_USERNAME
  value: elastic
- name: ELASTICSEARCH_PASSWORD
  value: changeme
- name: ELASTIC_CLOUD_ID
  value:
- name: ELASTIC_CLOUD_AUTH
  value:
|
This user must have the privileges required to publish events to Elasticsearch. For more information, see Grant users access to secured resources. |
|
|
Use the cloud settings if you’re sending data to Elasticsearch Service on Elastic Cloud. |
To avoid exposing sensitive data, you can base64 encode the string, then store it in a Kubernetes secret. For example:
$ echo -n 'changeme' | base64
Y2hhbmdlbWU=
$ kubectl create secret generic es-secret --from-literal=password='Y2hhbmdlbWU=' --namespace=kube-system
To use the secret, change the env setting in the manifest file:
env:
- name: ELASTICSEARCH_PASSWORD
  valueFrom:
    secretKeyRef:
      name: es-secret
      key: password
Step 3: Collect container logs
editTo collect container logs, each Filebeat instance needs access to the local log’s path, which is actually a log directory mounted from the host. The default deployment manifest already contains the configuration to do this:
filebeat.inputs:
- type: container
  paths:
    - /var/log/containers/*.log
With this configuration, Filebeat can collect logs from all the files that
exist under the /var/log/containers/ directory.
This configuration assumes you know what kinds of components are running in a pod and where the container logs are stored. Later you’ll learn how to use autodiscovery to automatically discover containers.
Step 4: Add metadata to events
editFilebeat provides processors that you can use in your configuration to enrich events with metadata coming from Docker, Kubernetes, hosts, and cloud providers.
The add_kubernetes_metadata processor is already specified in the default
configuration. This processor adds Kubernetes and container-related metadata to
the logs:
filebeat.inputs:
- type: container
  paths:
    - /var/log/containers/*.log
  processors:
    - add_kubernetes_metadata:
        host: ${NODE_NAME}
        matchers:
        - logs_path:
            logs_path: "/var/log/containers/"
Step 5: Automatically discover container logs (use autodiscovery)
editIn the previous steps, you learned how to collect container logs and enrich them with metadata. However you can take it further by leveraging the autodiscovery mechanism in Filebeat. With autodiscovery, Filebeat can automatically discover what kind of components are running in a pod and apply the logging modules needed to capture logs for those components.
If you decide to use autodiscovery, make sure you remove or comment
out the filebeat.inputs configuration.
To configure autodiscovery, you can use static templates. For example, the
template in this example configures Filebeat to collect Nginx logs from any
pod labeled as app: nginx.
filebeat.autodiscover:
  providers:
    - type: kubernetes
      node: ${NODE_NAME}
      templates:
        - condition:
            equals:
              kubernetes.labels.app: "nginx"
          config:
            - module: nginx
              access:
                input:
                  type: container
                  stream: stdout
                  paths:
                    - /var/log/containers/*${data.kubernetes.container.id}.log
              error:
                input:
                  type: container
                  stream: stderr
                  paths:
                    - /var/log/containers/*${data.kubernetes.container.id}.log
This is good, but requires advanced knowledge of the workloads running in Kubernetes. Each time you want to monitor something new, you’ll need to re-configure and restart Filebeat. To avoid this, you can use hints-based autodiscovery:
filebeat.autodiscover:
  providers:
    - type: kubernetes
      node: ${NODE_NAME}
      hints.enabled: true
      hints.default_config:
        type: container
        paths:
          - /var/log/containers/*${data.kubernetes.container.id}.log
Then annotate the pods accordingly:
apiVersion: v1
kind: Pod
metadata:
  name: nginx-autodiscover
  annotations:
    co.elastic.logs/module: nginx
    co.elastic.logs/fileset.stdout: access
    co.elastic.logs/fileset.stderr: error
With this setup, Filebeat identifies the Nginx app and starts collecting its
logs by using the nginx module.
Step 6: (optional) Drop unwanted events
editYou can enrich your configuration with additional processors to drop unwanted events. For example:
processors:
- drop_event:
      when:
        - equals:
              kubernetes.container.name: "metricbeat"
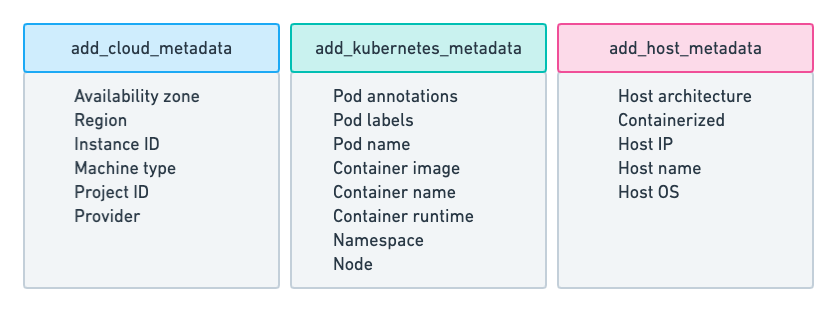
Step 7: Enrich events with cloud metadata and host metadata
editYou can also enrich events with cloud and host metadata by specifying the
add_cloud_metadata and add_host_metadata processors. These processors are
already specified in the default configuration:
processors:
- add_cloud_metadata:
- add_host_metadata:
Step 8: Deploy Filebeat as a DaemonSet on Kubernetes
edit-
If you’re running Filebeat on master nodes, check to see if the nodes use taints. Taints limit the workloads that can run on master nodes. If necessary, update the DaemonSet spec to include tolerations:
spec: tolerations: - key: node-role.kubernetes.io/master effect: NoSchedule -
Deploy Filebeat to Kubernetes:
kubectl create -f filebeat-kubernetes.yaml
To check the status, run:
$ kubectl --namespace=kube-system get ds/filebeat

NAME       DESIRED   CURRENT   READY     UP-TO-DATE   AVAILABLE   NODE-SELECTOR   AGE
filebeat   32        32        0         32           0           <none>          1m
Log events should start flowing to Elasticsearch.
Red Hat OpenShift configuration
editIf you’re using Red Hat OpenShift, you need to specify additional settings in the manifest file and enable the container to run as privileged.
Click to see more
-
Modify the
DaemonSetcontainer spec in the manifest file:securityContext: runAsUser: 0 privileged: true -
Grant the
filebeatservice account access to the privileged SCC:oc adm policy add-scc-to-user privileged system:serviceaccount:kube-system:filebeat
This command enables the container to be privileged as an administrator for OpenShift.
-
Override the default node selector for the
kube-systemnamespace (or your custom namespace) to allow for scheduling on any node:oc patch namespace kube-system -p \ '{"metadata": {"annotations": {"openshift.io/node-selector": ""}}}'This command sets the node selector for the project to an empty string. If you don’t run this command, the default node selector will skip master nodes.
View logs in Kibana
editTo view the log data collected by Filebeat, open Kibana and go to Observability > Logs.
The Logs app in Kibana allows you to search, filter, and tail all the logs collected into the Elastic Stack. Instead of having to ssh into different servers and tail individual files, all the logs are available in one tool under the Logs app.
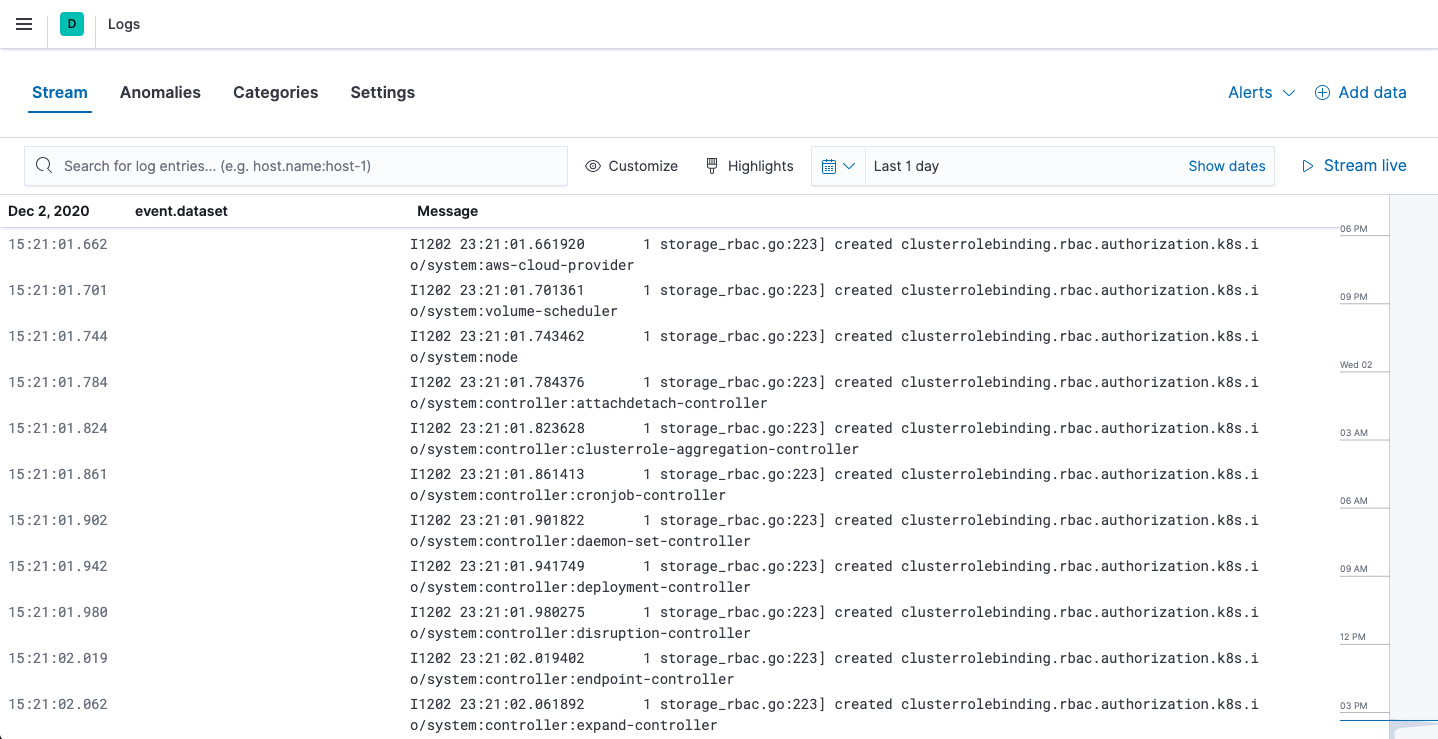
Explore the Logs app:
- Enter a keyword or text string in the search field to filter logs.
- Use the time picker or timeline view on the side to move forward and back in time.
-
Click Stream live to watch the logs update in front of you
tail -fstyle. - Place your cursor over a log message to highlight it, then use the context menu to view details or view the log message in context.
Out-of-the-box Kibana dashboards
editFilebeat ships with a variety of pre-built Kibana dashboards that you can use to visualize logs from Kubernetes Core components and applications running on top of Kubernetes. If these dashboards are not already loaded into Kibana, you must run the Filebeat setup job.
To run the setup job, install Filebeat on any system that can connect to
the Elastic Stack, enable the modules for the datasets you want to monitor, then run
the setup command. To learn how, see the
Filebeat quick start.
After loading the dashboards, navigate to Kibana > Dashboards and search for the services you want to monitor, like MySQL or Nginx.
Notice that modules capture more than logs. You can also use them to capture metrics.
Part 2: Monitor health and performance metrics
editCollecting metrics about Kubernetes clusters and the workloads running on top of them is a key aspect of Kubernetes observability. However, collecting metrics from Kubernetes poses some challenges. You need to collect metrics about the resources running on "physical" machines as well as the containers and pods. Specifically, you need to monitor the health and performance of:
- The hosts where Kubernetes components are running. Each host produces metrics like CPU, memory, disk utilization, and disk and network I/O.
- Kubernetes containers, which produce their own set of metrics.
- The applications running as Kubernetes pods, such as application servers and databases, each producing its own set of metrics.
Instead of using multiple technologies to collect metrics, you deploy Metricbeat to monitor all layers of your technology stack.
Deploy Metricbeat to collect metrics
editYou’ll use Metricbeat to collect metrics from pods running in your Kubernetes cluster as well as metrics from the Kubernetes cluster itself.
Metricbeat modules provide a quick and easy way to pick up metrics from various sources and ship them to Elasticsearch as ECS-compatible events, ready to be correlated with logs, uptime, and APM data.
To deploy Metricbeat to your Kubernetes cluster:
Step 1: Download the Metricbeat deployment manifest
editTo make deployment easier, Elastic provides a YAML file that defines all the required deployment settings. In many cases, you can change the connection details and deploy with default settings to get started quickly.
curl -L -O https://raw.githubusercontent.com/elastic/beats/8.2/deploy/kubernetes/metricbeat-kubernetes.yaml
Step 2: Set the connection information for Elasticsearch
editMetricbeat sends events to an existing Elasticsearch deployment, if present.
To specify a different destination, change the following parameters in the
metricbeat-kubernetes.yaml file:
env:
- name: ELASTICSEARCH_HOST
  value: elasticsearch
- name: ELASTICSEARCH_PORT
  value: "9200"
- name: ELASTICSEARCH_USERNAME
  value: elastic
- name: ELASTICSEARCH_PASSWORD
  value: changeme
- name: ELASTIC_CLOUD_ID
  value:
- name: ELASTIC_CLOUD_AUTH
  value:
|
This user must have the privileges required to publish events to Elasticsearch. For more information, see Grant users access to secured resources. |
|
|
Use the cloud settings if you’re sending data to Elasticsearch Service on Elastic Cloud. |
To avoid exposing sensitive data, you can base64 encode the string, then store it in a Kubernetes secret. For example:
$ echo -n 'changeme' | base64
Y2hhbmdlbWU=
$ kubectl create secret generic es-secret --from-literal=password='Y2hhbmdlbWU=' --namespace=kube-system
To use the secret, change the env setting in the manifest file:
env:
- name: ELASTICSEARCH_PASSWORD
  valueFrom:
    secretKeyRef:
      name: es-secret
      key: password
Step 3: Mount paths
editMetricbeat will run on each node in the cluster as a DaemonSet’s pod. To collect system-level metrics, key paths are mounted from the host to the pod:
- name: proc
  hostPath:
  path: /proc
- name: cgroup
  hostPath:
  path: /sys/fs/cgroup
Step 4: Collect system metrics
editTo collect system-level metrics from the running node, configure the system
module. The metricsets that you’re likely to want are already enabled in the
manifest. Modify the settings as required for your environment:
- module: system
  period: 10s
  metricsets:
    - cpu
    - load
    - memory
    - network
    - process
    - process_summary
Step 5: Collect metrics from each Kubernetes node
editBecause Metricbeat is running on each node, you can collect metrics from the Kubelet API. These metrics provide important information about the state of the Kubernetes node, pods, containers, and other resources.
To collect these metrics, configure the kubernetes module. The metricsets that
you’re likely to want are already enabled in the manifest. Modify the settings
as required for your environment:
- module: kubernetes
  metricsets:
    - node
    - system
    - pod
    - container
    - volume
These metricsets collect metrics from the Kubelet API and therefore require access to the specific endpoints. Depending on the version and configuration of Kubernetes nodes, kubelet might provide a read-only HTTP port (typically 10255), which is used in some configuration examples. But in general, and lately, this endpoint requires SSL (HTTPS) access (to port 10250 by default) and token-based authentication.
Step 6: Collect Kubernetes state metrics
editMetricbeat gets some metrics from
kube-state-metrics.
If kube-state-metrics is not already running, deploy it now. To learn how,
see the Kubernetes deployment
docs.
To collect state metrics:
-
Enable metricsets that begin with the
state_prefix. The metricsets that you’re likely to want are already enabled in the manifest. -
Set the
hostsfield to point to thekube-state-metricsservice within the cluster.
Because the kube-state-metrics service provides cluster-wide metrics, there’s no
need to fetch them per node. To use this singleton approach, Metricbeat
leverages a leader election method, where one pod holds a leader lock and is
responsible for collecting cluster-wide metrics. For more information about
leader election settings, see
Autodiscover.
metricbeat.autodiscover:
    providers:
    - type: kubernetes
      scope: cluster
      node: ${NODE_NAME}
      unique: true
      templates:
        - config:
            - module: kubernetes
              hosts: ["kube-state-metrics:8080"]
              period: 10s
              add_metadata: true
              metricsets:
                - state_node
                - state_deployment
                - state_daemonset
                - state_replicaset
                - state_pod
                - state_container
                - state_cronjob
                - state_resourcequota
                - state_statefulset
If your Kubernetes cluster contains a large number of large nodes, the pod that collects cluster-level metrics might face performance issues caused by resource limitations. In this case, avoid using the leader election strategy and instead run a dedicated, standalone Metricbeat instance using a Deployment in addition to the DaemonSet.
Step 7: Collect application-specific metrics (use hint-based autodiscovery)
editMetricbeat supports autodiscovery based on hints from the provider. The hints
system looks for hints in Kubernetes pod annotations or Docker labels that have
the prefix co.elastic.metrics. When a container starts, Metricbeat checks
for hints and launches the proper configuration. The hints tell Metricbeat how
to get metrics for the given container. To enable hint-based autodiscovery, set
hints.enabled: true:
metricbeat.autodiscover:
  providers:
    - type: kubernetes
      hints.enabled: true
By labeling Kubernetes pods with the co.elastic.metrics prefix you can signal Metricbeat to collect metrics from those pods using the appropriate modules:
apiVersion: v1
kind: Pod
metadata:
    name: nginx-autodiscover
    annotations:
        co.elastic.metrics/module: nginx
        co.elastic.metrics/metricsets: stubstatus
        co.elastic.metrics/hosts: '${data.host}:80'
        co.elastic.metrics/period: 10s
Step 8: Collect metrics from Prometheus
editTo enrich your collection resources, you can use the prometheus module to
collect metrics from every application that runs on the cluster and exposes a
Prometheus exporter. For instance, let’s say that the cluster runs multiple
applications that expose Prometheus metrics with the default Prometheus
standards. Assuming these applications are annotated properly, you can define
an extra autodiscovery provider to automatically identify the applications and
start collecting exposed metrics by using the prometheus module:
metricbeat.autodiscover:
  providers:
    - type: kubernetes
      include_annotations: ["prometheus.io.scrape"]
      templates:
        - condition:
            contains:
              kubernetes.annotations.prometheus.io/scrape: "true"
          config:
            - module: prometheus
              metricsets: ["collector"]
              hosts: "${data.host}:${data.port}"
This configuration launches a prometheus module for all containers of pods
annotated with prometheus.io/scrape: "true".
Step 9: Add metadata to events
editMetricbeat provides processors that you can use in your configuration to enrich events with metadata coming from Docker, Kubernetes, hosts, and cloud providers.
The add_cloud_metadata and add_host_metadata processors are already
specified in the default configuration:
processors:
- add_cloud_metadata:
- add_host_metadata:
This metadata allows correlation of metrics with the hosts, Kubernetes pods, Docker containers, and cloud-provider infrastructure metadata and with other pieces of observability puzzle, such as application performance monitoring data and logs.
Step 10: Deploy Metricbeat as a DaemonSet on Kubernetes
editTo deploy Metricbeat to Kubernetes, run:
kubectl create -f metricbeat-kubernetes.yaml
To check the status, run:
$ kubectl --namespace=kube-system  get ds/metricbeat

NAME       DESIRED   CURRENT   READY     UP-TO-DATE   AVAILABLE   NODE-SELECTOR   AGE
metricbeat   32        32        0         32           0           <none>          1m
Metrics should start flowing to Elasticsearch.
Red Hat OpenShift configuration
editIf you’re using Red Hat OpenShift, you need to specify additional settings in the manifest file and enable the container to run as privileged.
Click to see more
-
Modify the
DaemonSetcontainer spec in the manifest file:securityContext: runAsUser: 0 privileged: true -
In the manifest file, edit the
metricbeat-daemonset-modulesConfigMap, and specify the following settings underkubernetes.ymlin the data section:kubernetes.yml: |- - module: kubernetes metricsets: - node - system - pod - container - volume period: 10s host: ${NODE_NAME} hosts: ["https://${NODE_NAME}:10250"] bearer_token_file: /var/run/secrets/kubernetes.io/serviceaccount/token ssl.certificate_authorities: - /path/to/kubelet-service-ca.crtkubelet-service-ca.crtcan be any CA bundle that contains the issuer of the certificate used in the Kubelet API. According to each specific installation of OpenShift this can be found either in secrets or in ConfigMaps. In some installations it can be available as part of the service account secret, in/var/run/secrets/kubernetes.io/serviceaccount/service-ca.crt. If you’re using the OpenShift installer for GCP then the following ConfigMap can be mounted in Metricbeat pod and useca-bundle.crtinssl.certificate_authorities:Name: kubelet-serving-ca Namespace: openshift-kube-apiserver Labels: <none> Annotations: <none> Data ==== ca-bundle.crt:
-
Under the
metricbeatClusterRole, add the following resources:- nodes/metrics - nodes/stats
-
Grant the
metricbeatservice account access to the privileged SCC:oc adm policy add-scc-to-user privileged system:serviceaccount:kube-system:filebeat
This command enables the container to be privileged as an administrator for OpenShift.
-
Override the default node selector for the
kube-systemnamespace (or your custom namespace) to allow for scheduling on any node:oc patch namespace kube-system -p \ '{"metadata": {"annotations": {"openshift.io/node-selector": ""}}}'This command sets the node selector for the project to an empty string. If you don’t run this command, the default node selector will skip master nodes.
View performance and health metrics
editTo view the performance and health metrics collected by Metricbeat, open Kibana and go to Observability > Metrics.
On the Inventory page, you can switch between different views to see an overview of the containers and pods running on Kubernetes:
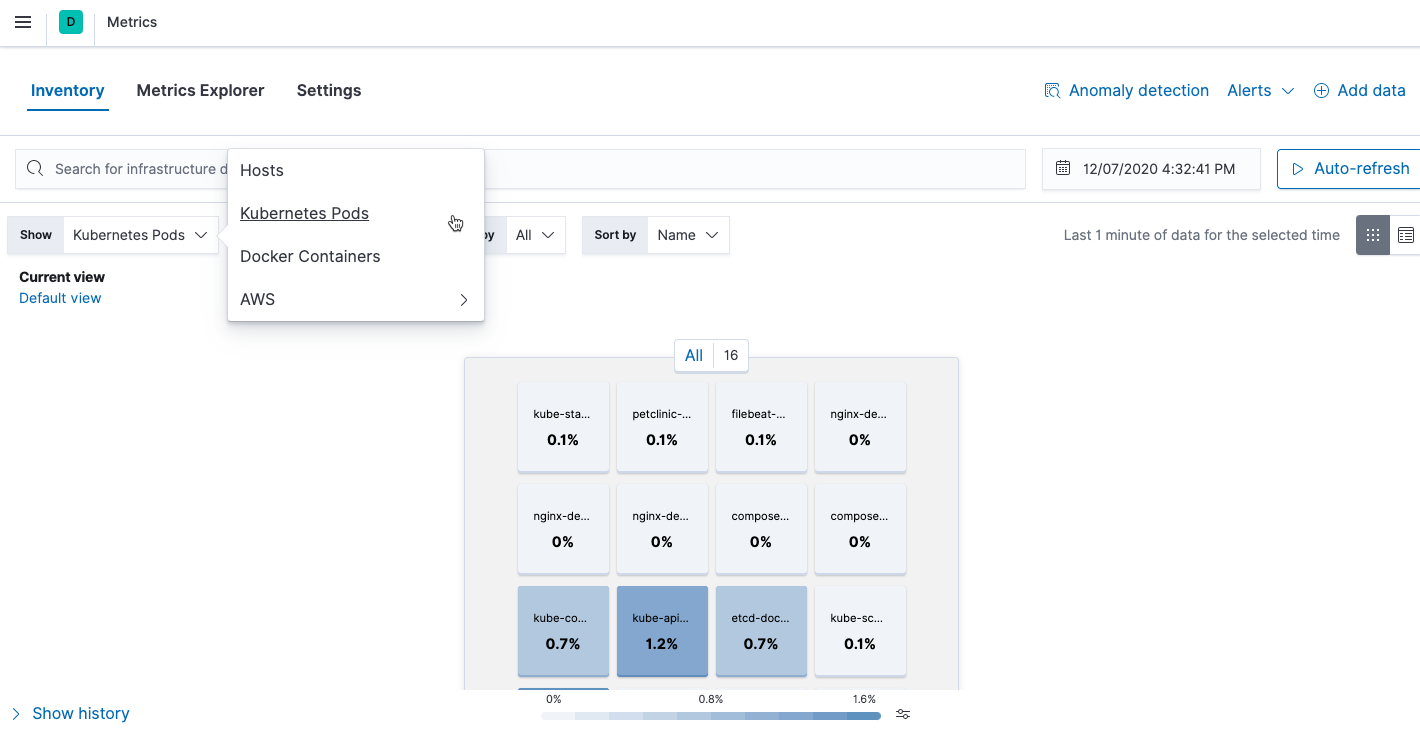
On the Metrics Explorer page, you can group and analyze metrics for the resources that you are monitoring.
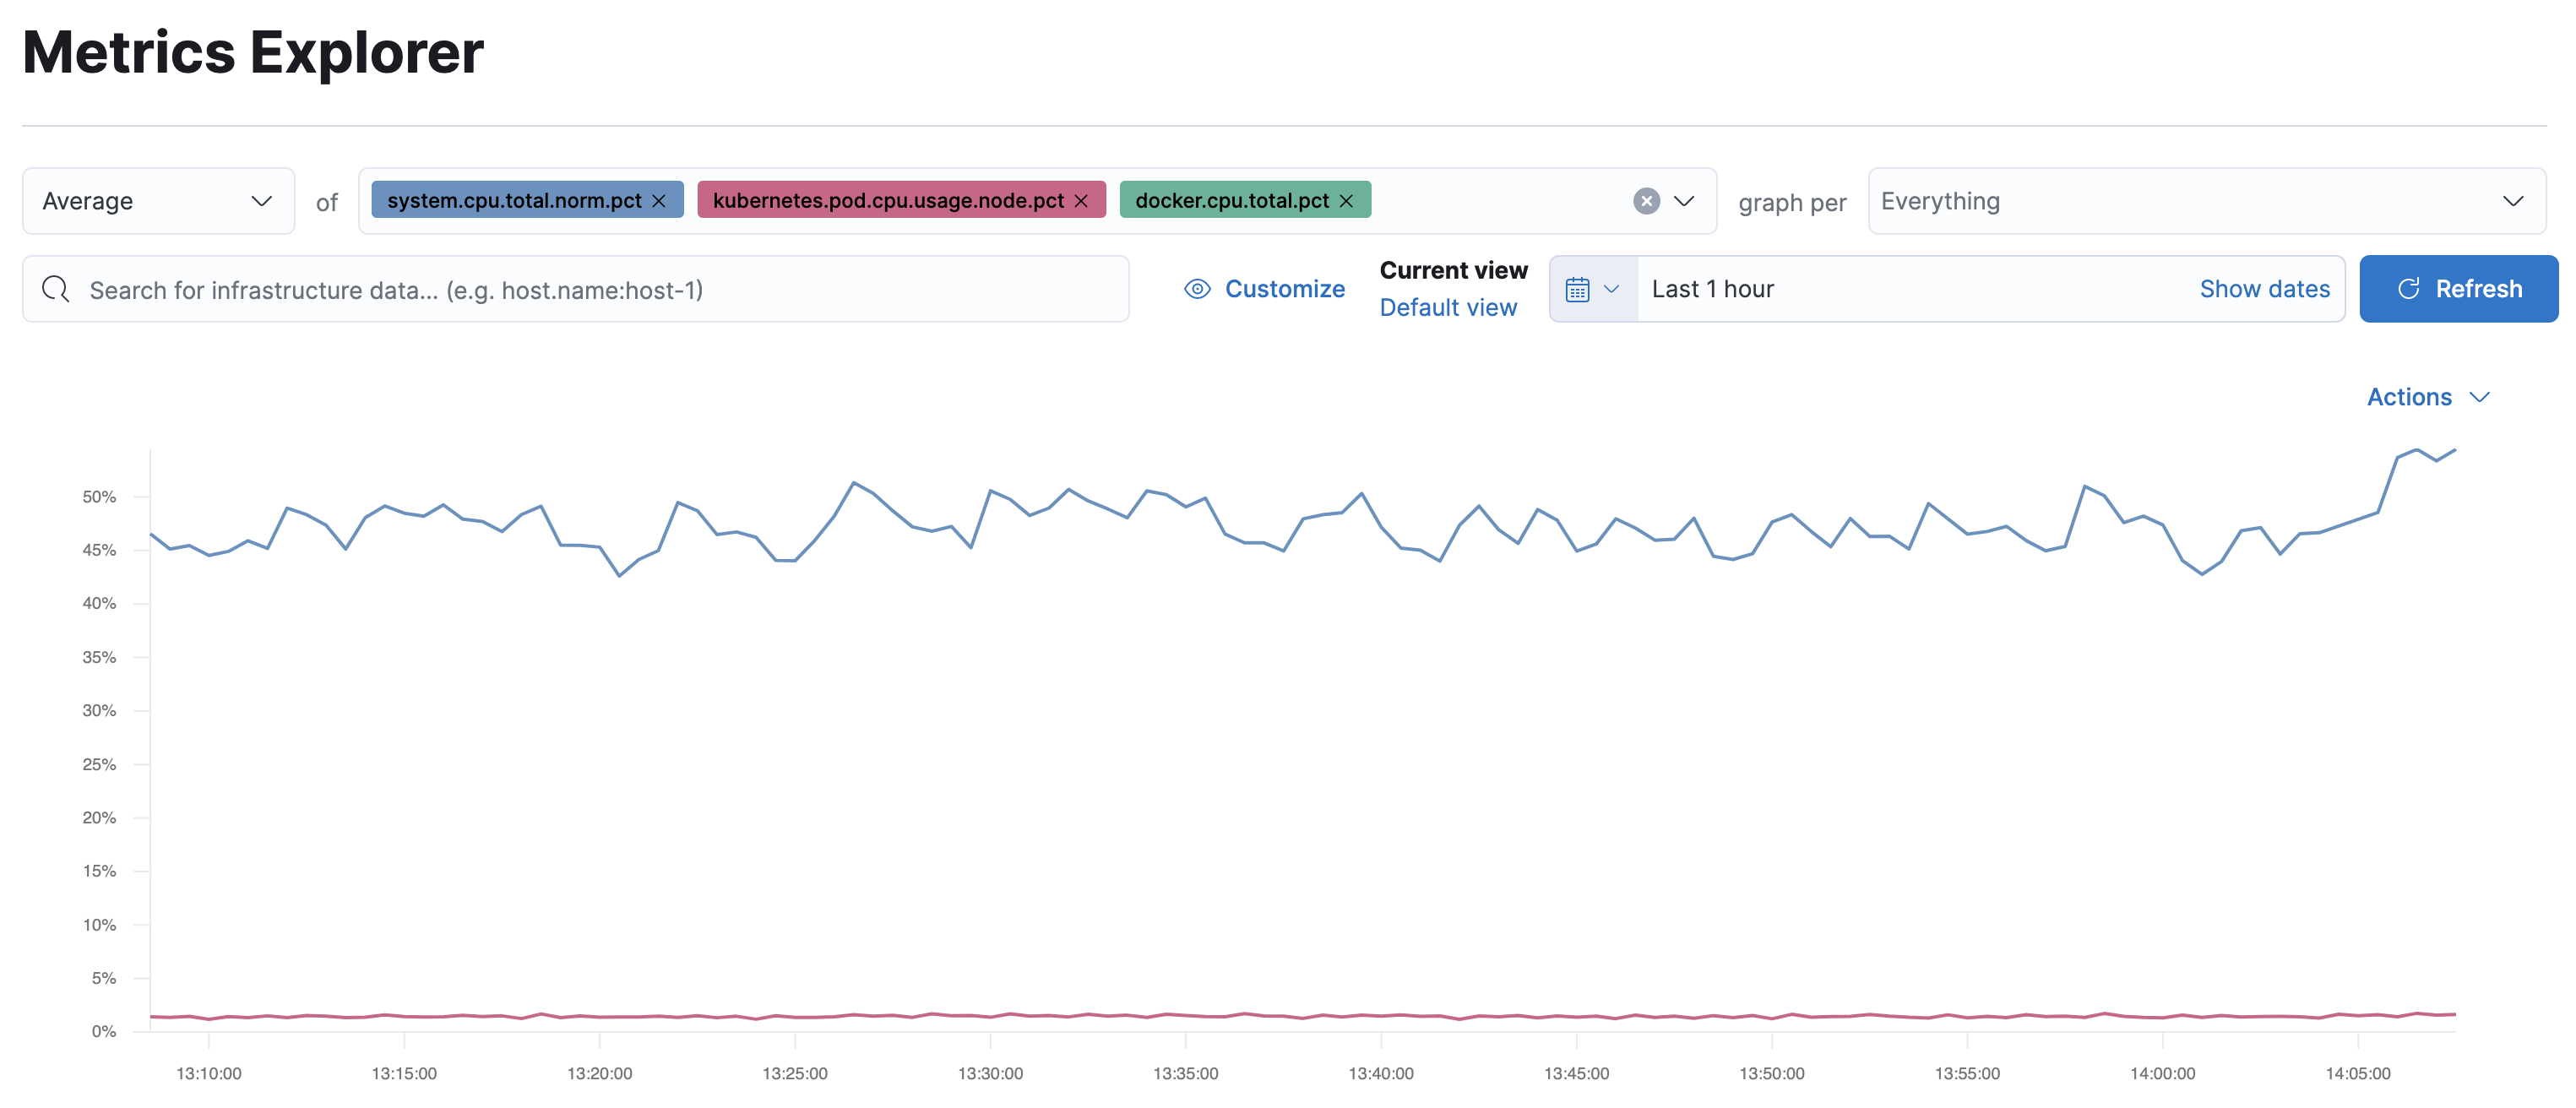
Notice how everywhere you go in Kibana, there is a search bar that allows you to, you know, search for things. It’s a great way to filter views and zoom into things when you’re looking for that needle in a haystack.
Out-of-the-box Kibana dashboards
editMetricbeat ships with a variety of pre-built Kibana dashboards that you can use to visualize metrics about your Kubernetes environment. If these dashboards are not already loaded into Kibana, you must run the Metricbeat setup job.
To run the setup job, install Metricbeat on any system that can connect to
the Elastic Stack, enable the modules for the metricsets you want to monitor, then run
the setup command. To learn how, see the
Metricbeat quick start.
On the Kubernetes overview dashboard, you can see an overview of all the nodes, deployments, and pods running on your Kubernetes cluster:
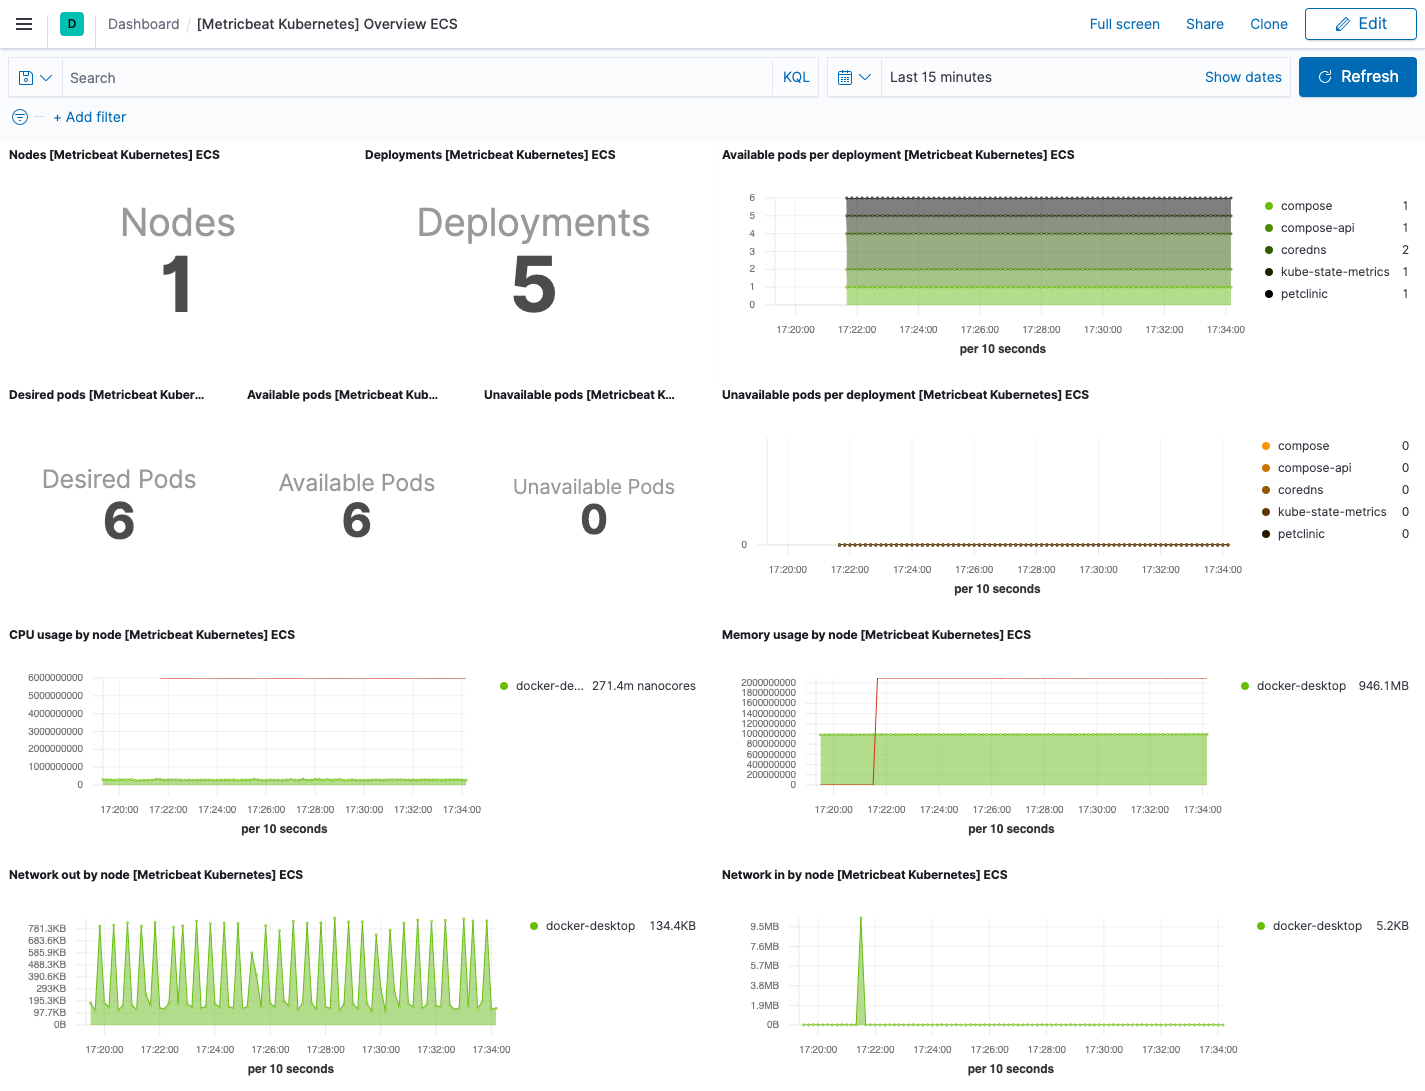
You can use these dashboards as they are, or as a starting point for custom dashboards tailored to your needs.
Part 3: Monitor application performance
editQuickly triage and troubleshoot application performance problems with the help of Elastic application performance monitoring (APM).
Think of a latency spike — APM can help you narrow the scope of your investigation to a single service. Because you’ve also ingested and correlated logs and metrics, you can then link the problem to CPU and memory utilization or error log entries of a particular Kubernetes pod.
Step 1: Set up APM Server
editApplication monitoring data is streamed from your applications running in Kubernetes to APM Server, where it is validated, processed, and transformed into Elasticsearch documents.
There are many ways to deploy APM Server when working with Kubernetes, but this guide assumes that you’re using our hosted Elasticsearch Service on Elastic Cloud. If you haven’t done so already, enable APM Server in the Elasticsearch Service console.
If you want to manage APM Server yourself, there are a few alternative options:
Expand alternatives
- Elastic Cloud on Kubernetes (ECK) — The Elastic recommended approach for managing APM Server deployed with Kubernetes. Built on the Kubernetes Operator pattern, ECK extends basic Kubernetes orchestration capabilities to support the setup and management of APM Server on Kubernetes.
- Deploy APM Server as a DaemonSet — Ensure a running instance of APM Server on each node in your cluster. Useful when all pods in a node should share a single APM Server instance.
- Deploy APM Server as a sidecar — For environments that should not share an APM Server, like when directing traces from multiple applications to separate Elasticsearch clusters.
- Download and install APM Server — The classic, non-Kubernetes option.
Step 2: Save your secret token
editA secret token is used to secure communication between APM agents and APM Server. On the Elastic Cloud deployment page, select APM and copy your APM Server secret token. To avoid exposing the secret token, you can store it in a Kubernetes secret. For example:
kubectl create secret generic apm-secret --from-literal=ELASTIC_APM_SECRET_TOKEN=asecretpassword --namespace=kube-system
If you’re managing APM Server yourself, see secret token for instructions on how to set up your secret token.
If you are using ECK to set up APM Server, the operator automatically generates an {APM-server-name}-apm-token secret for you.
Step 3: Install and configure APM Agents
editIn most cases, setting up APM agents and thereby instrumenting your applications is as easy as installing a library and adding a few lines of code.
Select your application’s language for details:
Install the agent
Install the APM agent packages for Go.
go get go.elastic.co/apm
Instrument your application
Instrument your Go application by using one of the provided instrumentation modules or by using the tracer API directly.
import (
	"net/http"

	"go.elastic.co/apm/module/apmhttp"
)

func main() {
	mux := http.NewServeMux()
	...
	http.ListenAndServe(":8080", apmhttp.Wrap(mux))
}
Configure the agent
Configure the agent using environment variables:
        # ...
        - name: ELASTIC_APM_SERVER_URL
          value: "apm-server-url-goes-here"
        - name: ELASTIC_APM_SECRET_TOKEN
          valueFrom:
            secretKeyRef:
              name: apm-secret
              key: ELASTIC_APM_SECRET_TOKEN
        - name: ELASTIC_APM_SERVICE_NAME
          value: "service-name-goes-here"
|
Defaults to |
|
|
Pass in |
|
|
Allowed characters: a-z, A-Z, 0-9, -, _, and space |
Learn more in the agent reference
Attach the agent
The Java agent can instrument supported technologies without any changes to an application image or code. To do this, you’ll need an init container based on an official Elastic APM docker image.
Before your application starts, copy the agent from the init container into a shared volume. For example, with the Java agent:
    # ...
    spec:
      volumes:
      - name: elastic-apm-agent
        emptyDir: {}
      initContainers:
      - name: elastic-java-agent
        image: docker.elastic.co/observability/apm-agent-java:1.12.0
        volumeMounts:
        - mountPath: /elastic/apm/agent
          name: elastic-apm-agent
        command: ['cp', '-v', '/usr/agent/elastic-apm-agent.jar', '/elastic/apm/agent']
|
The shared volume |
|
|
Build the |
|
|
Copy the agent to the shared volume |
The Java command line needs a way to pick up this javaagent configuration.
You can use the standard JVM TI JAVA_TOOL_OPTIONS environment variable to do this.
It doesn’t have to be explicitly specified and is picked up automatically by the JVM when it starts.
For JVMs that don’t support this option, you can use any other environment variable — either one already defined in your startup script, like JAVA_OPTS in some servlet container scripts,
or add a dedicated empty one that will have no effect if it’s not set.
      # ...
      containers:
      - name: your-app-container
        env:
        # ...
        - name: JAVA_TOOL_OPTIONS
          value: -javaagent:/elastic/apm/agent/elastic-apm-agent.jar
Configure the agent
Configure the agent using environment variables:
        # ...
        - name: ELASTIC_APM_SERVER_URLS
          value: "apm-server-url-goes-here"
        - name: ELASTIC_APM_SECRET_TOKEN
          valueFrom:
            secretKeyRef:
              name: apm-secret
              key: ELASTIC_APM_SECRET_TOKEN
        - name: ELASTIC_APM_SERVICE_NAME
          value: "service-name-goes-here"
        - name: ELASTIC_APM_APPLICATION_PACKAGES
          value: "org.springframework.samples.petclinic"
        - name: JAVA_TOOL_OPTIONS
          value: -javaagent:/elastic/apm/agent/elastic-apm-agent.jar
|
Defaults to |
|
|
Pass in |
|
|
Allowed characters: a-z, A-Z, 0-9, -, _, and space |
|
|
Used to determine whether a stack trace frame is an in-app frame or a library frame. |
|
|
Explained previously |
Learn more in the agent reference
These instructions are for .NET Core v2.2+. All other use-cases require downloading the agent from NuGet and adding it to your application. See set up the Agent for full details. Once agent set-up is complete, jump to the Configure the agent section on this page.
Use an init container to download and extract the agent
The .Net agent automatically instruments .NET Core version 2.2 and newer without any application code changes. To do this, you’ll need an init container that pulls and unzips the latest agent release:
    # ...
    spec:
      volumes:
      - name: elastic-apm-agent
        emptyDir: {}
      initContainers:
      - name: elastic-dotnet-agent
        image: busybox
        command: ["/bin/sh","-c"]
        args:
          - wget -qO './elastic-apm-agent/ElasticApmAgent.zip' https://github.com/elastic/apm-agent-dotnet/releases/download/1.7.0/ElasticApmAgent_1.7.0.zip;
            cd elastic-apm-agent;
            cat ElasticApmAgent.zip | busybox unzip -;
        volumeMounts:
        - mountPath: /elastic-apm-agent
          name: elastic-apm-agent
|
The shared volume. |
|
|
Runs a shell and executes the provided |
|
|
Gets the latest |
To connect the agent to your application, point the DOTNET_STARTUP_HOOKS environment
variable towards ElasticApmAgentStartupHook.dll file that now exists in the
/elastic-apm-agent directory of the elastic-apm-agent volume.
      # ...
      containers:
      - name: your-app-container
        volumeMounts:
        - mountPath: /elastic-apm-agent
          name: elastic-apm-agent
        env:
        # ...
        - name: DOTNET_STARTUP_HOOKS
          value: "/elastic-apm-agent/ElasticApmAgentStartupHook.dll"
Configure the agent
Configure the agent using environment variables:
        # ...
        - name: ELASTIC_APM_SERVER_URLS
          value: "apm-server-url-goes-here"
        - name: ELASTIC_APM_SECRET_TOKEN
          valueFrom:
            secretKeyRef:
              name: apm-secret
              key: ELASTIC_APM_SECRET_TOKEN
        - name: ELASTIC_APM_SERVICE_NAME
          value: "service-name-goes-here"
        - name: DOTNET_STARTUP_HOOKS
          value: "/elastic-apm-agent/ElasticApmAgentStartupHook.dll"
|
Defaults to |
|
|
Pass in |
|
|
Allowed characters: a-z, A-Z, 0-9, -, _, and space |
|
|
Explained previously and only required when using the no-code instrumentation method. |
Learn more in the agent reference
Install the APM agent
Install the APM agent for Node.js as a dependency to your application.
npm install elastic-apm-node --save
Start the agent
It’s important that the agent is started before you require any other modules in your Node.js application — before express, http, etc.
var apm = require('elastic-apm-node').start()
Configure the agent
Configure the agent using environment variables:
        # ...
        - name: ELASTIC_APM_SERVER_URL
          value: "apm-server-url-goes-here"
        - name: ELASTIC_APM_SECRET_TOKEN
          valueFrom:
            secretKeyRef:
              name: apm-secret
              key: ELASTIC_APM_SECRET_TOKEN
        - name: ELASTIC_APM_SERVICE_NAME
          value: "service-name-goes-here"
|
Defaults to |
|
|
Pass in |
|
|
Allowed characters: a-z, A-Z, 0-9, -, _, and space |
Learn more in the agent reference
Install the agent
Install the PHP agent using one of the published packages.
To use the RPM Package (RHEL/CentOS and Fedora):
rpm -ivh <package-file>.rpm
To use the DEB package (Debian and Ubuntu):
dpkg -i <package-file>.deb
To use the APK package (Alpine):
apk add --allow-untrusted <package-file>.apk
If you can’t find your distribution, you can install the agent by building it from the source.
Configure the agent
Configure the agent using environment variables:
        # ...
        - name: ELASTIC_APM_SERVER_URL
          value: "apm-server-url-goes-here"
        - name: ELASTIC_APM_SECRET_TOKEN
          valueFrom:
            secretKeyRef:
              name: apm-secret
              key: ELASTIC_APM_SECRET_TOKEN
        - name: ELASTIC_APM_SERVICE_NAME
          value: "service-name-goes-here"
|
Defaults to |
|
|
Pass in |
|
|
Allowed characters: a-z, A-Z, 0-9, -, _, and space |
Learn more in the agent reference
Install the APM agent
Install the APM agent for Python as a dependency:
# Django
pip install elastic-apm

# Flask
pip install elastic-apm[flask]
Add the agent to your application
For Django, Add elasticapm.contrib.django to INSTALLED_APPS in your settings:
INSTALLED_APPS = (
   # ...
   'elasticapm.contrib.django',
)
For Flask, initialize the agent for your application using environment variables:
from elasticapm.contrib.flask import ElasticAPM

app = Flask(__name__)

apm = ElasticAPM(app)
Configure the agent
Configure the agent using environment variables:
        # ...
        - name: ELASTIC_APM_SERVER_URL
          value: "apm-server-url-goes-here"
        - name: ELASTIC_APM_SECRET_TOKEN
          valueFrom:
            secretKeyRef:
              name: apm-secret
              key: ELASTIC_APM_SECRET_TOKEN
        - name: ELASTIC_APM_SERVICE_NAME
          value: "service-name-goes-here"
|
Defaults to |
|
|
Pass in |
|
|
Allowed characters: a-z, A-Z, 0-9, -, _, and space |
Learn more in the agent reference
Install the APM agent
Add the agent to your Gemfile.
gem 'elastic-apm'
Start the agent
Rails: APM will automatically start when your app boots.
Rack: Include the middleware and start and stop Elastic APM:
# config.ru

app = lambda do |env|
  [200, {'Content-Type' => 'text/plain'}, ['ok']]
end

# Wraps all requests in transactions and reports exceptions
use ElasticAPM::Middleware

# Start an instance of the Agent
ElasticAPM.start()

run app

# Gracefully stop the agent when process exits.
# Makes sure any pending transactions have already sent.
at_exit { ElasticAPM.stop }
Configure the agent
Configure the agent using environment variables:
        # ...
        - name: ELASTIC_APM_SERVER_URL
          value: "apm-server-url-goes-here"
        - name: ELASTIC_APM_SECRET_TOKEN
          valueFrom:
            secretKeyRef:
              name: apm-secret
              key: ELASTIC_APM_SECRET_TOKEN
        - name: ELASTIC_APM_SERVICE_NAME
          value: "service-name-goes-here"
|
Defaults to |
|
|
Pass in |
|
|
Allowed characters: a-z, A-Z, 0-9, -, _, and space |
Learn more in the agent reference
Step 4: Configure Kubernetes data
editIn most instances, APM agents automatically read Kubernetes data from inside the container and send it to APM Server. If this is not the case, or if you wish to override this data, you can set environment variables for the agents to read. These environment variable are set via the Downward API in your Kubernetes pod spec:
      # ...
      containers:
      - name: your-app-container
        env:
        # ...
        - name: KUBERNETES_NODE_NAME
          valueFrom:
            fieldRef:
              fieldPath: spec.nodeName
        - name: KUBERNETES_POD_NAME
          valueFrom:
            fieldRef:
              fieldPath: metadata.name
        - name: KUBERNETES_NAMESPACE
          valueFrom:
            fieldRef:
              fieldPath: metadata.namespace
        - name: KUBERNETES_POD_UID
          valueFrom:
            fieldRef:
              fieldPath: metadata.uid
The table below maps these environment variables to the APM metadata event field:
| Environment variable | Metadata field name |
|---|---|
|
system.kubernetes.node.name |
|
system.kubernetes.pod.name |
|
system.kubernetes.namespace |
|
system.kubernetes.pod.uid |
Step 5: Deploy your application
editAPM agents are deployed with your application.
Resource configuration file example
A complete resource configuration file based on the previous steps.
apiVersion: apps/v1
kind: Deployment
metadata:
  name: <<your-app>>
  namespace: kube-system
  labels:
    app: <<your-app>>
    service: <<your-app>>
spec:
  replicas: 1
  selector:
    matchLabels:
      app: <<your-app>>
  template:
    metadata:
      labels:
        app: <<your-app>>
        service: <<your-app>>
    spec:
      dnsPolicy: ClusterFirstWithHostNet
      volumes:
      - name: elastic-apm-agent
        emptyDir: {}
      initContainers:
      - name: elastic-java-agent
        image: docker.elastic.co/observability/apm-agent-java:1.12.0
        volumeMounts:
        - mountPath: /elastic/apm/agent
          name: elastic-apm-agent
        command: ['cp', '-v', '/usr/agent/elastic-apm-agent.jar', '/elastic/apm/agent']
      containers:
      - name: <<your-app>>
        image: <<your-app>>
        volumeMounts:
        - mountPath: /elastic/apm/agent
          name: elastic-apm-agent
        env:
        - name: ELASTIC_APM_SERVER_URL
          value: "apm-server-url-goes-here"
        - name: ELASTIC_APM_SECRET_TOKEN
          valueFrom:
            secretKeyRef:
              name: apm-secret
              key: ELASTIC_APM_SECRET_TOKEN
        - name: ELASTIC_APM_SERVICE_NAME
          value: "petclinic"
        - name: ELASTIC_APM_APPLICATION_PACKAGES
          value: "org.springframework.samples.petclinic"
        - name: ELASTIC_APM_ENVIRONMENT
          value: test
        - name: JAVA_TOOL_OPTIONS
          value: -javaagent:/elastic/apm/agent/elastic-apm-agent.jar
        - name: KUBERNETES_NODE_NAME
          valueFrom:
            fieldRef:
              fieldPath: spec.nodeName
        - name: KUBERNETES_POD_NAME
          valueFrom:
            fieldRef:
              fieldPath: metadata.name
        - name: KUBERNETES_NAMESPACE
          valueFrom:
            fieldRef:
              fieldPath: metadata.namespace
        - name: KUBERNETES_POD_UID
          valueFrom:
            fieldRef:
              fieldPath: metadata.uid
kubectl apply -f demo.yml
View your traces in Kibana
editTo view your application’s trace data, open Kibana and go to Observability > APM.
The APM app allows you to monitor your software services and applications in real-time: visualize detailed performance information on your services, identify and analyze errors, and monitor host-level and agent-specific metrics like JVM and Go runtime metrics.
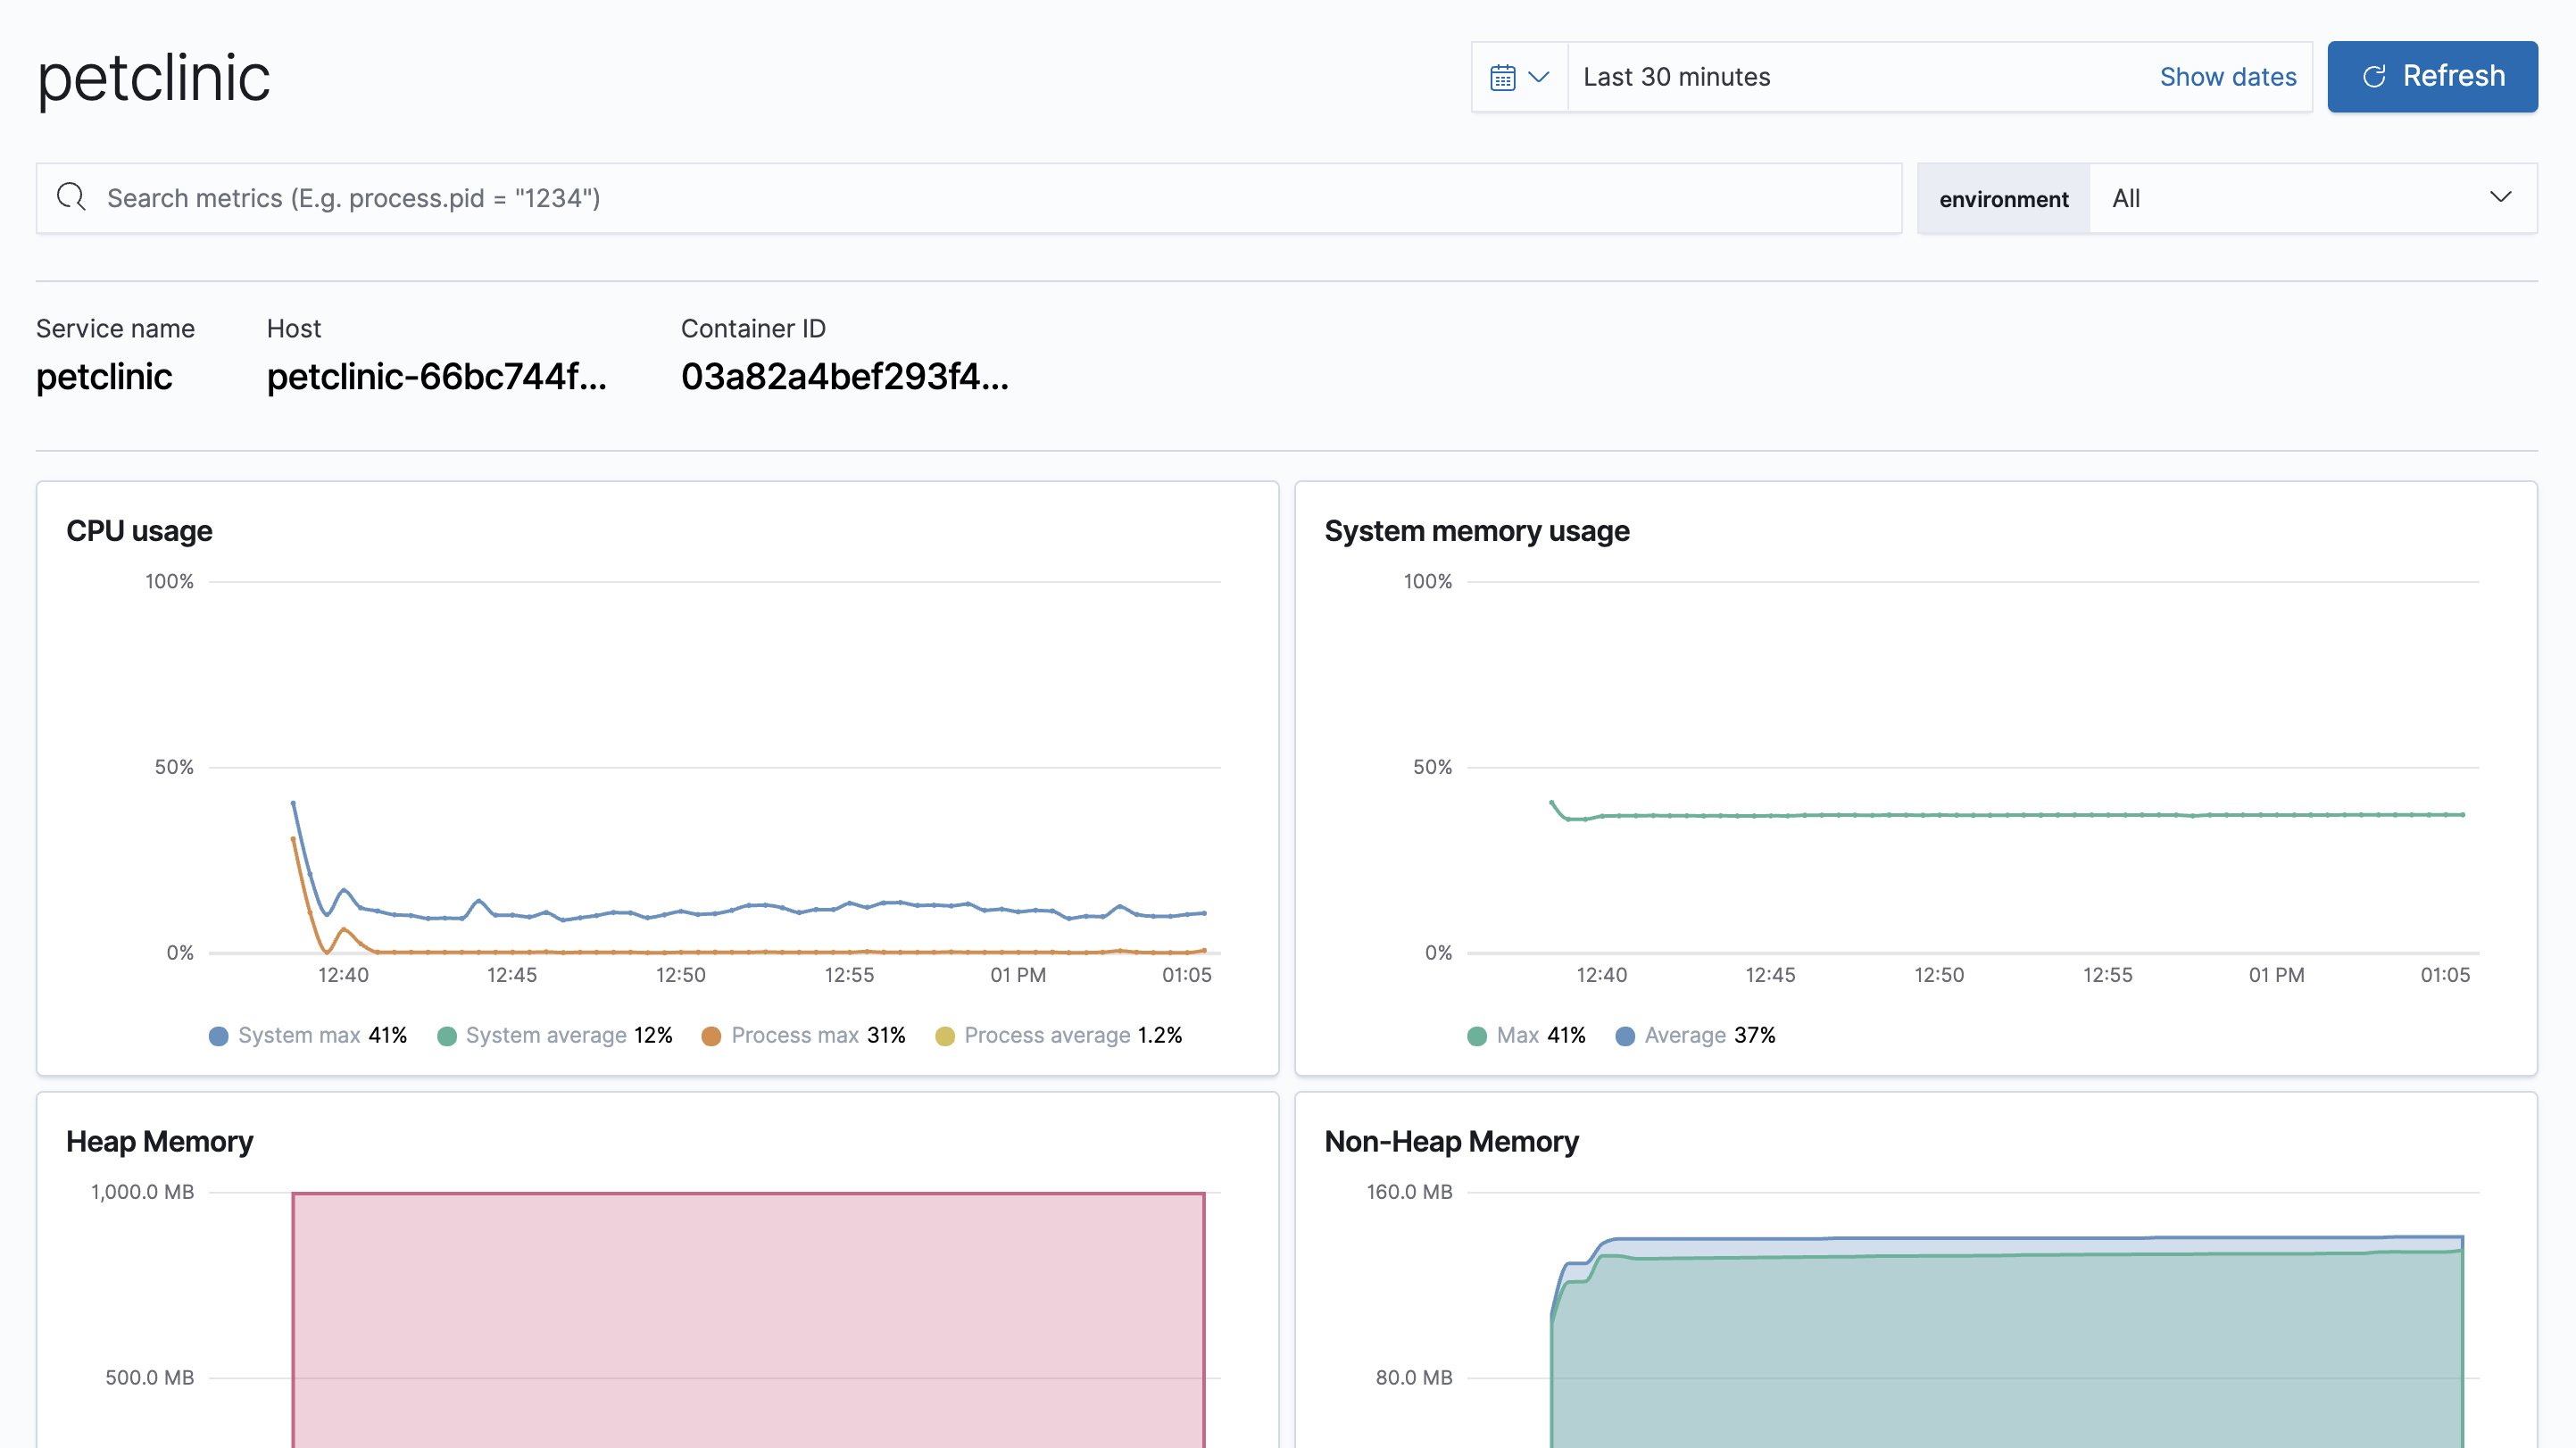
Having access to application-level insights with just a few clicks can drastically decrease the time you spend debugging errors, slow response times, and crashes.
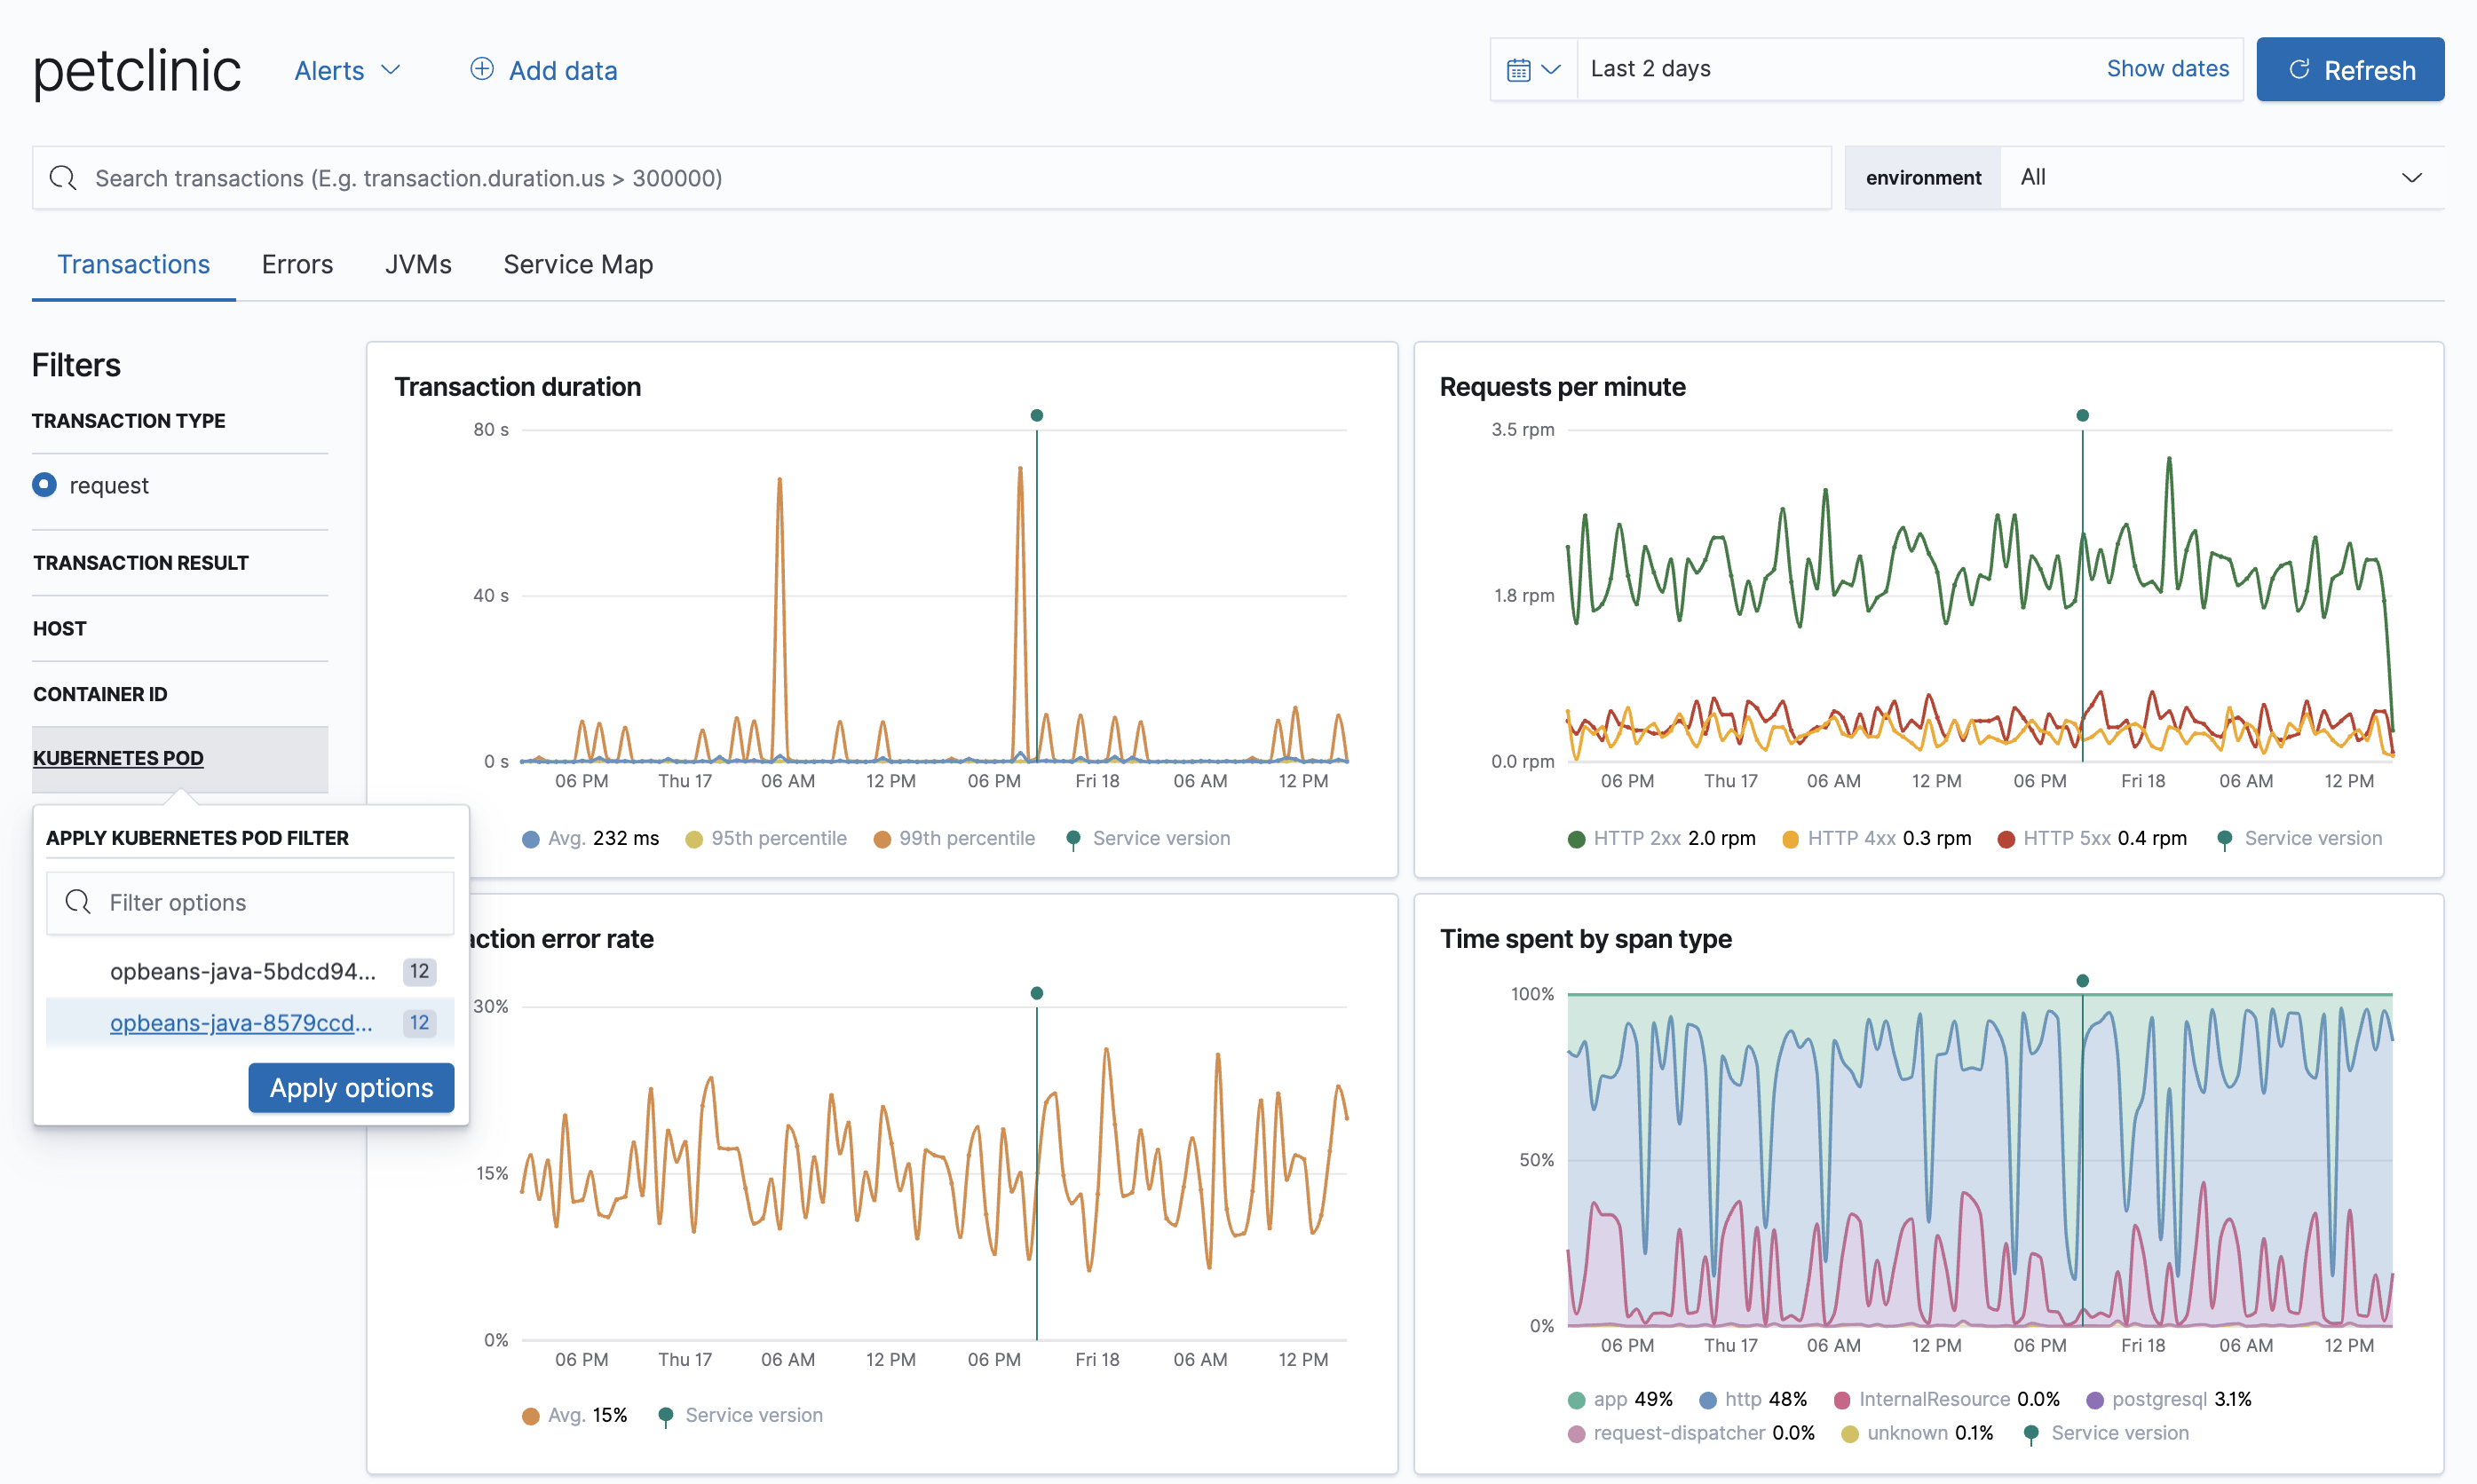
Best of all, because Kubernetes environment variables have been mapped to APM metadata events,
you can filter your trace data by Kubernetes namespace, node.name, pod.name, and pod.uid.
What’s next
edit- Want to protect your endpoints from security threats? Try Elastic Security. Adding endpoint protection is just another integration that you add to the agent policy!
- Are your eyes bleary from staring at a wall of screens? Create alerts and find out about problems while sipping your favorite beverage poolside.
- Want Elastic to do the heavy lifting? Use machine learning to detect anomalies.