Perf8: Performance metrics for Python
One tool for all your Python performance tracking needs


 Share on Twitter
Share on Twitter

 Share on LinkedIn
Share on LinkedIn

 Share on Facebook
Share on Facebook

 Share by Email
Share by Email

 Print this page
Print
We're building this neat service in Python to ingest data in Elasticsearch from various sources (MySQL, Network Drive, AWS, etc.) for Enterprise Search.
Sucking data from a third-party service to Elasticsearch is usually an I/O-bound activity. Your code sits on opened sockets and passes data from one end to the other. That's a great use case for an asynchronous application in Python, but it needs to be carefully crafted.
When data flows through that pipeline, we want to ensure we don't blow the available resources (RAM/CPU/FDs). We also want to maximize the output without killing Elasticsearch or the backend service.
So it's all about implementing the right throttling and backpressure safeguards and surfacing the right settings, so you can properly size how aggressive the service will be depending on your network bandwidth, available RAM, and Elasticsearch cluster size.
Bonus points if the application can poke at its execution environment and make some decisions to adapt its behavior automatically and dynamically.
All this tweaking and performance check work needs to happen for every new source. Every time we change our service, we have folks from different teams involved in the code base, and we need to standardize this performance work. The performance of the service could be degraded just because one new data source blocks the event loop or bloats the memory.
That's where it gets super interesting: to check the performance, each developer has its usual tools, and it becomes hard to share this knowledge in a standardized way. Python has numerous tools to check the performances of your applications, and there's no such thing as the "perfect tool."
That threw me back 12 years ago when I faced the same dilemma with QA tools and released Flake8 0.1 — I wanted to have that single unified CLI to run a curated list of QA tools.
The project became popular because it evolved and got maintained by amazing folks, but also because the initial idea — one CLI to rule them all — made a lot of sense for folks wanting to adopt a QA standard and a set of good practices for their project without having to dig too much into what they are supposed to run. Just flake8 it.
This is exactly what we were looking at today for performance testing. A single unified tool to run performance tests, create a standard for our Python projects, and produce the same standard report every time.
We named it perf8 for the flake8 reference (which was named flake8 because it's a contraction of pyflakes and pep8), and the work is happening here.
The current ecosystem of performance tools in Python is so amazing compared to what was available 12 years ago. I am like a kid in a candy shop.
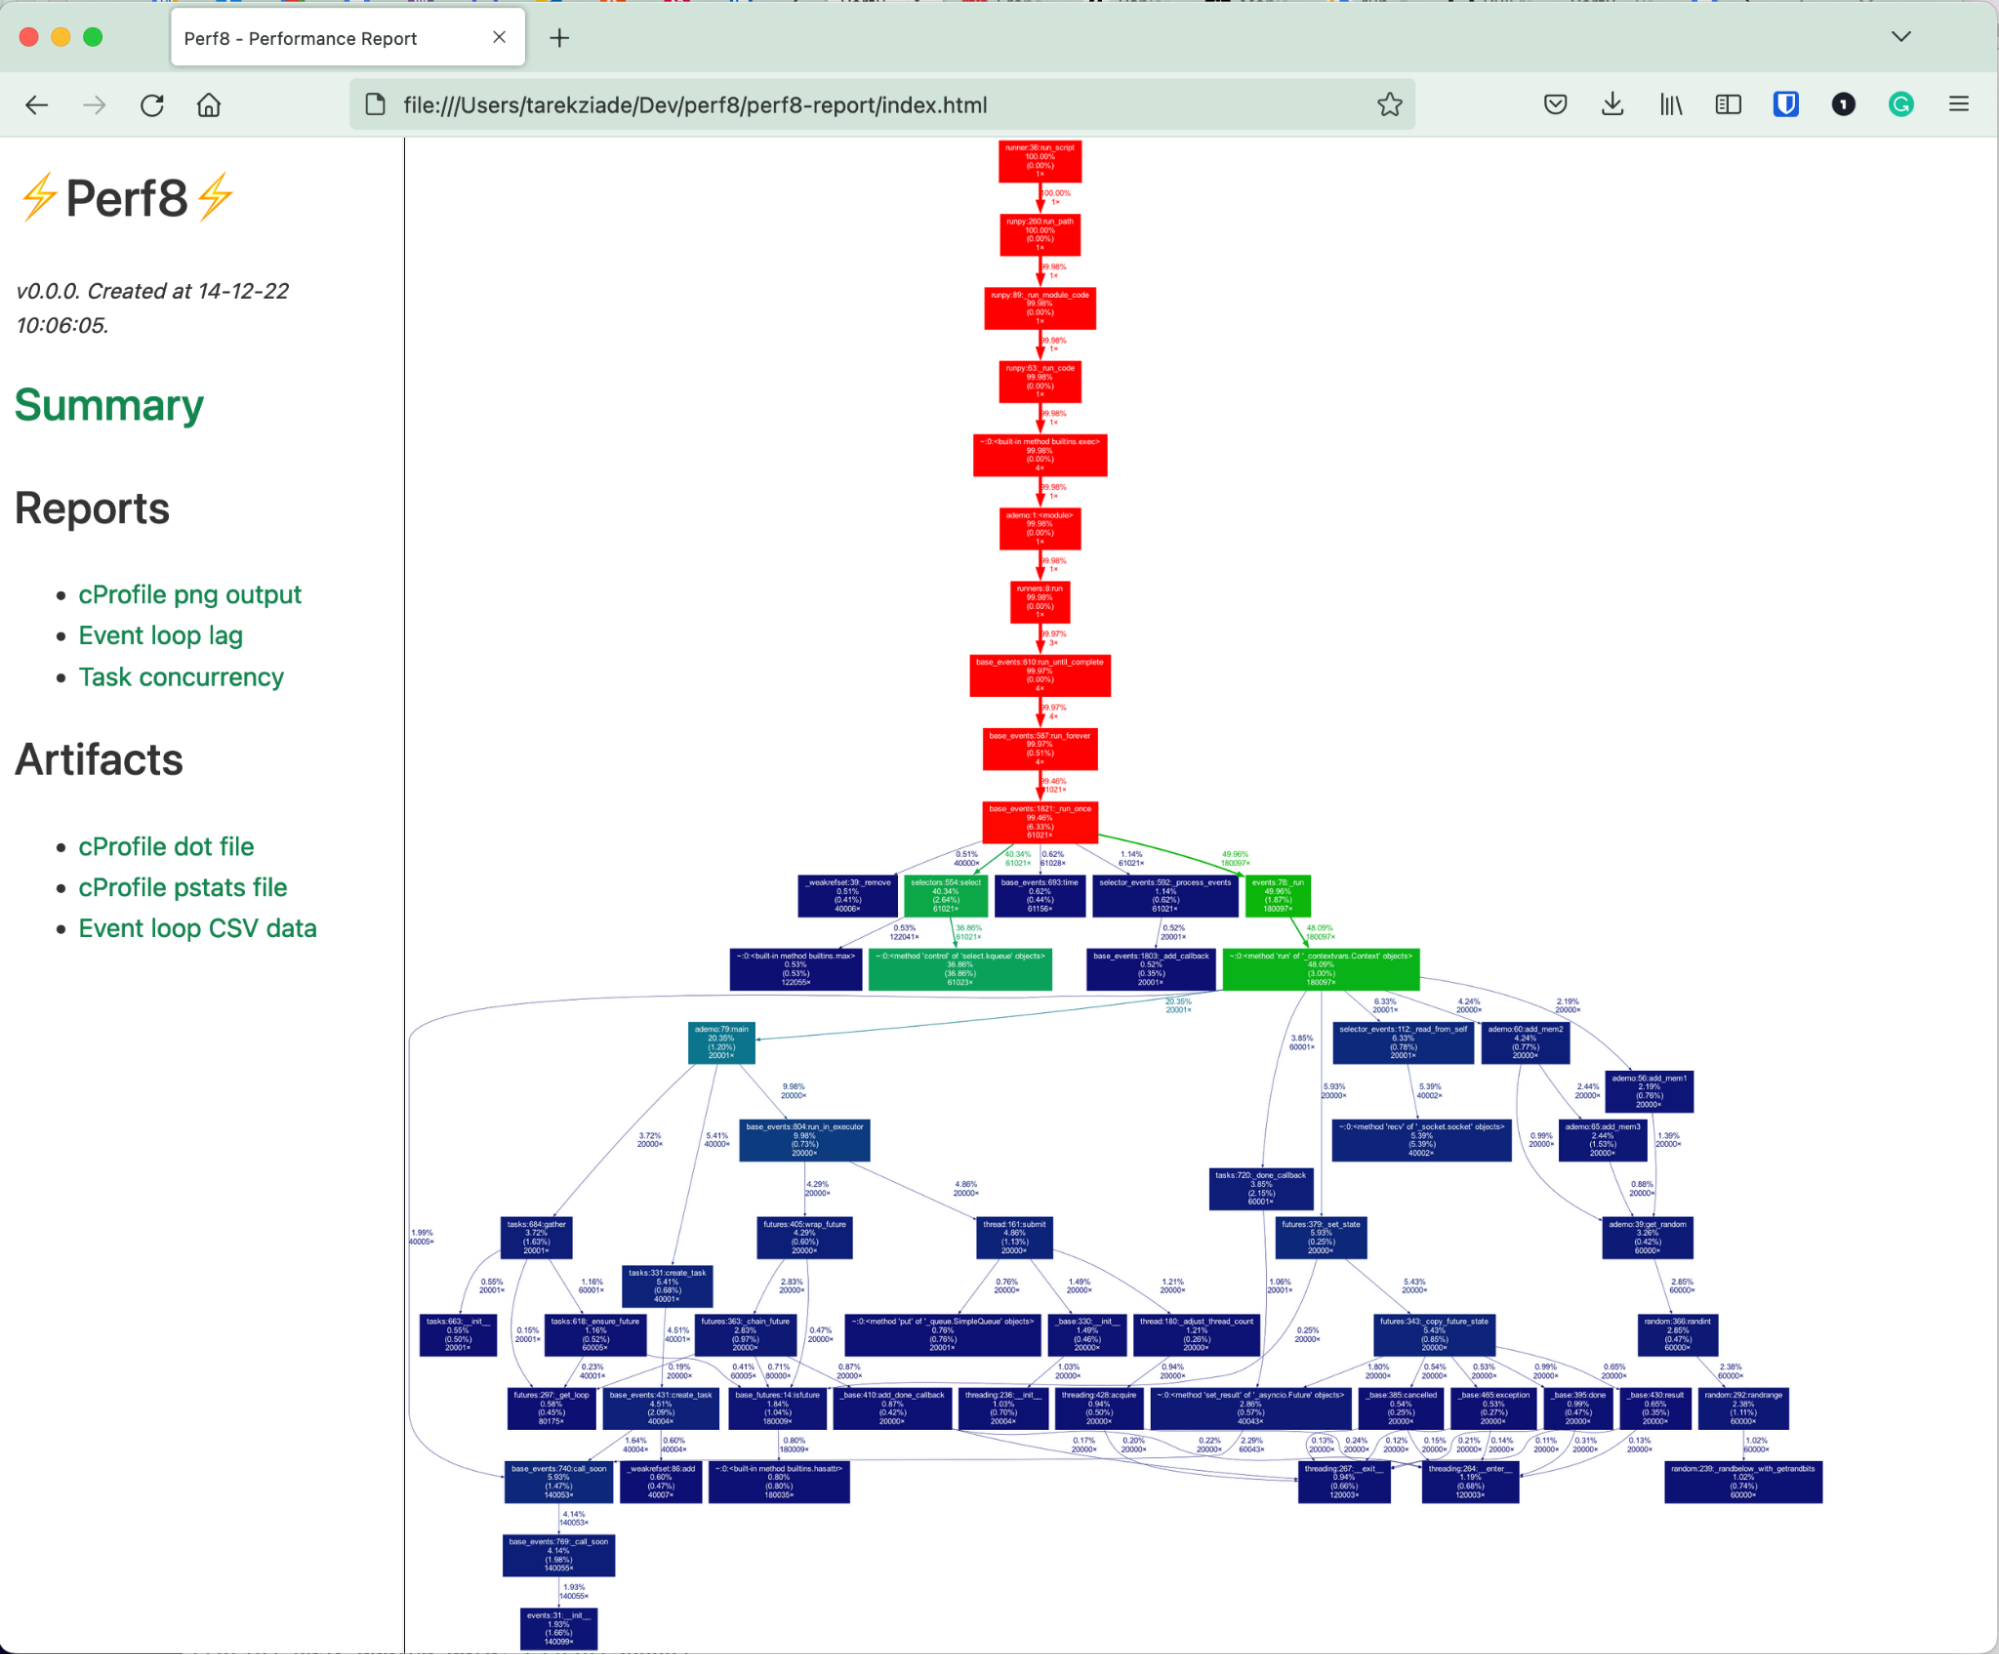
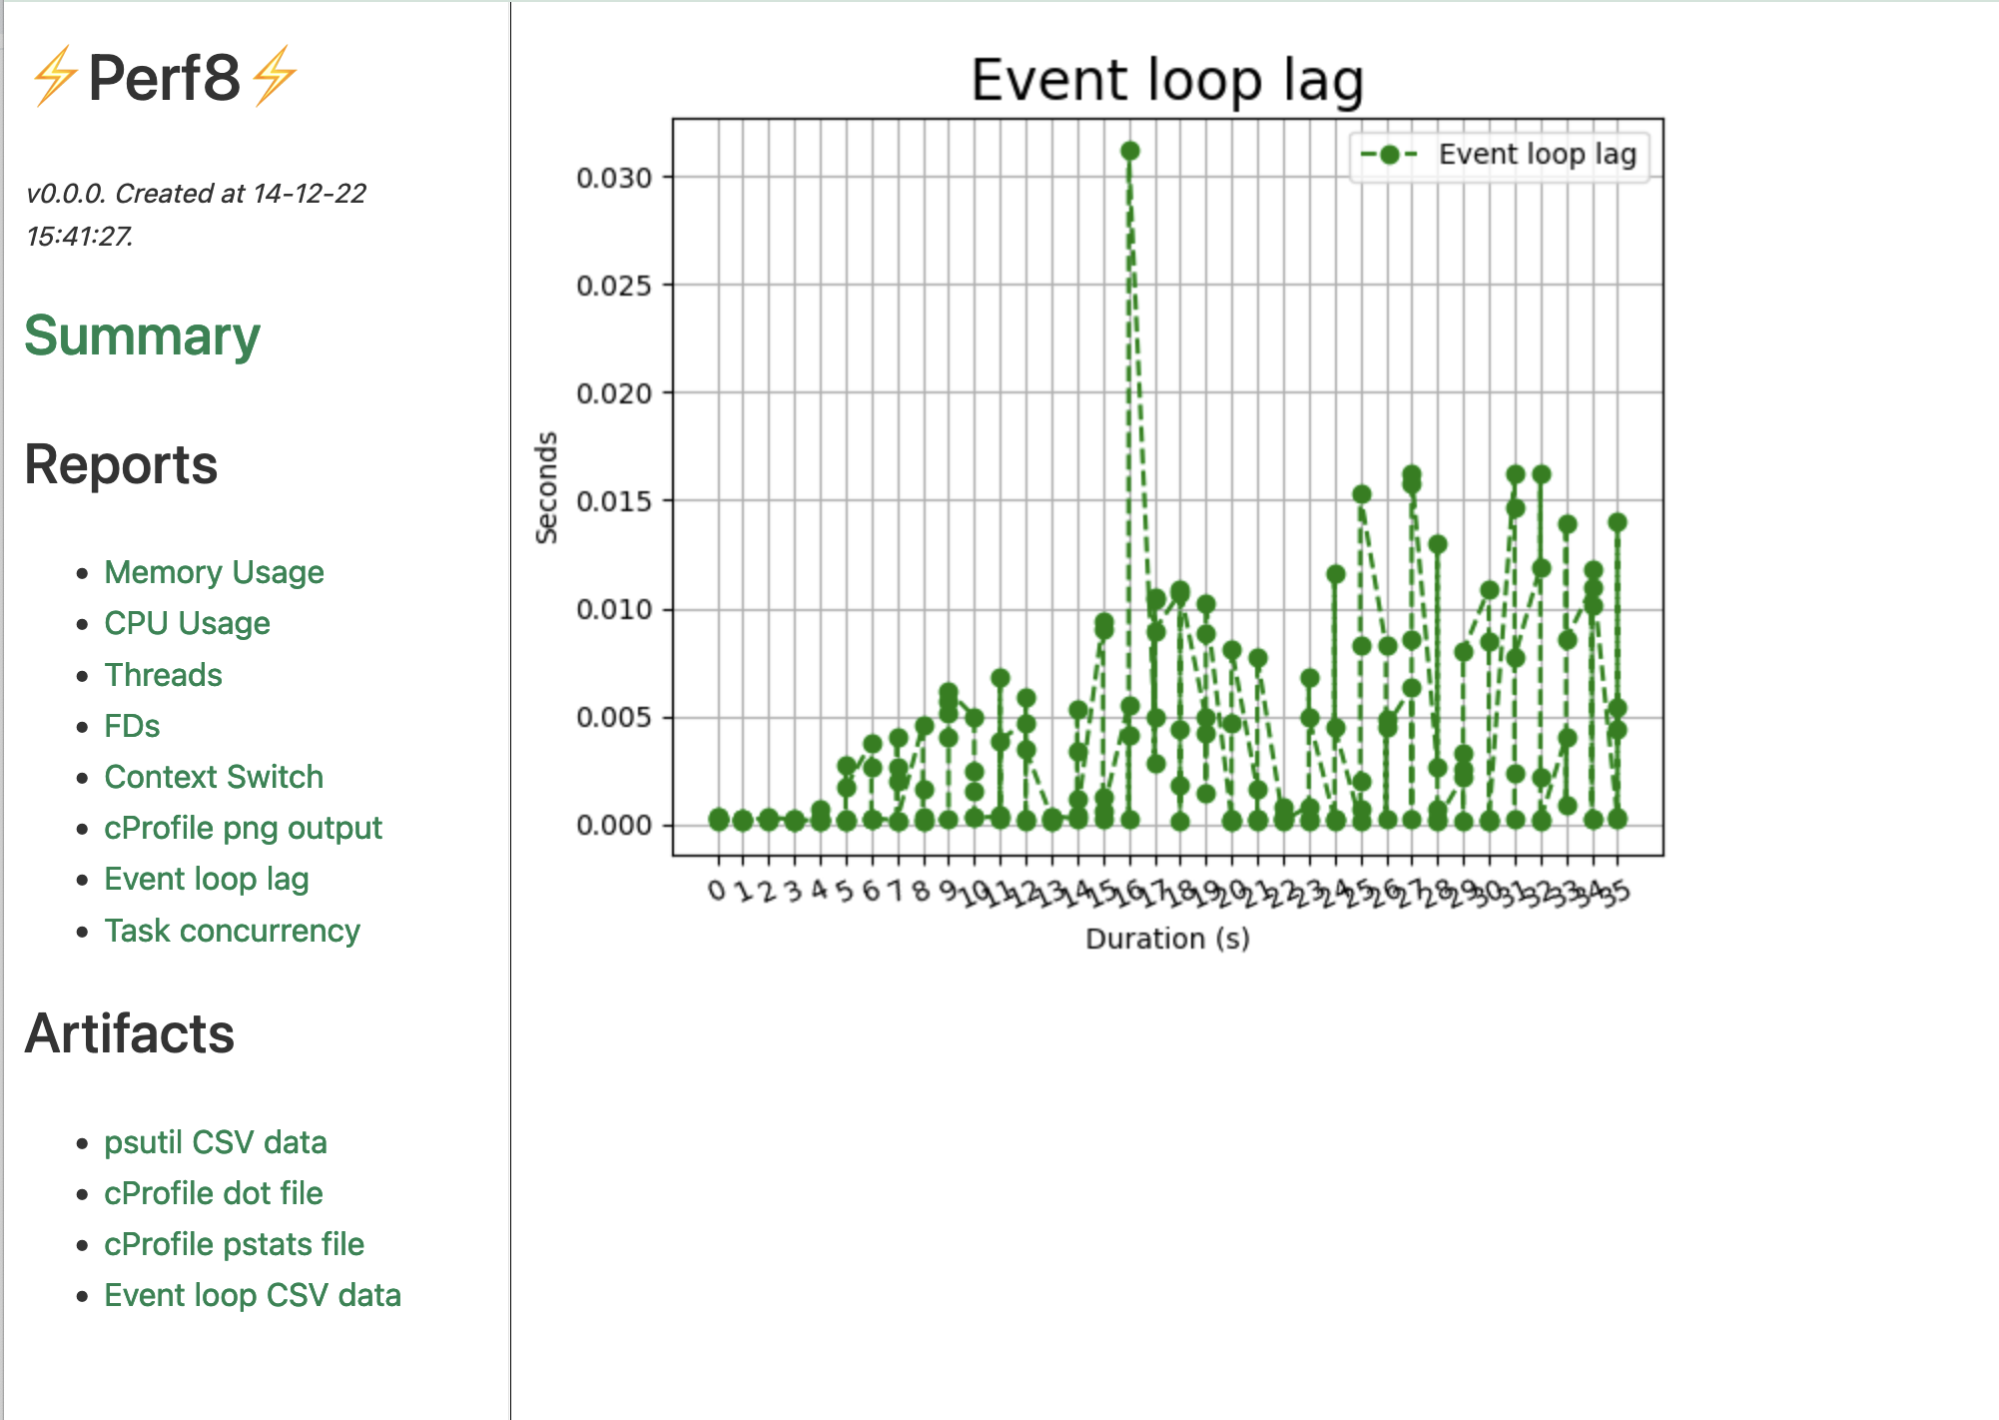
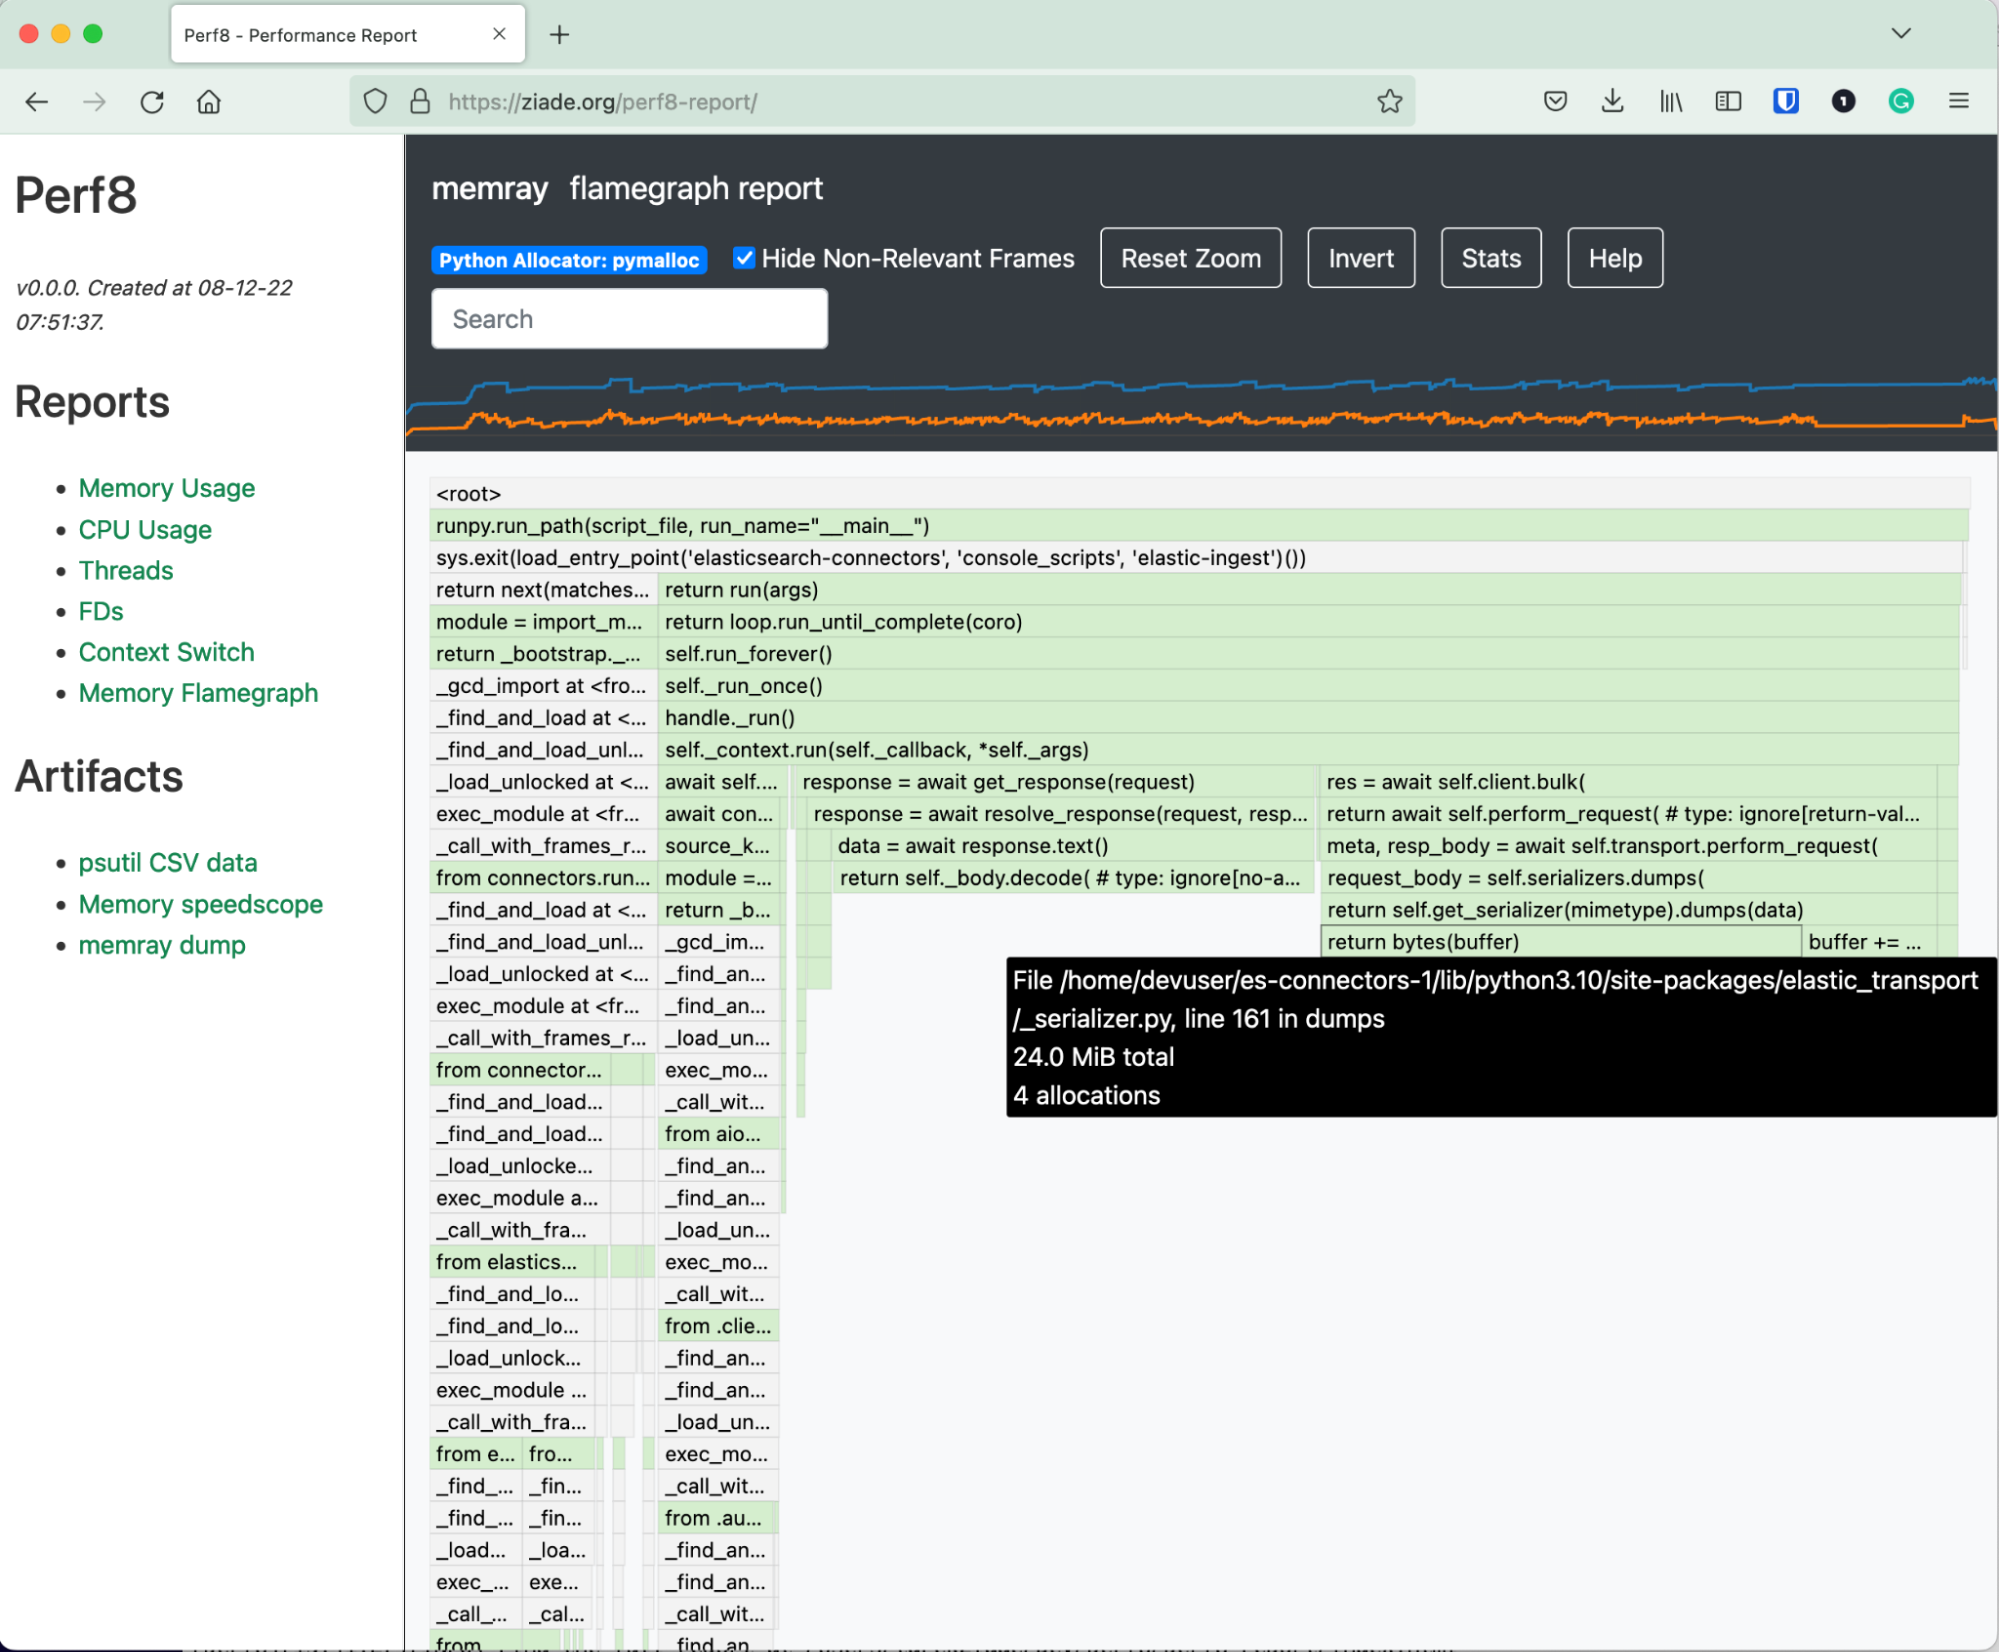
We've integrated Memray, py-spy with speedscope reports, and other cool stuff, like a dot graph generated by gprof2dot. Py-spy is superior to cProfile in our use cases because it runs out of the process and won’t add a massive speed overhead when running the app. But it will not work with the latest macOS versions. So cProfile makes a decent fallback in that case, and the dot view is usually surfacing pretty quickly the hot points.
And it produces a unified aggregated report in a self-contained HTML directory so it can be zipped and passed around, produced in automation, or on a developer laptop. We did not want to use a sophisticated system agent like metricbeats to make it extremely portable and easy to run in all environments.
All you have to do to use it is run your Python application with: $ perf8 -c /path/to/app.py.
Besides the HTML report, the directory contains all the raw metrics as artifacts, so if one day we want to plug our CI into a Kibana dashboard and enjoy a better UI with historical data, we’ll be able to leverage Perf8.
But for now, the simple static HTML report is good enough!
See some screenshots below:
The goal is to develop a curated list of tools that provide the whole spectrum of metrics we might need when poking at performance in general.
Bob: I think your application has a perf issue
Joe: Let’s look at it. Can you send me your Perf8 report?
What do you think?
This is an open-source project by Elastic, and contributions are welcome. If you know a performance tool/lib that should be there or have good ideas for improving it, please join the fun by starting a conversation in the project’s issue tracker.
Share
- Share on Twitter
Share on Twitter
- Share on LinkedIn
Share on LinkedIn
- Share on Facebook
Share on Facebook
- Share by Email
Share by Email
- Print this page
Print