Elastic Uptime Monitoring 7.3.0 released
We are pleased to announce a new release of Elastic Uptime Monitoring, version 7.3.0, available on the Elasticsearch Service, or as part of the default distribution of Elastic Stack.
Monitor Summaries
When it comes to monitoring applications with Uptime, users often set up several geographically-dispersed monitors to get multiple perspectives on user experience.
Monitor Summaries allow the user to see multiple Heartbeat results grouped in a single, expandable row per monitored endpoint. This visual representation in Uptime UI, called "Monitor summaries" improves the experience for users that are using multiple Heartbeat instances.
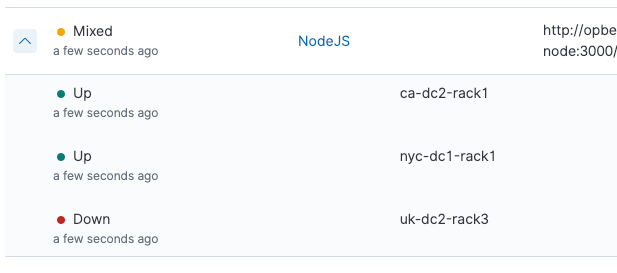
In a closer look, as we expand a single endpoint, we can see the status of this endpoint monitored from 3 locations (California, New York, and the UK, which is currently down).
Monitors page
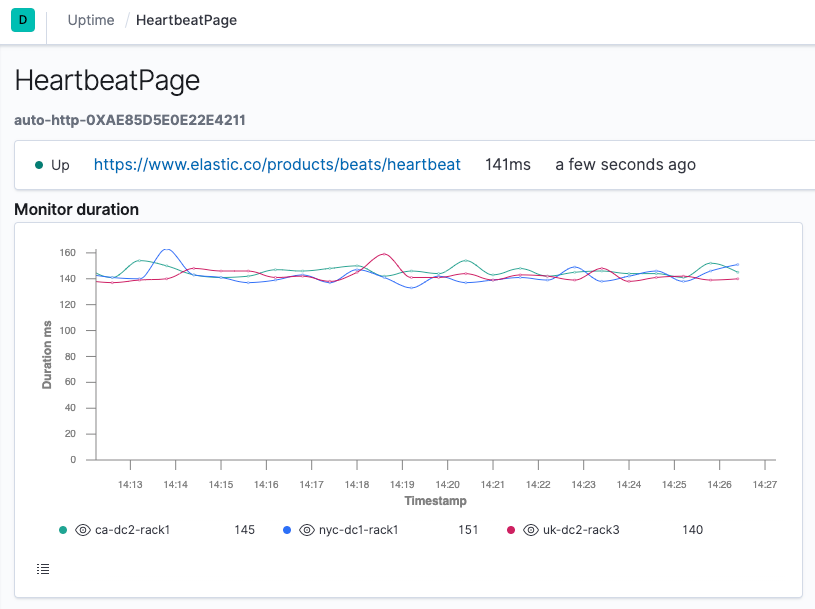
Several UI improvements were made to the Monitors detail screen. The most significant one is the "Monitor duration" chart, where the user can see the duration of a single endpoint check across multiple locations, with the additional ability to filter per location as needed.
Want to see it in action?
You can access the 7.3.0 Elastic Uptime application on the Elasticsearch Service on Elastic Cloud, or you can download it as part of the default distribution of the Elastic Stack. Download Heartbeat, follow the instructions on how to set it up, and start monitoring your applications and services today.