Analyzing Network Packets with Wireshark, Elasticsearch, and Kibana
February 15, 2019: Starting with Wireshark 3.0.0rc1, TShark can now generate an Elasticsearch mapping file by using the -G elastic-mapping option.
For network administrators and security analysts, one of the most important capabilities is packet capture and analysis. Being able to look into every single piece of metadata and payload that went over the wire provides very useful visibility and helps to monitor systems, debug issues, and detect anomalies and attackers.
Packet capture can be ad hoc, used to debug a specific problem. In that case, only the traffic of a single application or a single server might be captured, and only for a specified period of time. Or it can be extensive, for example using an outside network tap to capture all traffic.
While network traffic itself is sent in a binary format, each packet contains many different fields that using proper tools can be parsed out into numbers, text, timestamps, IP addresses, etc. All of this is data that can be stored in Elasticsearch and explored, searched and visualized in Kibana.
Architecture
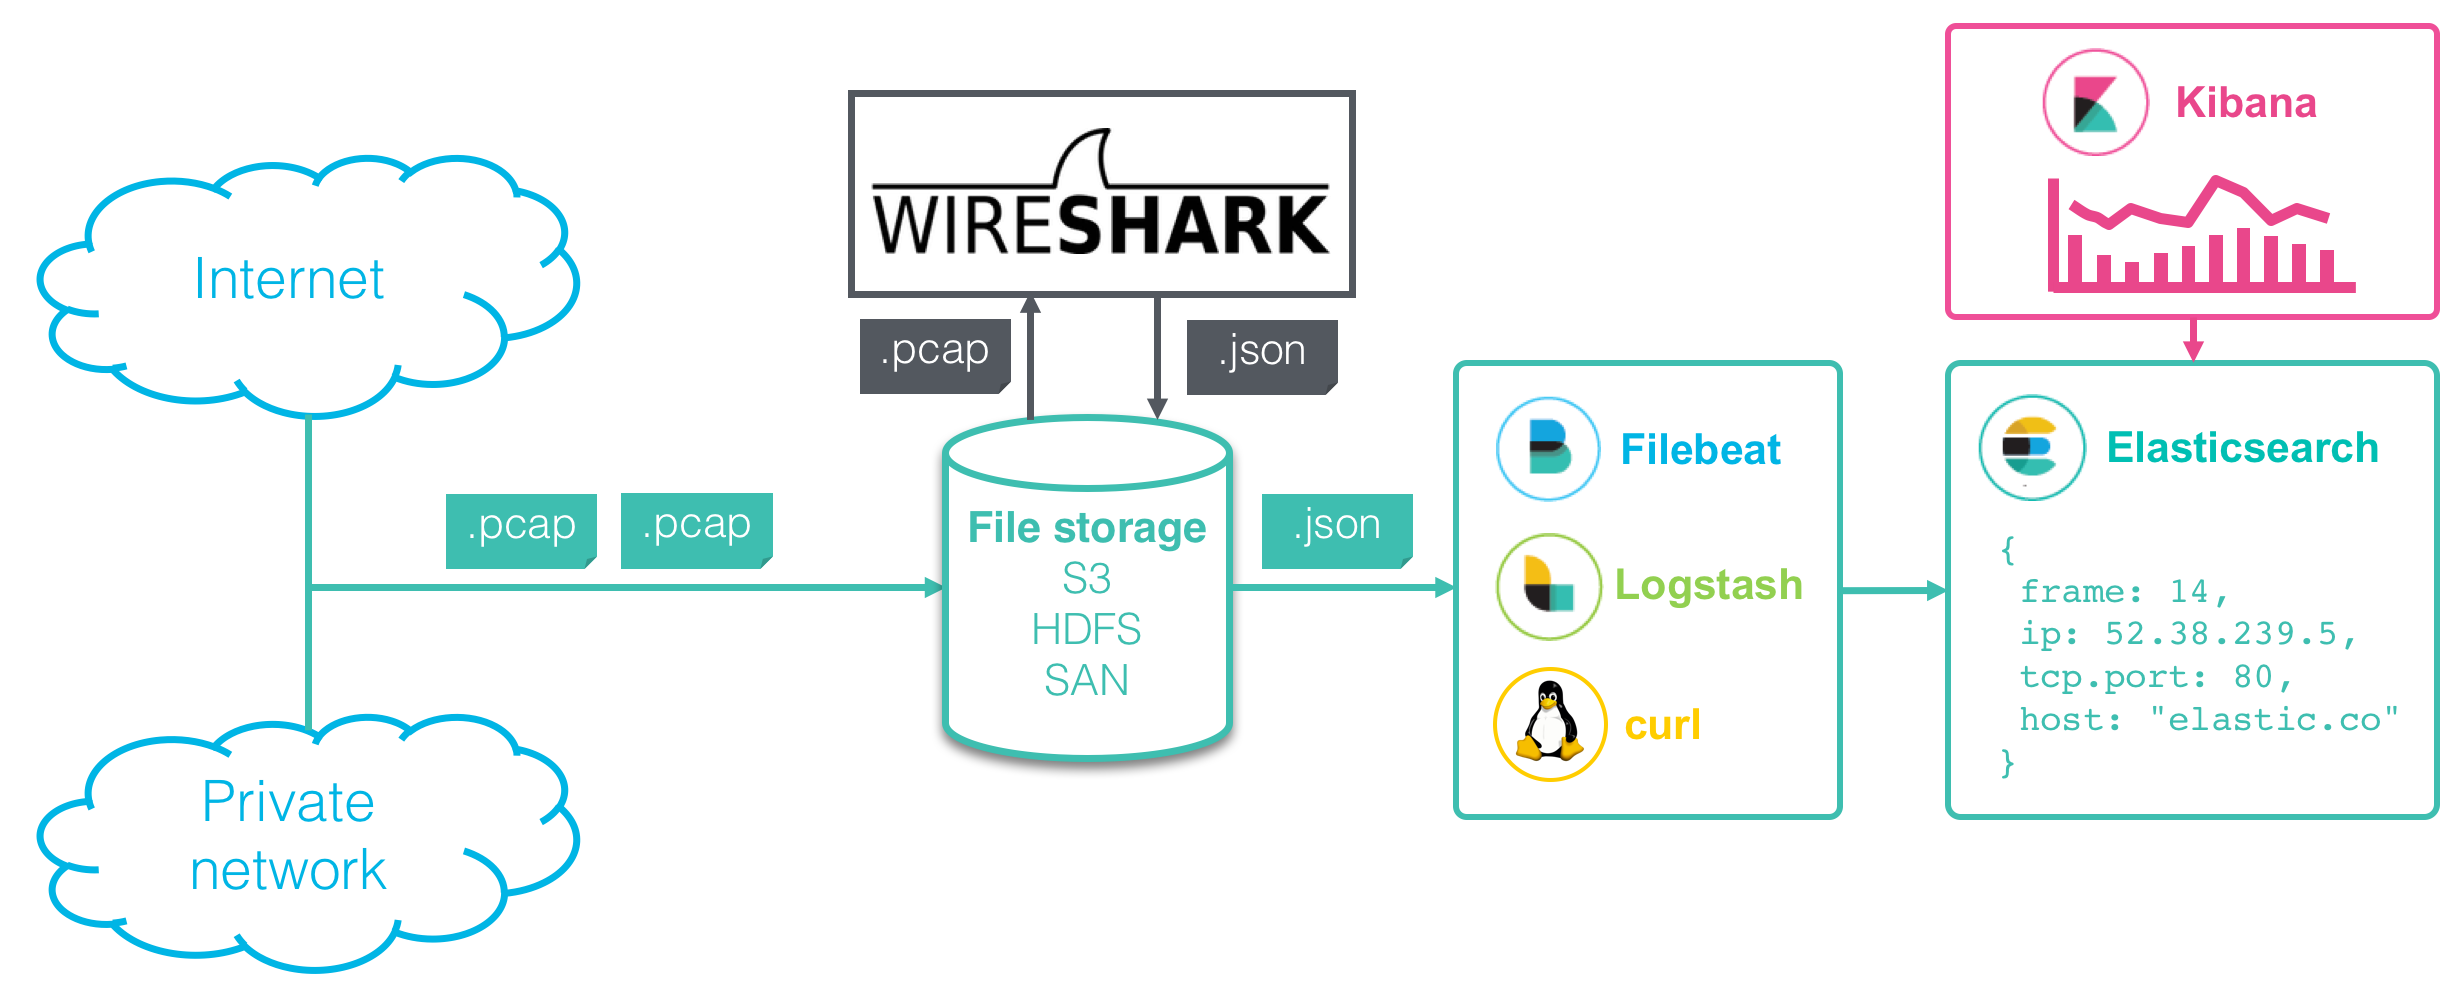
Any data pipeline for network capture and analysis is composed of several steps:
1. Packet capture - Recording the packet traffic on a network. 2. Protocol parsing - Parsing out the different network protocols and fields. 3. Search and Visualize - Exploring the data in detail or in aggregate.
In this blog post, I will show how to set up a pipeline using Wireshark and the Elastic Stack that can look like this:
Packet capture
Packetbeat
There is already a tool in the Elastic Stack to index network data into Elasticsearch: Packetbeat. Packetbeat can be configured to capture network packets live as well as read packets from a capture file with the -I option. It can recognize and parse a number of application-level protocols such as HTTP, MySQL and DNS, as well as general flow information. However, it is not built for full packet capture and parsing of the myriad different protocols out in the world and is best used for monitoring specific applications. Especially its ability to match responses with their original requests and indexing the merged event is very useful if you’re looking at specific protocols.
Wireshark/Tshark
Wireshark is the most popular packet capture and analysis software, and open source. It can recognize more than 2,000 protocols containing over 200,000 fields. Its GUI is familiar to most network and security professionals.
In addition to a GUI it provides the command-line utility tshark to capture live traffic as well as read and parse capture files. As its output, tshark can produce reports and statistics, but also parsed packet data in different text formats.
One of the output formats supported by tshark since version 2.2 (released in September 2016) is a JSON format for the Elasticsearch Bulk API:
tshark -i eth0 -T ek > packets.json
Will do a live capture of packets on the eth0 network interface and output them in Elasticsearch Bulk API format into the file packets.json.
tshark -r capture.pcap -T ek > packets.json
Will read packets from capture file capture.pcap and output them as JSON for the Elasticsearch Bulk API format into the file packets.json.
Importing from Wireshark/Tshark
Elasticsearch Mapping
Raw packet data contains an extraordinarily large amount of fields. As mentioned above Wireshark knows about 200,000 individual fields. Most likely, the vast majority of these fields will never be searched or aggregated on. Consequently, creating an index on all these fields is usually not the right thing to do. In fact, since a large number of fields can slow down both indexing and query speed Elasticsearch 5.5 limits the number of fields in an index to 1000 by default. Also, the output of tshark -T ek contains all field values as strings, regardless of whether the data is actually text or numbers including timestamps and IP addresses, for example. Without the right data types, you will not be able to perform type-specific operations on these fields (e.g. finding out the average packet length).
To index numbers as numbers, timestamps as timestamps, etc. and to prevent an explosion of indexed fields, you should explicitly specify an Elasticsearch mapping. Here is an example:
PUT _template/packets
{
  "template": "packets-*",
  "mappings": {
    "pcap_file": {
      "dynamic": "false",
      "properties": {
        "timestamp": {
          "type": "date"
        },
        "layers": {
          "properties": {
            "frame": {
              "properties": {
                "frame_frame_len": {
                  "type": "long"
                },
                "frame_frame_protocols": {
                  "type": "keyword"
                }
              }
            },
            "ip": {
              "properties": {
                "ip_ip_src": {
                  "type": "ip"
                },
                "ip_ip_dst": {
                  "type": "ip"
                }
              }
            },
            "udp": {
              "properties": {
                "udp_udp_srcport": {
                  "type": "integer"
                },
                "udp_udp_dstport": {
                  "type": "integer"
                }
              }
            }
          }
        }
      }
    }
  }
}
"template": "packets-*" specifies that this template should be applied to all new indices created that match this pattern **"dynamic": "false"**specifies that fields not explicitly specified in the mapping should not be indexed. However, all the non-indexed fields will still be stored in Elasticsearch and you will see them in the results of your searches. However, you will not be able to search or aggregate them.
To then import the output of tshark -T ek into Elasticsearch, you have several options:
1. curl
curl -s -H "Content-Type: application/x-ndjson" -XPOST "localhost:9200/_bulk" --data-binary "@packets.json"
Note: If your JSON file contains more than a few thousand documents you might have to split it into smaller chunks and send them to the Bulk API separately, e.g. with a script. On systems where it is available you can use the
splitutility for that.
2. Filebeat
Filebeat is very lightweight and can watch a set of files or directory for any new files and process them automatically. A sample configuration to read Tshark output files and send the packet data to Elasticsearch looks like this:
filebeat.yml
filebeat.prospectors:
- input_type: log
  paths:
    - "/path/to/packets.json"
  document_type: "pcap_file"
  json.keys_under_root: true

processors:
 - drop_event:
     when:
       equals:
         index._type: "pcap_file"

output.elasticsearch:
  hosts: ["localhost:9200"]
  index: "packets-webserver01-%{+yyyy-MM-dd}"
  template.enabled: false
json.keysunderroot: trueParse lines as JSONindex.type: "pcapfile"Drop control lines meant for the Elasticsearch Bulk APItemplate.enabled: falseUse the existing template we uploaded into Elasticsearch above
3. Logstash
Like Filebeat, Logstash can watch a directory for new files and process them automatically. In contrast to Filebeat, it can transform data more extensively than an Elasticsearch Ingest Pipeline.
See the section on transforming the data below for an example of a Logstash configuration.
Transforming the data
If you’d like to do any changes to the data before it is indexed into Elasticsearch, there are two ways:
Ingest Pipeline
Elasticsearch has the concept of an Ingest Pipeline since version 5.0. A pipeline consists of a series of processors that can make many different changes to the data.
An example pipeline could look like this:
PUT _ingest/pipeline/packets
{
  "description": "Import Tshark Elasticsearch output",
  "processors" : [
    {
      "date_index_name" : {
        "field" : "timestamp",
        "index_name_prefix" : "packets-webserver01-",
        "date_formats": [ "UNIX_MS" ],
        "date_rounding" : "d"
      }
    }
  ]
}
This pipeline will simply change the index the packets will be written to (the default specified by Tshark is packets-YYYY-MM-DD). To use this pipeline when importing data, you specify it in the URL:
curl -s -H "Content-Type: application/x-ndjson" -XPOST "localhost:9200/_bulk?pipeline=packets" --data-binary "@packets.json"
See the Ingest module documentation and these two blog posts for more information: A New Way To Ingest - Part 1, Part 2.
Filebeat and Logstash both have equivalent configuration options to specify an ingest pipeline when sending data to Elasticsearch.
Logstash
Logstash is part of the Elastic Stack and serves as a data processing pipeline. It can be used to read data in the Elasticsearch Bulk API format and perform more complex transformation and enrichments on the data before sending it to Elasticsearch.
An example configuration would be:
logstash.conf
input {
  file {
    path => "/path/to/packets.json"
    start_position => "beginning"
  }
}

filter {
    # Drop Elasticsearch Bulk API control lines
    if ([message] =~ "{\"index") {
        drop {}
    }

    json {
        source => "message"
        remove_field => "message"
    }

    # Extract innermost network protocol
    grok {
        match => {
            "[layers][frame][frame_frame_protocols]" => "%{WORD:protocol}$"
        }
    }

    date {
        match => [ "timestamp", "UNIX_MS" ]
    }
}

output {
  elasticsearch {
    hosts => "localhost:9200"
    index => "packets-webserver01-%{+YYYY-MM-dd}"
    document_type => "pcap_file"
    manage_template => false
  }
}
The grok filter extracts the innermost network protocol name from the frame_frame_protocols field (which has the format “protocol:protocol:protocol” e.g. “eth:ethertype:ip:tcp:http”) into a top-level “protocol” field.
Visualizing and exploring network packets in Kibana
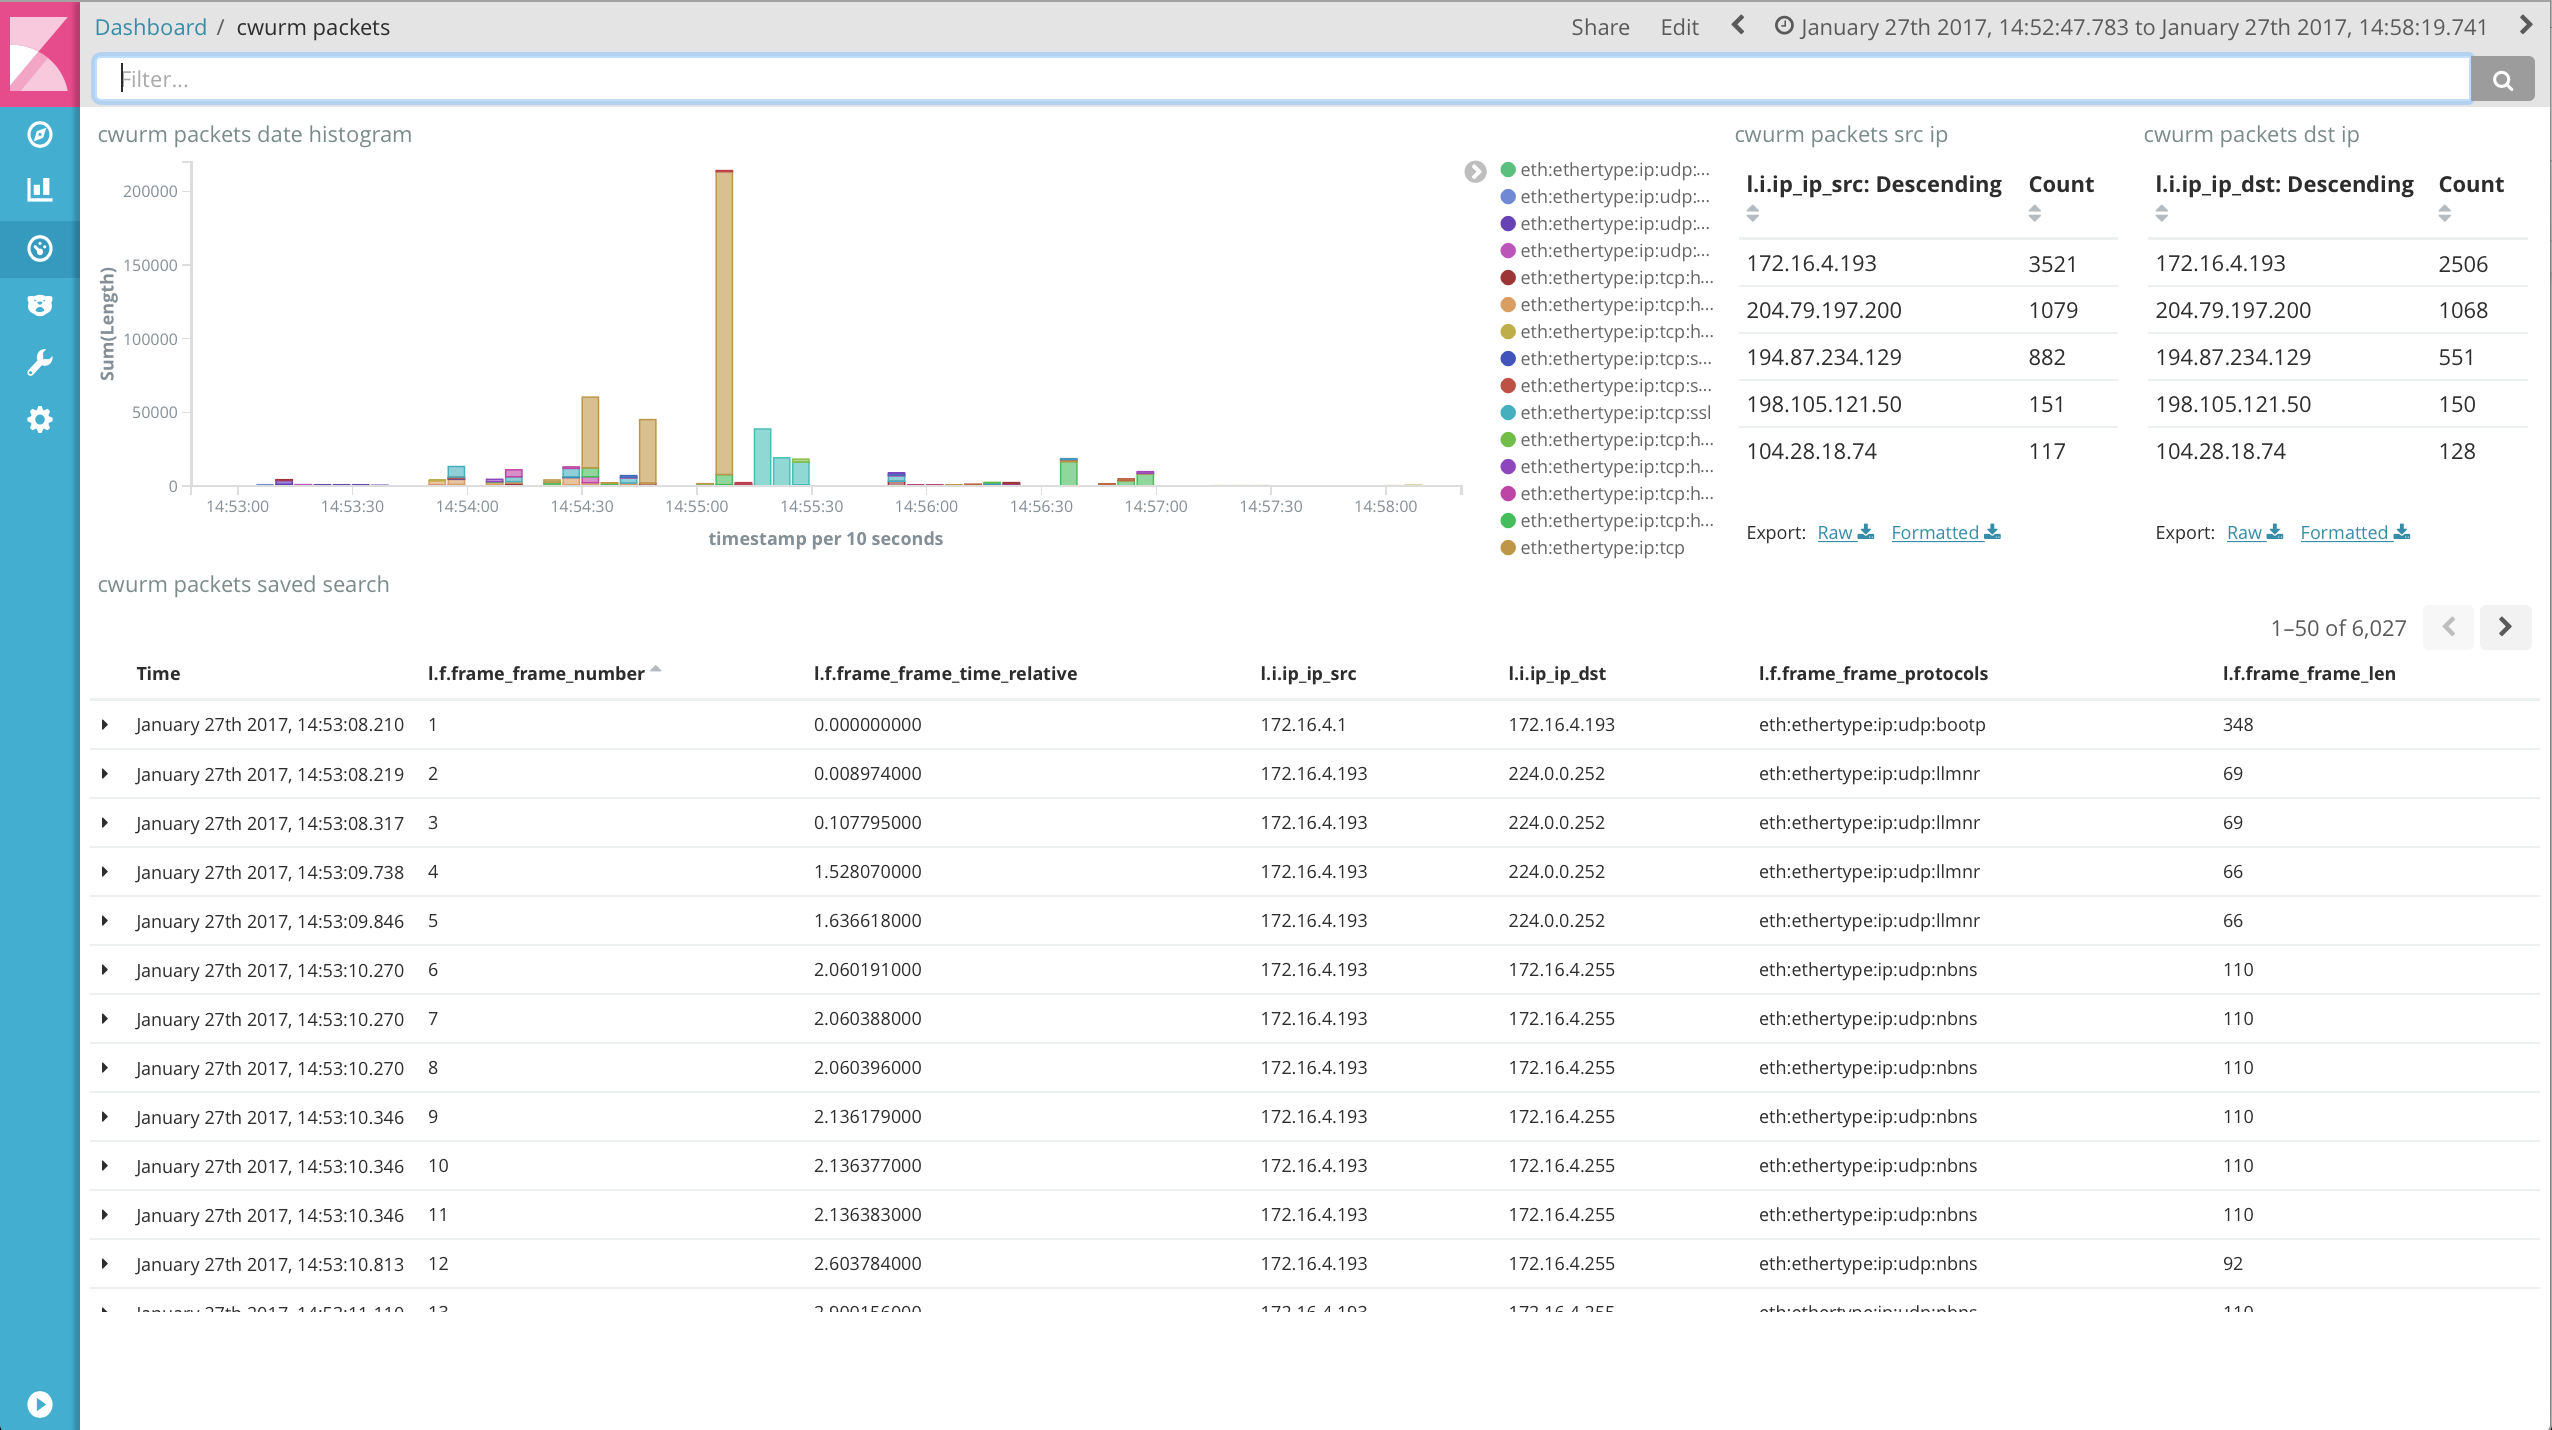
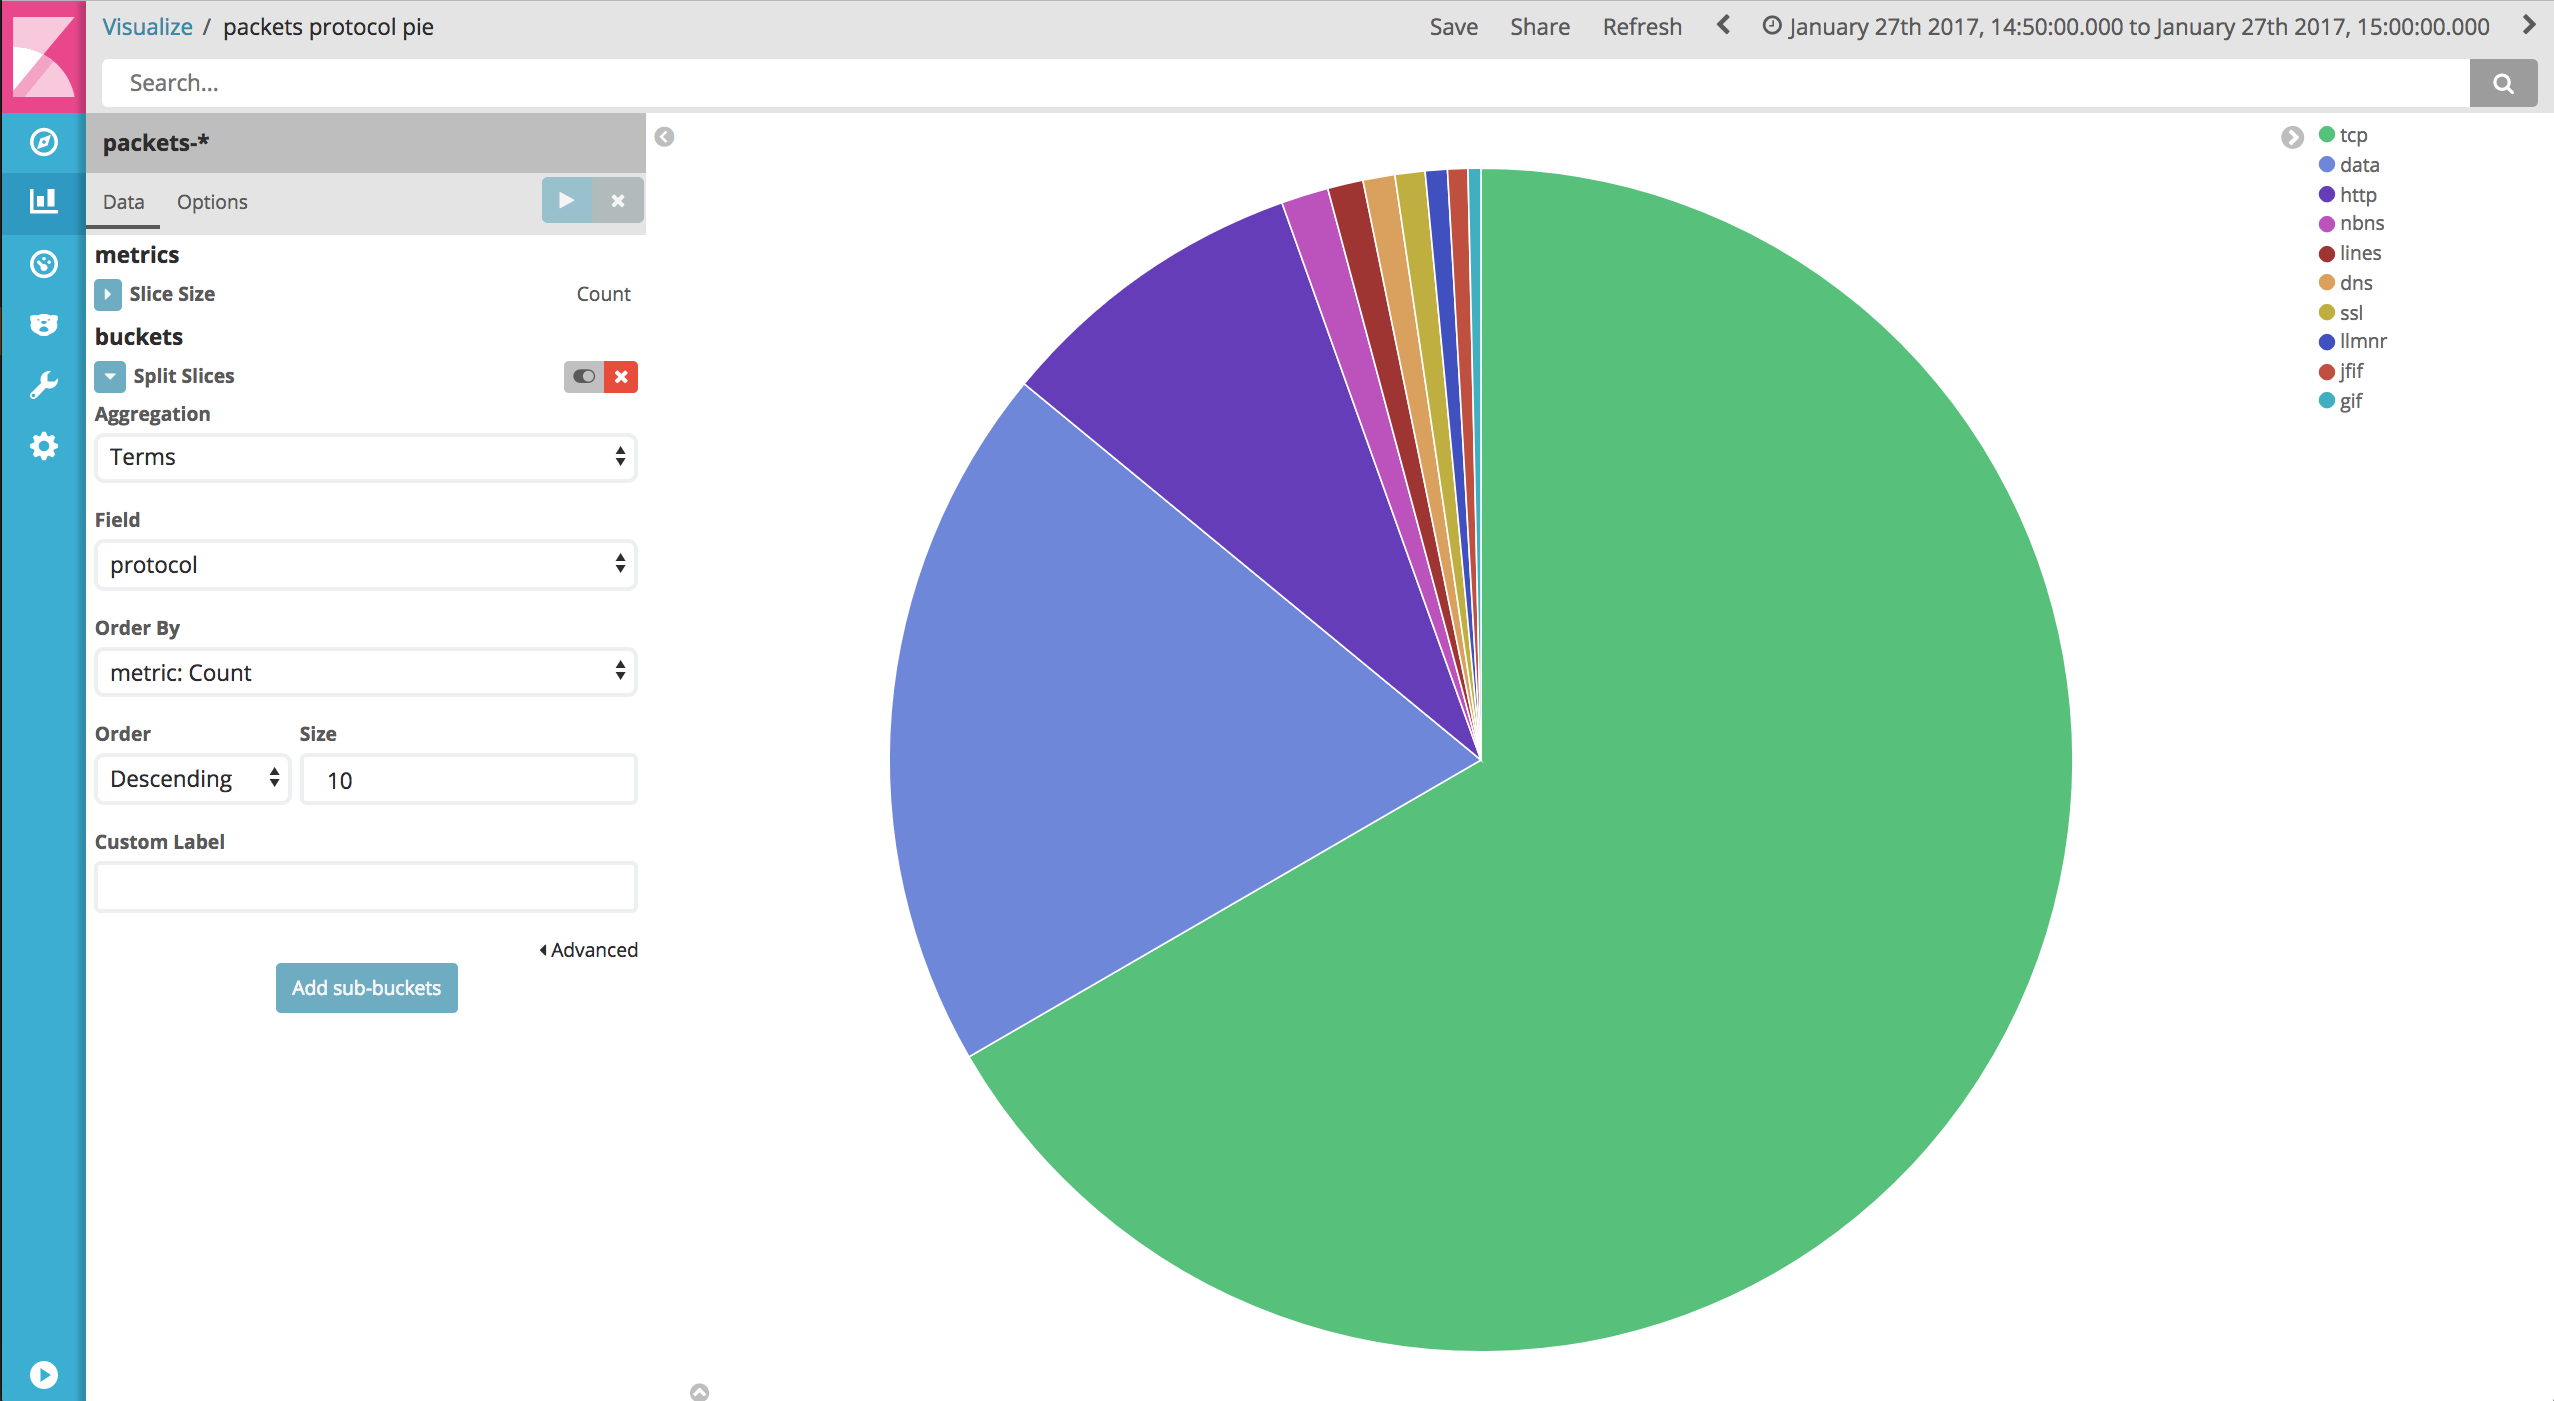
In Kibana, you can now explore the packets and build dashboards on top of them.
For example:
Helpful Kibana settings
Since network data from Wireshark has a data format that is different from e.g. syslog it might make sense to change some settings in Kibana (Management tab -> Kibana Advanced Settings).
shortDots:enable = true
format:number:defaultPattern = 0.[000] (2)
timepicker:timeDefaults = {
  "from": "now-30d",
  "to": "now",
  "mode": "quick"
}
shortDots:enable = trueshortens long nested field names, e.g. layer.frame.frame_frame_number to l.f.frame_frame_numberformat:number:defaultPattern = 0.[000]changes the display format for numbers to not show a thousands separatortimepicker:timeDefaultschanges the default period of time Kibana displays data for to the last 30 days, on the assumption that packet captures are often going to be historical as well as real-time
Conclusion
Elasticsearch is a highly scalable, low-latency data store that is very well suited to store packet data and provide near real-time access to it. Network and IT administrators as well as security analysts and other roles benefit from being able to interactively explore network packets in a web browser instantly, and searches and dashboards can be shared with others.