On-demand webinar
New Kibana 5.x Visualizations
Hosted by:

Peter Pišljar
Overview
It's been a visualization bonanza in the Kibana 5.x world. Tag clouds, heatmaps, gauge charts, region maps, and more. Plus, a brand new tool, the Time Series Visual Builder, optimized for looking at time series data. So many new ways to give shape to your Elasticsearch data! Join us for this webinar to get the scoop on the latest and greatest visualizations in Kibana 5.x.
Highlights include:
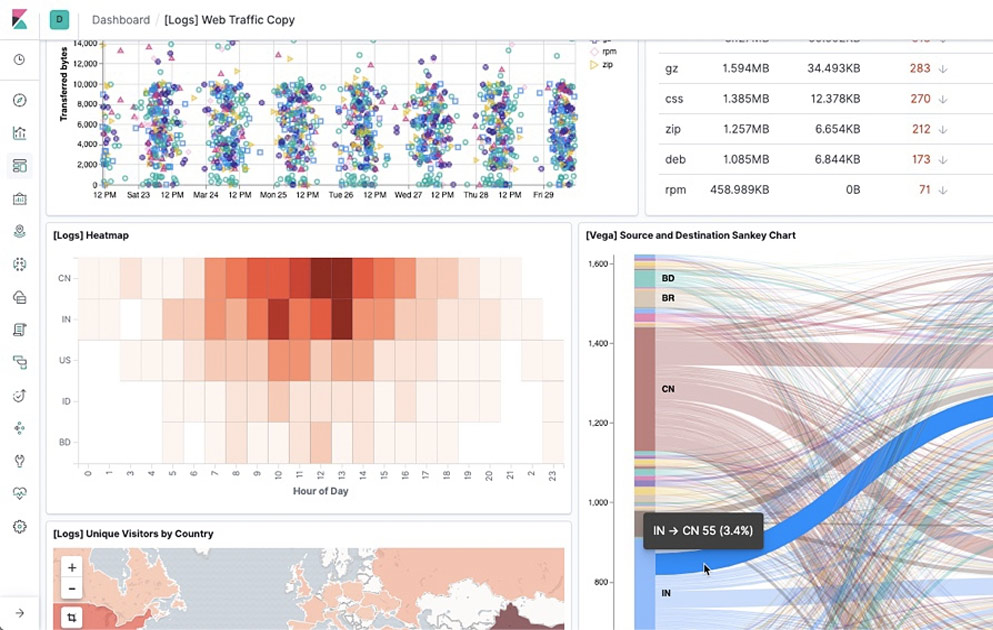
- Tagcloud and Heatmap
- Point series enhancements such as combination charts and support for multiple axis
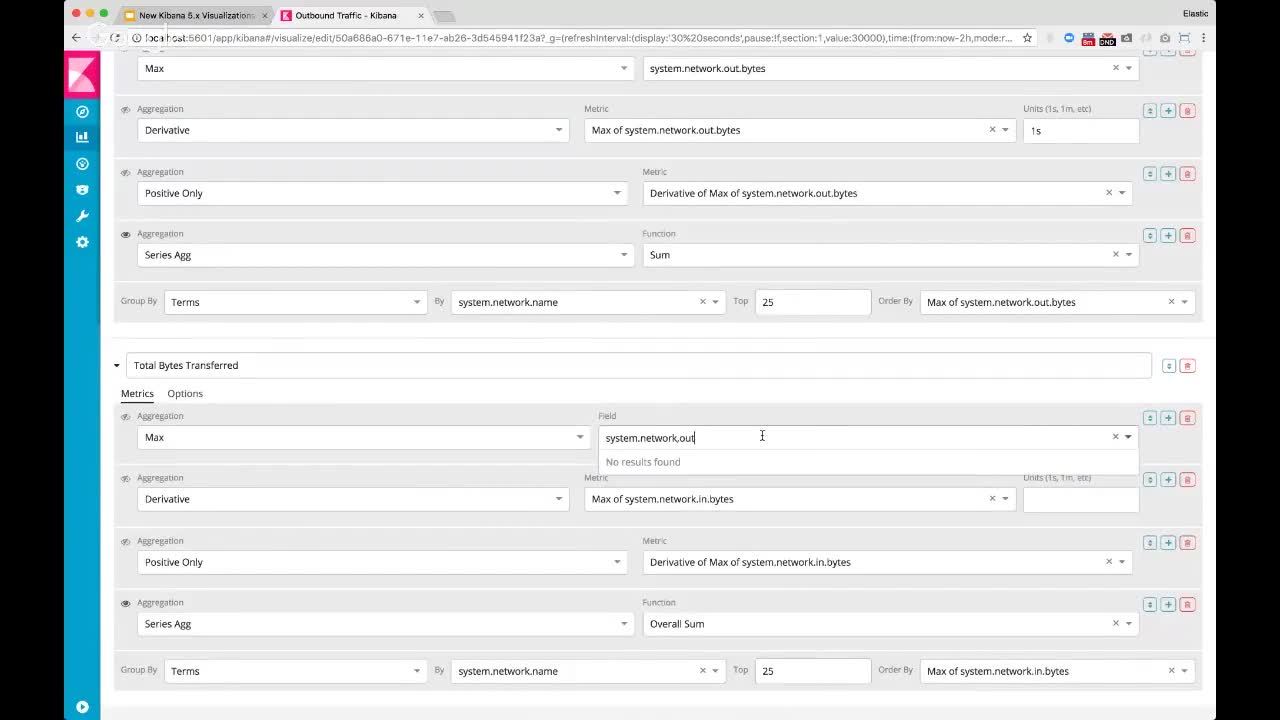
- Support for pipeline aggregations
- More accurate mapping capabilities and a new map type
- Annotations, complex calculations and support for multiple indices with Time Series Visual Builder
Additional Related Resources:
- Kibana Time Series Visual Builder Master Series: Part 1 and Part 2
- Fastest and easiest way to get Elasticsearch and Kibana Elastic Cloud 14-day free trial
View next
Upcoming webinar
Introduction to Elastic Observability: Built for the future with Search AI