Inside the Elastic APM Go Agent
Earlier this year we introduced beta support in Elastic APM for Go application performance monitoring. In this blog post we’ll dive into some of the details of the agent. Some of what we’ll be covering is specific to the code branch for the upcoming "Generally Available" (GA) version of the agent, which uses a revised intake protocol and data model. You can read more about the new intake protocol here.
Before we dive into the internals, let’s talk a little about what the agent does.
A Day in the Life of an APM Agent
At the highest level, the agent’s purpose is to measure and report the response time performance of your Go applications. How does it do that?
To measure the response time of your applications, you instrument your application code with the agent’s API. For each incoming request to, or operations initiated by, your application/service, you record a transaction. A transaction describes the overall time taken for that operation, along with some details describing it (its “context”), and the result (e.g. an HTTP status code). Within a transaction, you can record finer-grained details as spans.
The above describes the agent’s tracing (soon to be distributed tracing) API. Elastic APM also covers exception/error reporting; future releases will cover application metrics, and more.
The agent reports these data to the Elastic APM Server, taking care of all the details of sampling, buffering, encoding, compression, connection management, and more. You just need to instrument your application code, and point the agent at the APM Server and the data will be indexed in Elasticsearch, ready to be visualised in the APM UI.
Minimising Overhead
Go developers tend to have high expectations of performance, so we have paid close attention to the overhead of the instrumentation. Fortunately for us, most of the work has been done already. The Go toolchain comes with some excellent tooling out of the box to analyse code-level performance, such as pprof, and built-in benchmarking. The standard library has been designed, in many places, to provide options to minimise memory allocation overhead. What remains is piecing them together according to our particular constraints.
So what are those constraints? What we strive for in all of our agents is to avoid any interference with application code. This can take shape in many ways, but particularly we must avoid blocking the application code for arbitrary amounts of time, or consuming significant resources -- namely CPU and memory.
To avoid interfering with your application, we ensure that the agent does as much work off the main code path as possible. In practical terms, this means the instrumentation code gathers some data about a transaction, and passes that off to a background goroutine for further processing and eventual transmission to the APM Server. That sounds simple, but it is somewhat nuanced.
Designing for Failure
What happens when the background goroutine cannot keep up with the incoming rate of data from instrumentation? Blocking the application is not helpful, as this would impact the performance being monitored in the first place. We can throw away the data, but this will affect the statistics we report through the UI.
Currently, the Go agent uses a buffered channel to communicate data from instrumented application code to the background goroutine, and the background goroutine will pull entries off that channel as quickly as it can for further processing. If the channel becomes full, the instrumentation throws away the data. Every time an event is discarded like this, a counter is incremented, which will periodically be sent to the server. We don’t currently make use of this, but in the future we will be able to use this information to suggest changes to the sampling configuration.
What happens if the APM Server is unavailable? Whether it be because of a bug or a bird, failures happen and we must design for them to ensure a reliable system.
When the APM Server cannot be reached, we buffer data. Buffering data means consuming memory resources, depriving the application we’re monitoring, so we put a limit on how much is stored. Given a limited buffer, we then need to decide what data to keep and what to throw away and when to do it, we must consider the dropped data in our statistics, and how to do all of this efficiently.
For the Go agent, we have implemented a circular buffer to store the encoded events. Each encoded event consists of an event type, and a sequence of bytes. When the buffer is full, the oldest entry in the buffer is evicted. Each entry is preceded by a header which stores the type and entry size, in bytes. By storing the event type in the buffer, we are able to account for those events that are discarded due to buffer eviction in our statistics.
Designing for Speed
The overhead of the Go agent is about as low as you can get. The time overhead for the net/http instrumentation, measured on a modern but run-of-the-mill developer laptop, comes in at approximately 1.5 microseconds. In general, the performance tuning has come down to one thing: minimising allocations. Let’s look a look at a couple of key optimisations.
The first is the use of object pooling, specifically sync.Pool. Whenever a transaction or span is started, we acquired it from a sync.Pool. When the agent has finished encoding the event — or it was discarded — then it is placed back into the pool. By doing this we can avoid not only those allocations, but also keep hold of associated memory objects (e.g. resetting the length of slices, but retaining their capacity). It is important to note that this must be considered in the API design: to enable object pooling, we require callers not to refer to transactions or spans after they have been ended.
The next major optimisation is how we implement JSON encoding. The Go standard library provides a very friendly, easy to use package for encoding and decoding JSON: encoding/json. The initial implementation of the Elastic APM Go agent used this package (we’re strong believers in first make it work, then make it right, and, finally, make it fast), but marshalling quickly became one of the dominating resource consumers. There are several reasons for this: encoding/json relies heavily on reflection, and in parts its API forces allocation (theoretically encoder/json.Encoder.Encode could avoid allocations, but in practise it does not.)
There are various alternative JSON encoders out there already: easyjson, ffjson, go-codec, to name a few. Ultimately, none of them had the performance that suited our specific constraints, but we did use them for inspiration. In the end we were able to implement a zero-copy, zero-allocation JSON encoder without relying on sync.Pool, instead encoding directly into a reusable buffer. Like the aforementioned packages, our implementation relies on code generated by parsing struct definitions.
$ go test -benchmem -bench=. -run=NONE github.com/elastic/apm-agent-go/model
goos: linux
goarch: amd64
pkg: github.com/elastic/apm-agent-go/model
BenchmarkMarshalTransactionFastJSON-8            1000000              1418 ns/op         585.70 MB/s           0 B/op          0 allocs/op
BenchmarkMarshalTransactionStdlib-8               200000              9303 ns/op         127.91 MB/s        1088 B/op         23 allocs/op
PASS
ok      github.com/elastic/apm-agent-go/model   3.403
At the moment, the fastjson encoder is buried in an internal package directory of the Go agent, but we plan to move it to its own repository in the near future so others can make use of it too.
Continuous Benchmarking
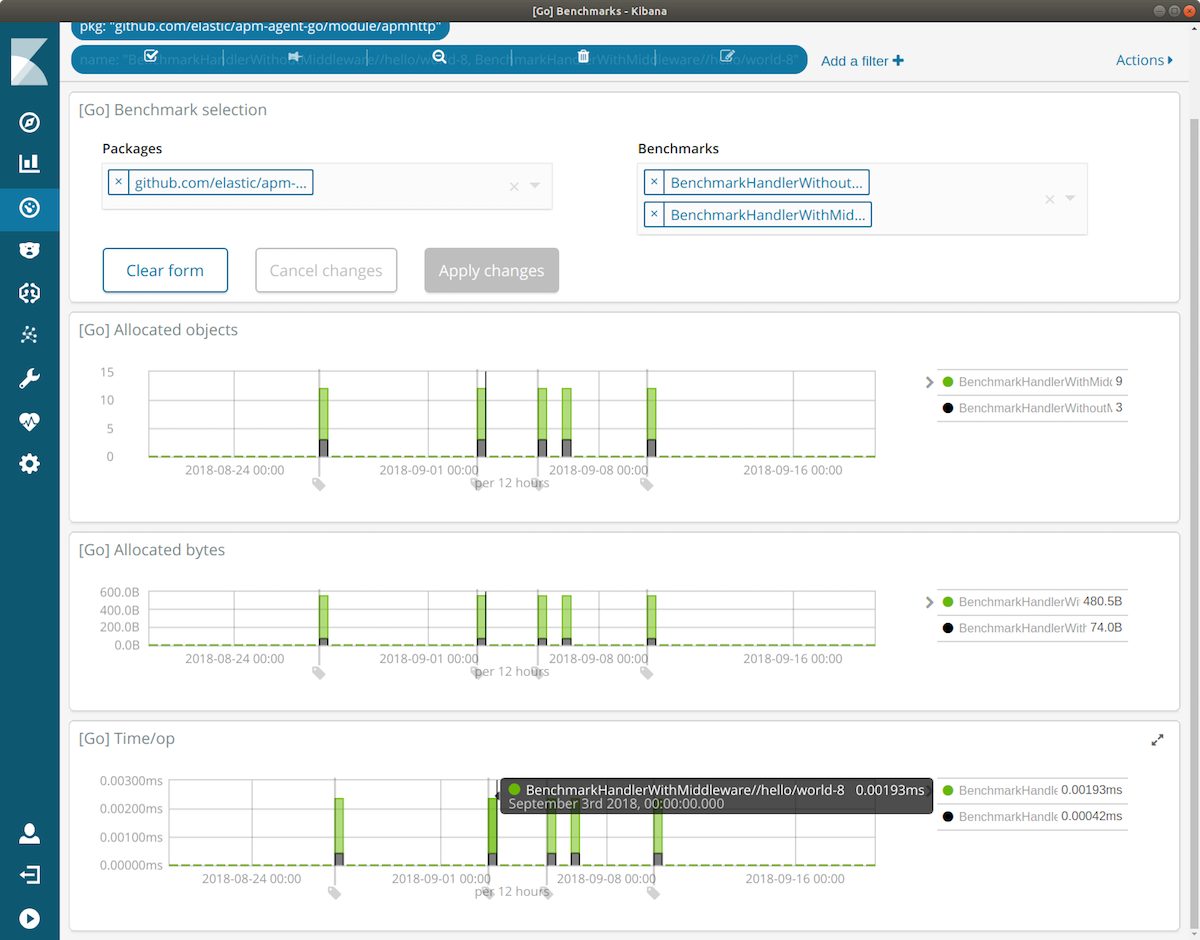
At Elastic, we “drink our own champagne”: we use the Elastic Stack for analysing just about everything we do, and that includes storing build results and benchmark data for analysis. For the Go agent we created gobench, a tool for storing go test -bench output in Elasticsearch, making it straightforward to graph benchmark data over time, and identify offending changes.
We will cover agent benchmarking in greater detail in a future blog post. For now, feel free to give the gobench tool a try and let us know how it works for you.