Tutorial: Getting Started with Elastic Cloud with a Sample Dataset
| DON'T PANIC. This article contains instructions for Elasticsearch 2.x and Kibana Version 4.x, but still works. An updated version for 5.x can be found here. |
Getting an Elasticsearch environment up and running has never been easier. With Elastic Cloud, you can launch your cluster and start ingesting data in literally minutes. See how in this 3-minute video. This step-by-step set of instructions will walk you through setting up an Elastic Cloud account, creating and securing a Elasticsearch cluster, importing data, and visualizing it in Kibana. So, let's get started.
Log into Elastic Cloud
- Go to https://cloud.elastic.co in your browser and sign up for an account.
- You will receive a confirmation email. Open it and follow the instructions to start your trial.
- Log into your Elastic Cloud account
Create your first hosted Elasticsearch cluster
- Once you have signed in, go to the Cluster tab to create your cluster.
- Select cluster size. I will select a cluster with 4GB memory and 64GB storage
- Choose a region that is close to your location. I am choosing US West.
- Select replication. I am choosing only one Datacenter location.
- Click on Create to provision your cluster. Provisioning will start and you will receive a notification once it's complete.
Secure your Cluster
Next, let's configure cluster access and security.
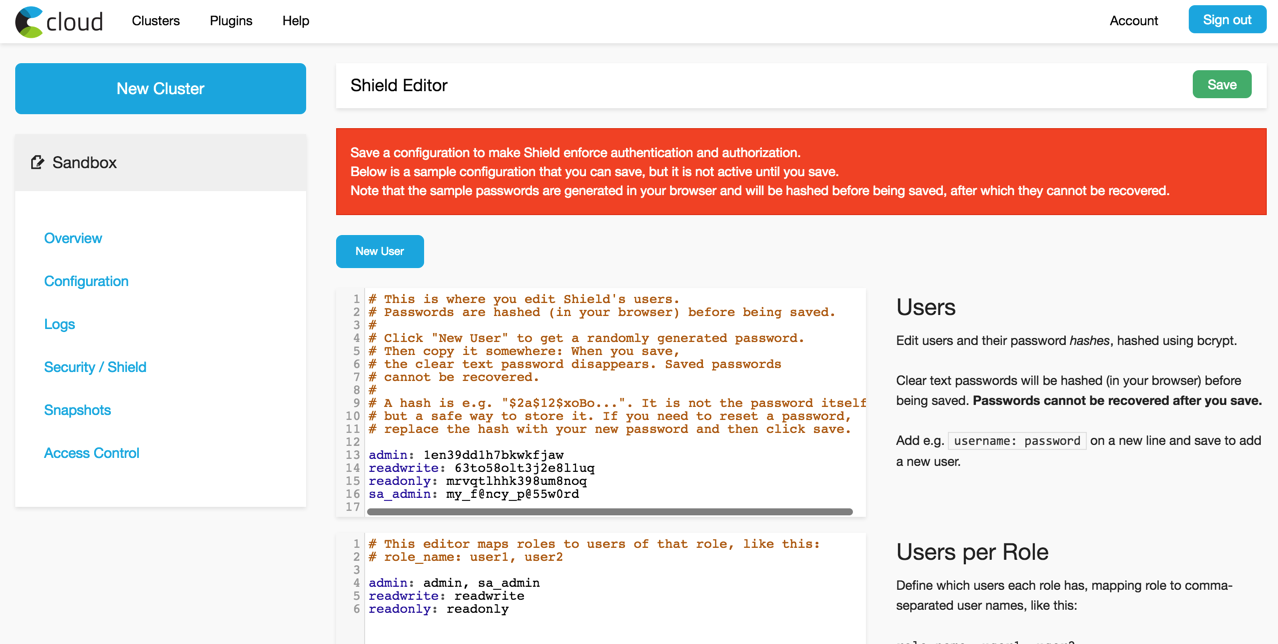
- Click on the Configure Shield link on the Overview page.
- Create additional users and/or configure existing usernames and passwords. I will create a new user, sa_admin
- If you added new users, configure their roles. I will configure sa_admin user with admin role
- Copy the usernames and password before hitting the Save. This is important because the passwords are hashed once you save the config. Save your credentials in a secure vault. Or a Post-it note 😉.
You can update your passwords or add additional users using the same process. You may also use the new security API that is included in 2.3.1 by following the instructions in our documentation.
Enable Kibana
- To enable Kibana, go to the Configuration link and go to the Kibana 4 section.
- Select Enable from the dropdown list, then click Update. The displayed endpoint is how you access Kibana - it is unique for your cluster.
- Click on the link and to open Kibana in a new tab.
- Log into Kibana with username & password configured in the previous step.
Elasticsearch Endpoint
Once you are logged into Kibana, you will first see the Discovery tab. However, there is no data to visualize. Next, we will work on ingesting data into Elasticsearch. Let's gather some information so we can be successful.
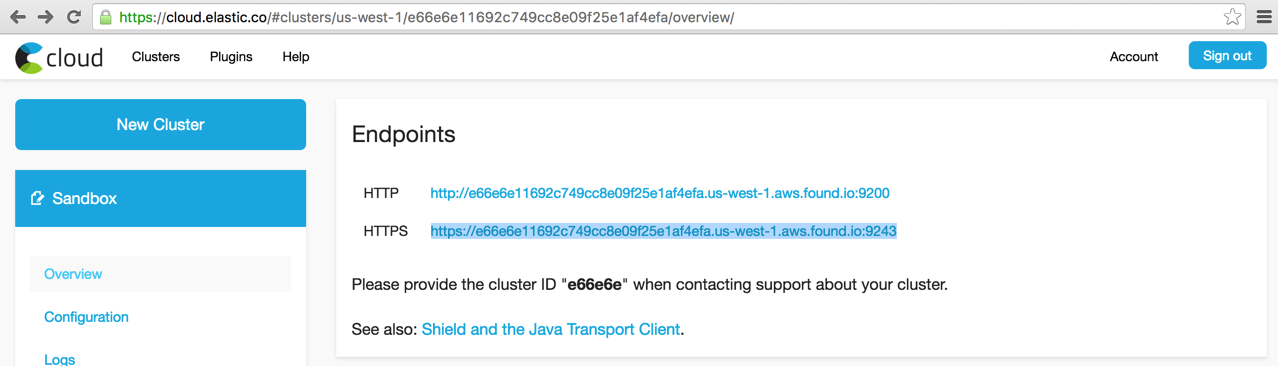
- Go to the Overview link in the Elastic Cloud console. The listed endpoints are used for API access for your cluster.
- Click on the https link, this will show the cluster. Copy the https URL; this will be used in the following steps.
Import Data
Now, let’s get some data into our Elasticsearch cluster to see the Elastic Stack in action. If you don’t have a sample dataset handy, use one from the various data samples in our GitHub Examples Repo. I will be using the Apache logs sample and Logstash (download your system version). To ingest the logs into our hosted Elasticsearch cluster, we will need to modify the elasticsearch output of the Logstash config included in the example.
1. Download the repository, and change to the directory that contains the apache_logstash.conf file. Be sure to replace hosts endpoint in the config with your own cluster endpoint (copied in the previous step)
2. Modify username and password to the user account with write access configured Secure Elasticsearch section. I will be using sa_admin user
elasticsearch {
   hosts => "https://e66e6e11692c749cc8e09f25e1af4efa.us-west-1.aws.found.io:9243/"
   user => "sa_admin"
   password => "my_f@ncy_p@55w0rd"
   index => "apache_elastic_example"
   template => "./apache_template.json"
   template_name => "apache_elastic_example"
   template_overwrite => true
}
3. Run the following command to index the data into Elasticsearch via Logstash:
cat ../apache_logs | <Logstash_Install_Dir>/bin/logstash -f apache_logstash.conf
4. You can verify your data exists in Elasticsearch by going to ES_ENDPOINT/apache_elastic_example/_count, where ES_ENDPOINT is the Elasticsearch endpoint URL. You should see the count as 10000.
{"count":10000,"_shards":{"total":1,"successful":1,"failed":0}}
5. You can verify the health of your cluster by going to ES_ENDPOINT/_cat/indices. You should see your apache_elastic_example index listed along with its statistics:
health status index              pri rep docs.count docs.deleted store.size pri.store.size
yellow open   .kibana              1   1          2            0     19.1kb         19.1kb
yellow open   apache_elastic_example   1   1      10000            0      7.3mb          7.3mb
Visualize Data
Now let's access your Kibana instance and continue with the example instructions to visualize our data.
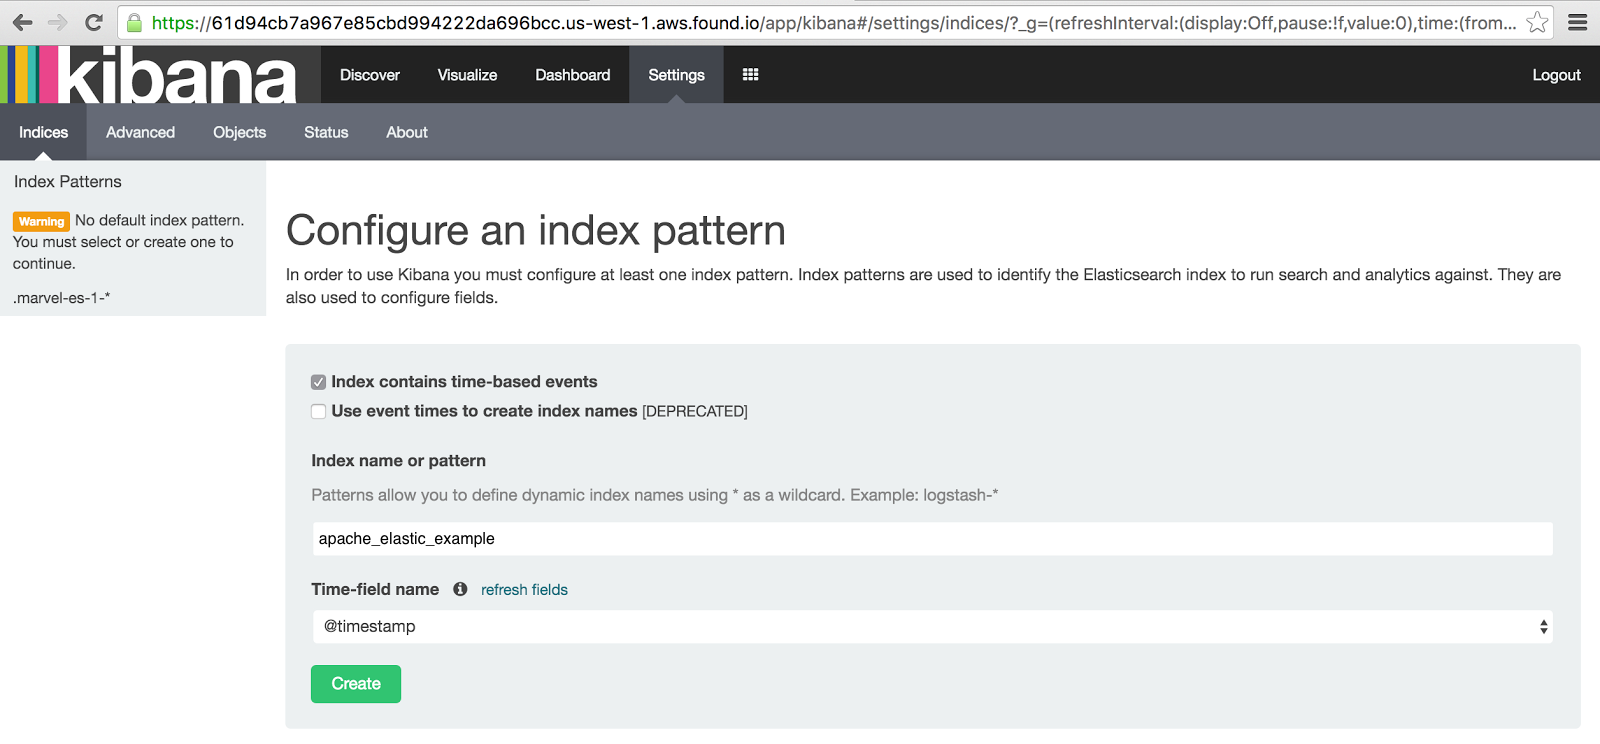
- Go to Indices options under the Settings tab and add the apache_elastic_example index to Kibana
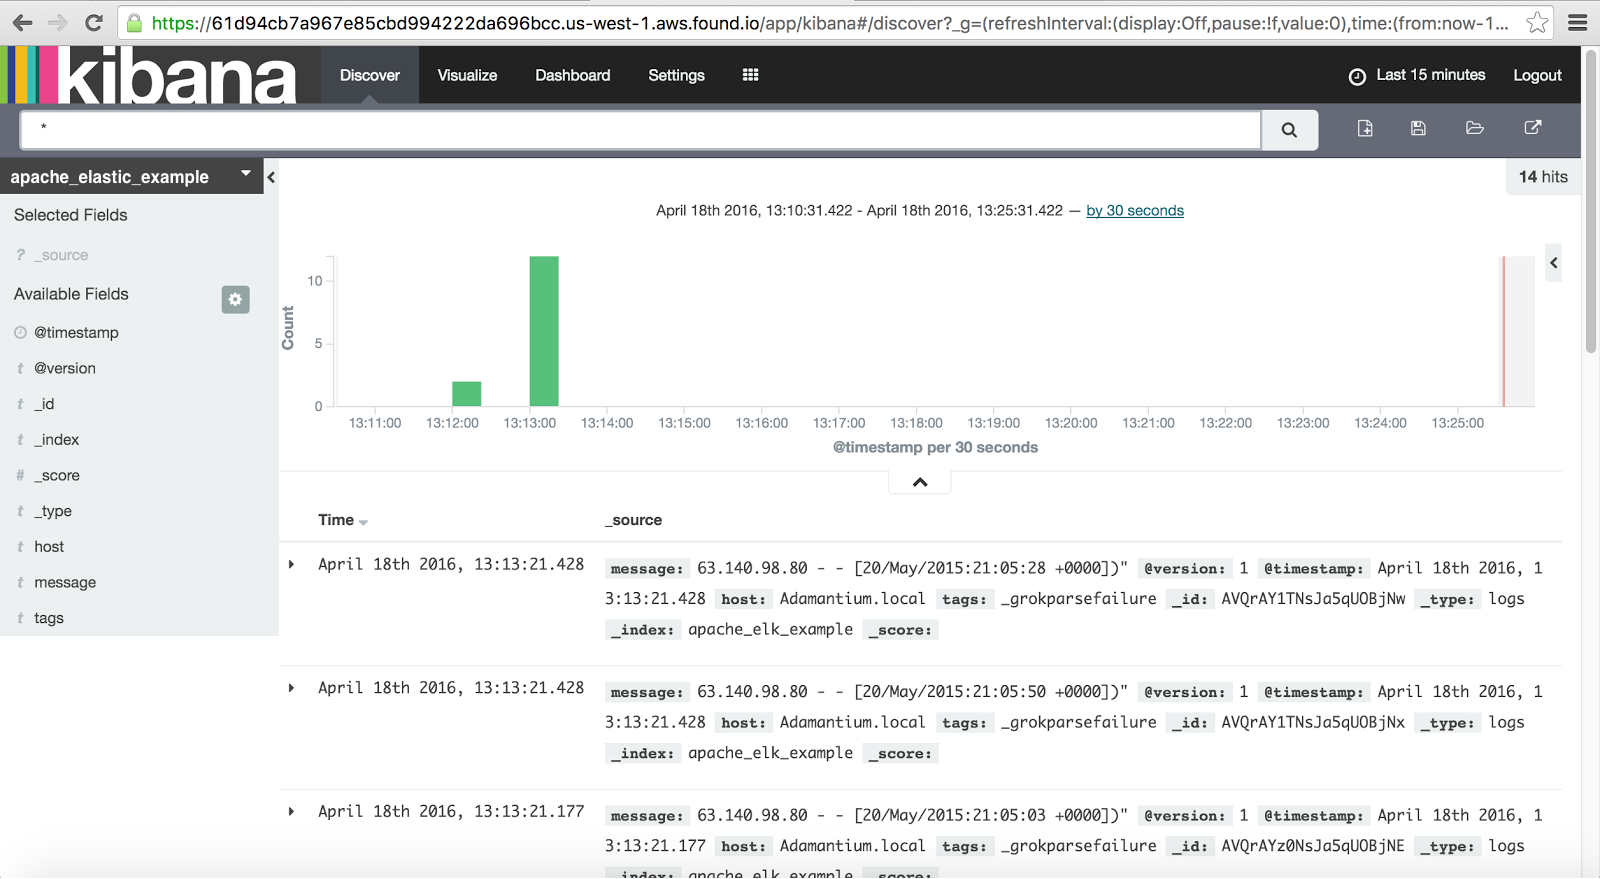
2. You can look at your data by selecting apache_elastic_example index on the Discovery tab.
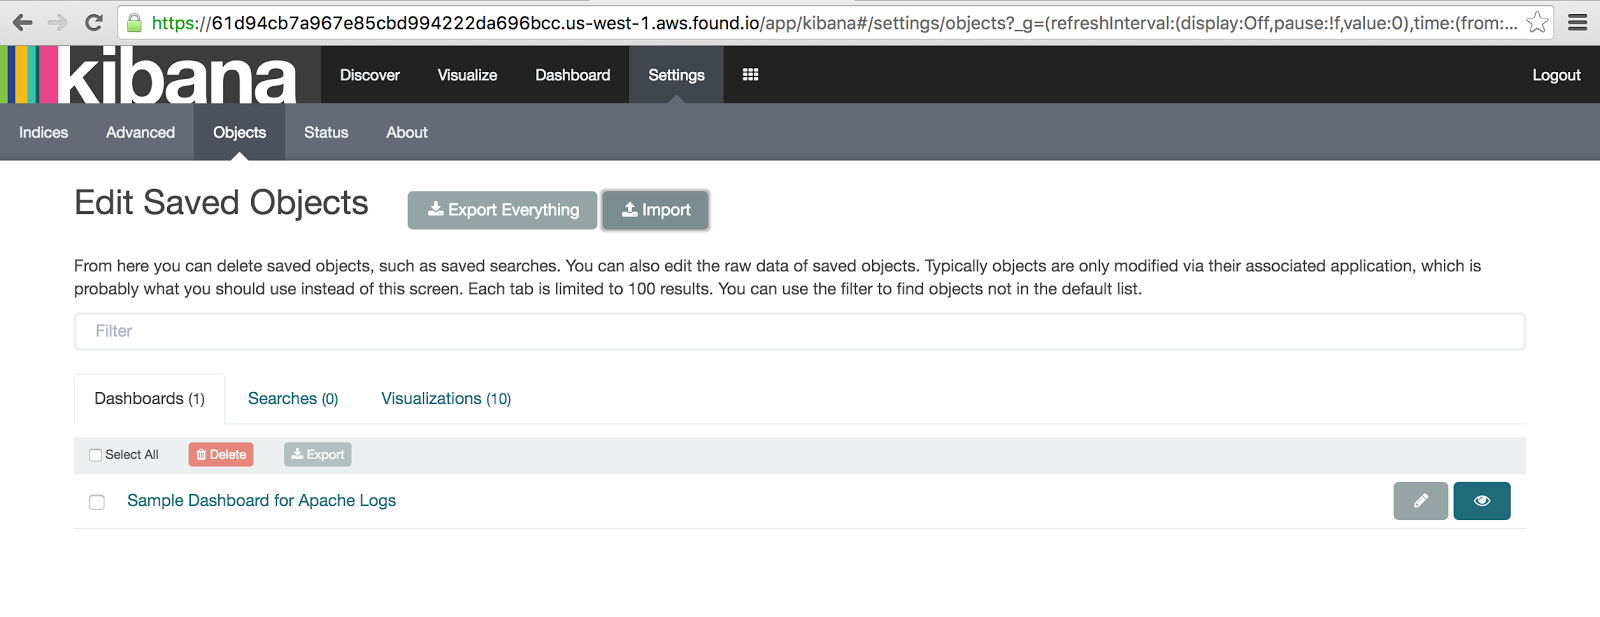
3. Import the examples dashboard by clicking on Settings > Objects > Import and selecting the apache_kibana-4.json file. You can view this dashboard by clicking on the view button (eye icon) or by going to the Dashboards tab and clicking the Load Saved Dashboard button.
Now you have some sample Apache log data in Elasticsearch and you can begin to get some insight and more importantly value from your logs. You can continue exploring with other sample datasets from the Examples repo and the Kibana getting started guide or start sending your own data by using Logstash or Beats.
Here are some other useful links to help you on the journey of using the Elastic Stack on Cloud.
- Cloud https://www.elastic.co/guide/en/cloud/current/index.html
- Kibana https://www.elastic.co/guide/en/kibana/4.5/index.html
- Security https://www.elastic.co/guide/en/shield/2.3/index.html
- Elasticsearch https://www.elastic.co/guide/en/elasticsearch/reference/2.4/index.html
- Beats https://www.elastic.co/guide/en/beats/libbeat/1.3/index.html
- Logstash https://www.elastic.co/guide/en/logstash/2.4/index.html
- The Definitive Guide https://www.elastic.co/guide/en/elasticsearch/guide/current/index.html
Or, you can continue your Training with some official classes by some world class Education Engineers: https://www.elastic.co/training
Editor's Note (July 27, 2017): We've updated some links and content to direct to more current resources (e.g., GitHub repos and documentation) and reflect more accurate information.