Easily Visualize Spreadsheet Data with Elasticsearch & Kibana
IMPORTANT NOTES: This article refers to our hosted Elasticsearch offering by an older name, Found. Please note that Found is now known as Elastic Cloud. Also note that the add-on does not automatically work with versions 5.x and above. To benefit from 5.x using this add-on, you must index the data into a 2.4.4 cluster and then upgrade.
Our latest Google Sheets add-on makes visualizing your spreadsheet data a snap.
Today, we're rolling out a new Google Sheets add-on that makes it easy to do just that. Using this add-on, along with Found, Elastic's hosted and managed Elasticsearch offering, you can push data from a spreadsheet to your Elasticsearch cluster and get up and running with Kibana visualizations in just a few minutes.
Setting Up a Cluster
If you already have a cluster you want to push data into, you can skip to the next section about pushing data. If not, we recommend you take a moment to sign up for a free hosted Elasticsearch cluster before continuing. With just a few clicks, you will have a secure cluster up and running, including Kibana 4 for visualizations.
Watch this short demonstration video on how to spin up a free hosted Elasticsearch cluster.
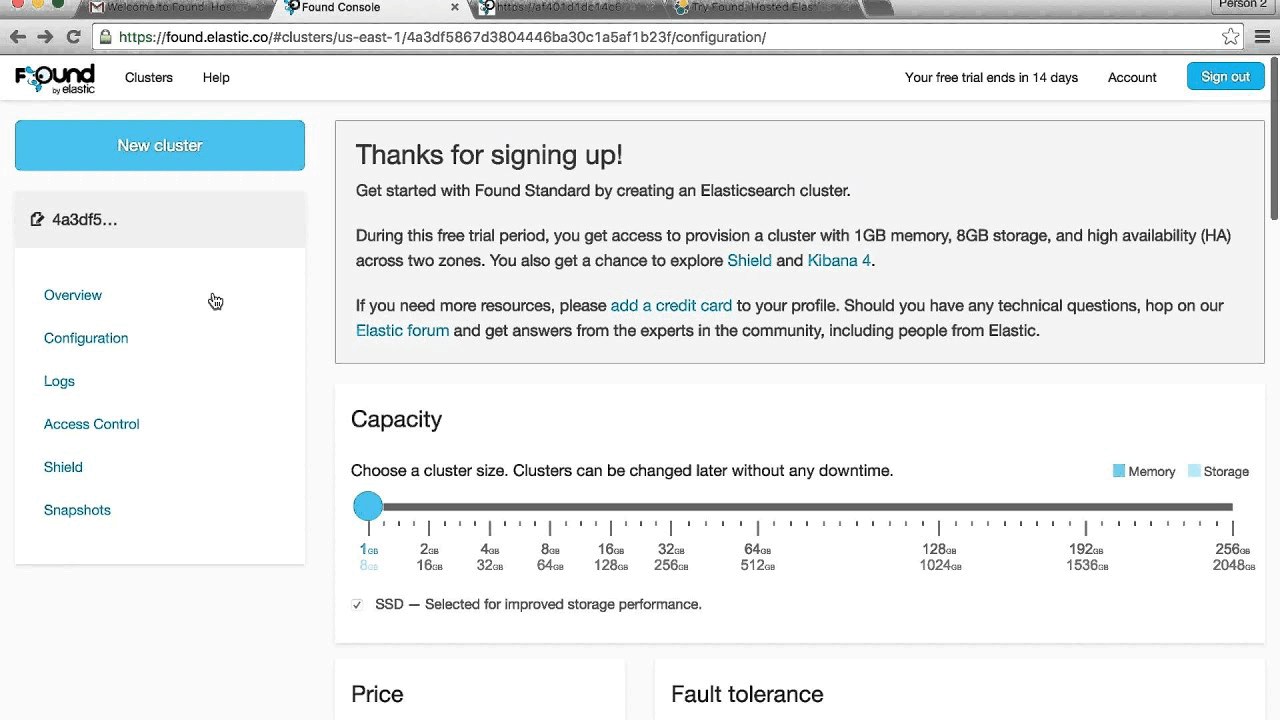
After completing the sign up and configuration for Found, you should see a couple of endpoints displayed that look like this:
http://.us-east-1.aws.found.io:9200
https://.us-east-1.aws.found.io:9243
We will use those later to send data to your cluster.
Pushing Data to Your Cluster
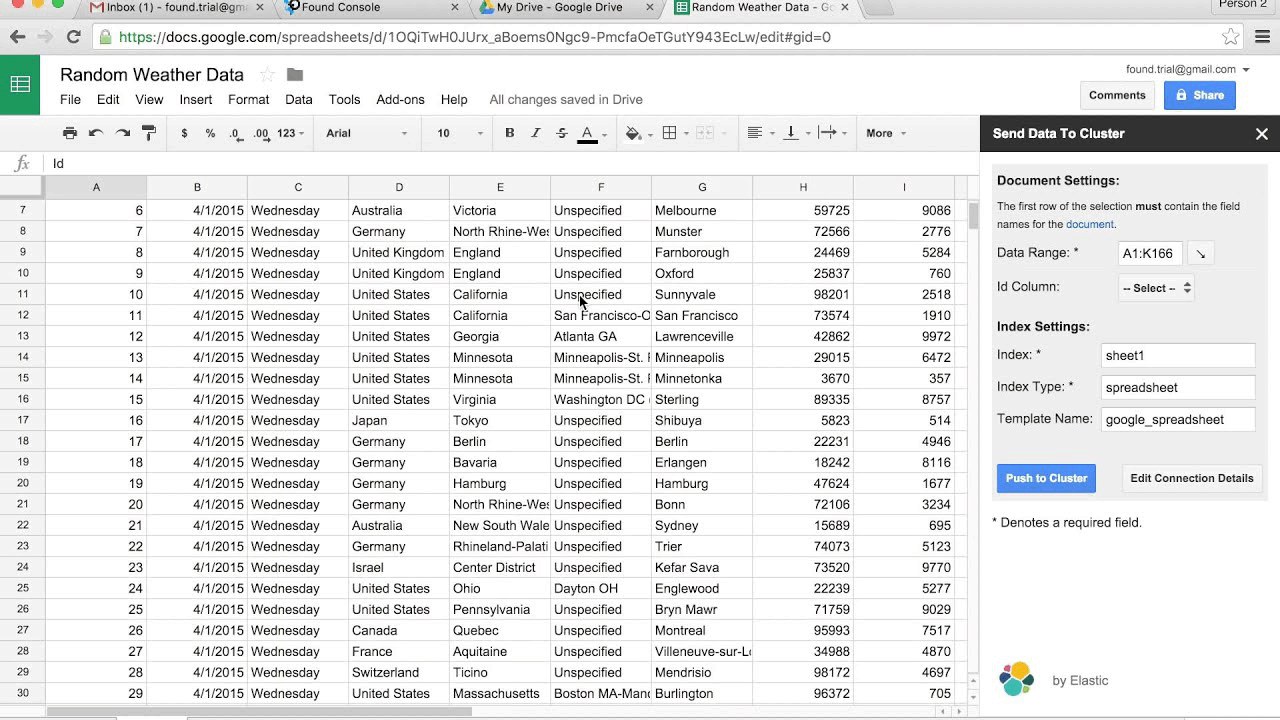
Our cluster is ready to go, so now it's time to open up your Google Sheet and get started. The video below walks you through the steps in detail.
- Install the Spreadsheet to Elasticsearch Google Sheets Add-on.
- Under the add-ons menu, choose "Push to Cluster…" to get started.
- Add your connection details for your cluster, including a username and password if required.
- After testing your connection, save it and click "Edit Data Details."
- Verify that the proper data range is selected on your spreadsheet, including the headers in the first row.
- Update the name of the index and document type where your spreadsheet data will be stored in your cluster.
- If you know what you're doing, you can update or remove the Index Template. By default, it will create non-analyzed fields with your data, which is useful when visualizing.
- Click "Push to Cluster." After a few seconds, you should see a note with a link to your data.
Helpful Tips
For those of you interested in contributing or understanding how this works, feel free to check out the code hosted on the Spreadsheet to Elasticsearch GitHub repo. Here are a few helpful tips in case you get stuck:
- The "Host" is the URL of your cluster (or your endpoint from Found), without the https:// or the :9243 at the end.
- The username and password are for accessing your cluster directly, not the ones used to log into the service hosting your cluster such as Found.
- If you want to check to make sure everything is ok, click the "Test" button and the add-on will try to connect to your cluster using the information you provided.
- Empty rows will be skipped, so don't worry about those.
- To avoid duplicates in your cluster, select a unique identifier for each row using the Document ID field. Then, if you update data in your spreadsheet, you can push the updates without creating duplicates.
- If you are not familiar with index templates, just use the default name. If you get a note about indices not matching, just choose a new name for the index template name.
Visualizing it with Kibana
After you have your data indexed into Elasticsearch, the easiest way to visualize it is with Kibana. If you are using Found, the URL for Kibana 4 can be found under the "Configuration" section of your cluster. You can browse the Kibana 4 documentation or check out this helpful Getting Started with Kibana Webinar.