Elastic APM 6.6.0 Released
Elastic APM 6.6 is here, and it's brought a lot of enhancements. Let's get right into it...
Metrics
Infrastructure and application metrics are important sources of information when debugging production systems. As part of the 6.6 release, the latest APM agents will automatically pick up basic metrics, such as system and process-level CPU and memory metrics. The metrics will be visualized in the new service Metrics tab in the APM UI.
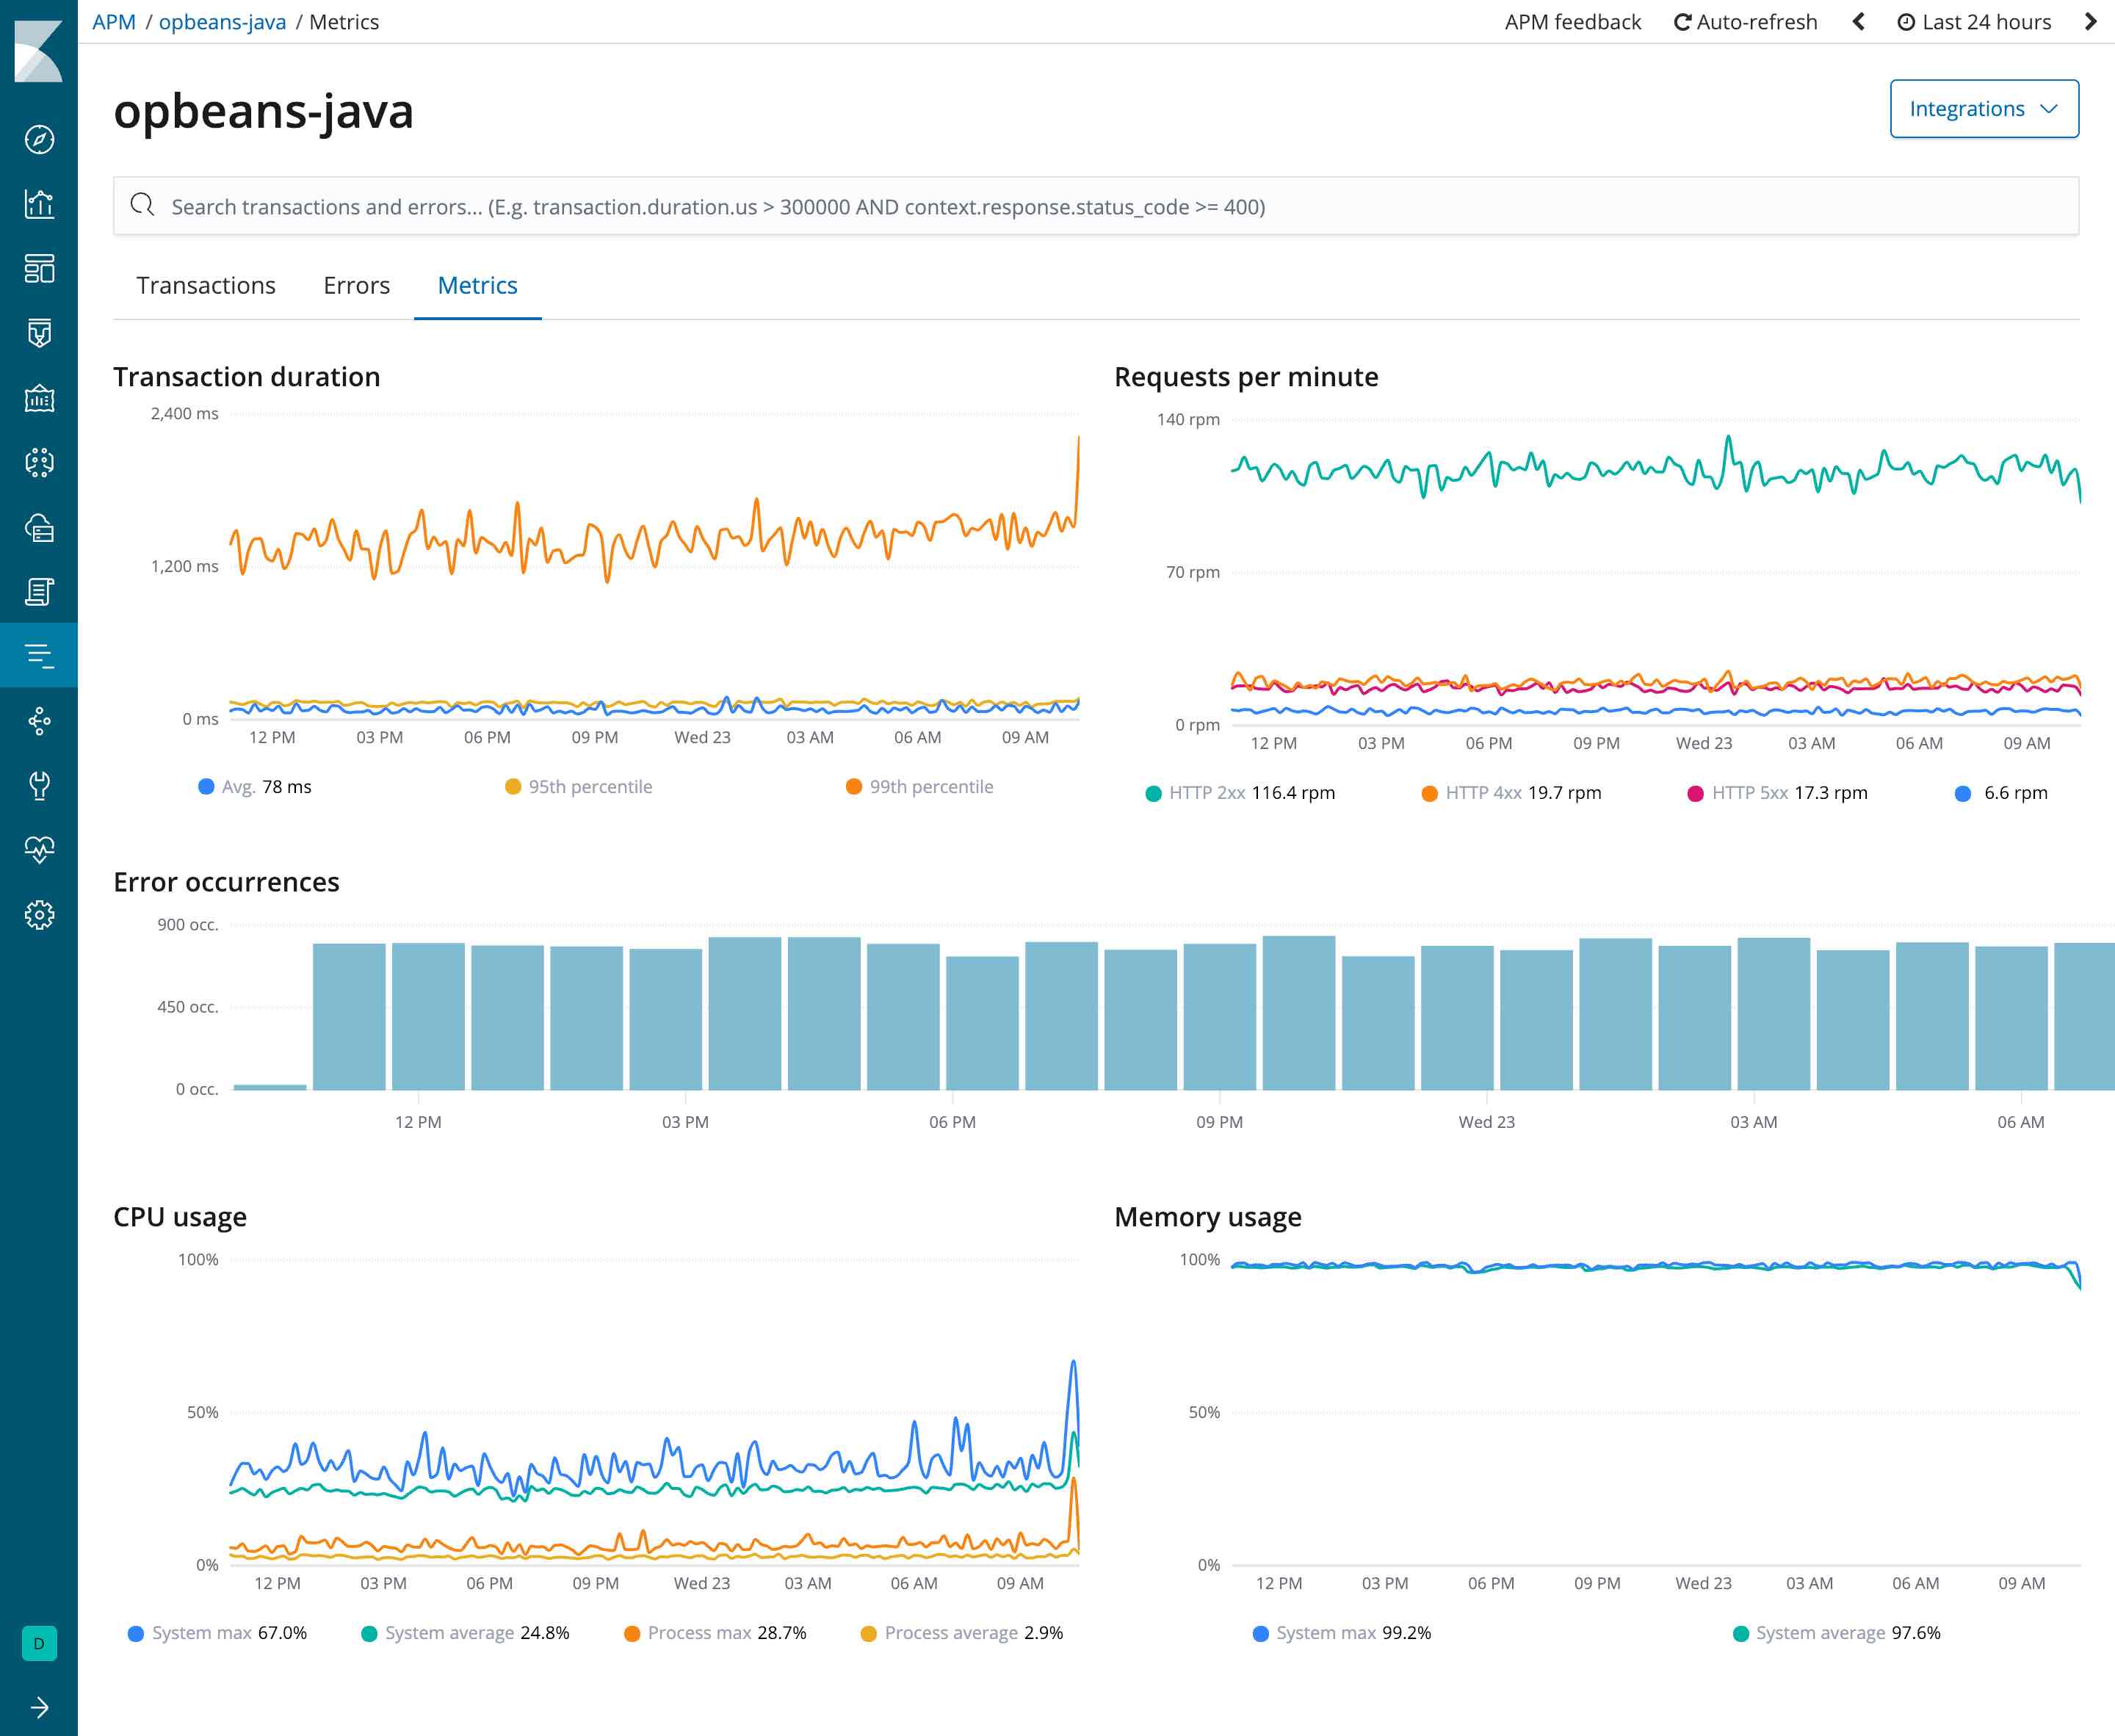
Using the search bar, you can easily filter down the metrics shown for specific hosts or containers. There are already additional metrics sent by some agents that you can graph using the “Visualize” tools in Kibana. For example, the Java agent sends JVM metrics and the Go agent sends metrics on the Go runtime. Make sure to use the apm-*-metric-* index pattern to graph these.
Distributed tracing is now generally available
We shipped support for distributed tracing in beta 6.5 release. Distributed tracing is becoming a key feature in modern application performance monitoring as application architectures are shifting from monolithic to more distributed and service-based.
Distributed tracing allows APM users to automatically trace requests all the way through the service architecture, and visualize those traces in one single view in the APM UI. In the 6.6 release, we've polished the UI and are now removing the beta label and marking it as generally available. Distributed tracing is supported by all APM agents, including the JavaScript RUM agent.
Supporting OpenTracing and Trace Context
Elastic APM supports the W3C Trace Context working group's effort to standardize the HTTP header format for distributed tracing. Our agent implementations closely follow the Trace Context draft specification, and we intend to fully support the final specification. Additionally, all agents now have OpenTracing compatible bridges.
Integrations with Infrastructure and Logging
We recently shipped two new exciting products in early Beta: Logging and Infrastructure. These are dedicated apps for the logging and infrastructure metrics use cases. The logging app enables you to live stream log events and the Infrastructure app provides you with a point in time snapshot of your infrastructure. For more details, check out this Logs and Infrastructure UI blog post.
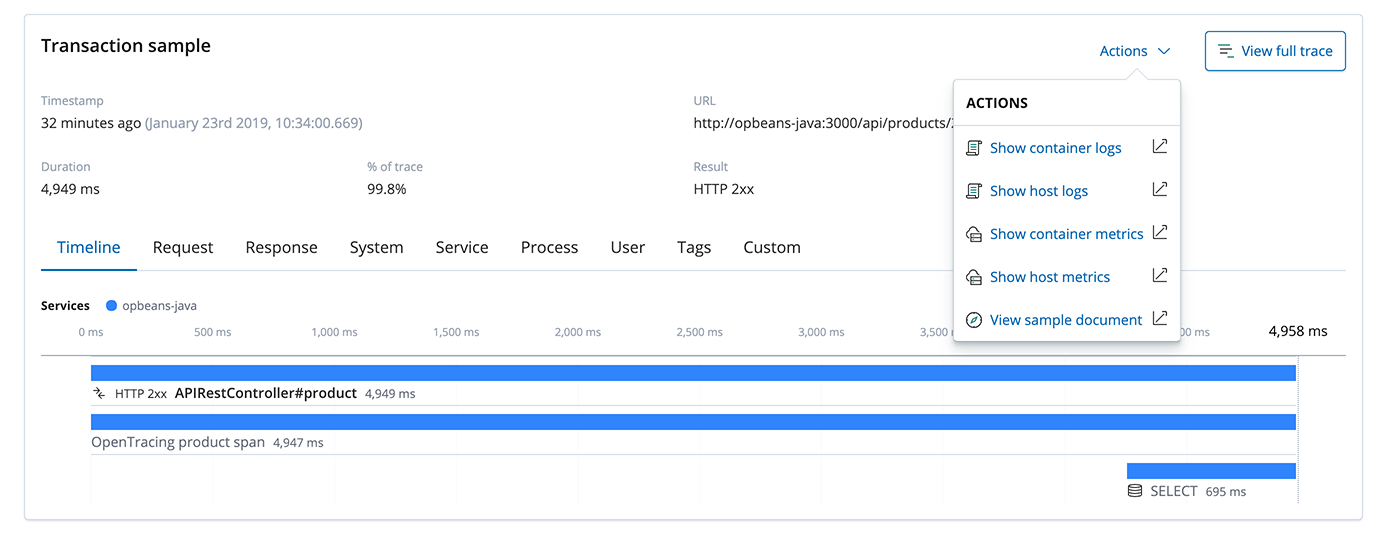
Having logs, metrics, and APM traces stored and indexed in Elasticsearch is super powerful. For example, a trace might be slow due to issues with the container it was served from, not the code itself. Being able to quickly correlate data sources like infrastructure metrics, logs and traces enables you to debug the root cause much faster.
In the APM UI, we've just released the first integration between the APM, Logging and Infrastructure apps. When looking at a trace, you can now quickly jump to the host or container metrics and logs by clicking the Actions menu. Here's a screenshot of the integration points:
Java agent updates
The Java agent has released two great new features: wildcard tracing and easier agent attachment.
Wildcard method tracing
The Java agent doesn't automatically trace methods. You can manually annotate methods in the source code to have them instrumented, but now we're adding a new way of tracing methods.
trace_methods takes a list of methods to automatically instrument. The syntax is modifier fully.qualified.class.Name#methodName(fully.qualified.parameter.Type). You can use wildcards for the class name, the method name and the parameter types. The * wildcard matches zero or more characters. Specifying the parameter types is optional. The modifier can be omitted or one of public, protected, private or *.
A few examples:
org.example.MyClass#myMethodorg.example.MyClass#myMethod()org.example.MyClass#myMethod(java.lang.String)org.example.MyClass#myMe*od(java.lang.String, int)private org.example.MyClass#myMe*od(java.lang.String, *)* org.example.MyClas*#myMe*od(*.String, int[])public org.example.services.*Service#*
We're planning to post an in-depth blog post on method level tracing with Java in the near future. Until then, check out the trace_methods documentation.
Easier agent attachment
This experimental installation method does not require you to alter the configuration of your application server and can be used to conveniently instrument all JVMs on a particular host. This works by running a small background program which attaches the Elastic APM Java agent to a specific JVM or to all running and starting JVMs. This means there is a lot less you have to configure and you don't have to touch the configuration files of your application server at all.
For more details, check out the automatic agent attacher documentation.