Elastic APM 6.4.0 Released: The Search Edition
Here's a summary of all of the good stuff that went into the APM 6.4 release. If want to learn more about Elastic APM, visit our solution page, or grab it from our download page.
APM Server
The server now supports Logstash and Apache Kafka as outputs! With these outputs, APM Server enables more flexibility to your infrastructure configuration, as Elasticsearch isn't required to be directly reachable by the APM Server any longer.
The Logstash output sends events directly to Logstash, Elastic's data processing pipeline. This allows you to perform additional processing and routing of generated events, before they reach Elasticsearch. For example, geoip enrichment of the APM transactions and errors, or to leverage mutate or fingerprint filters, to mangle your data.
APM UI
We've added two major features to the Kibana APM UI in this release. The first is a concept that should sound familiar.
Search

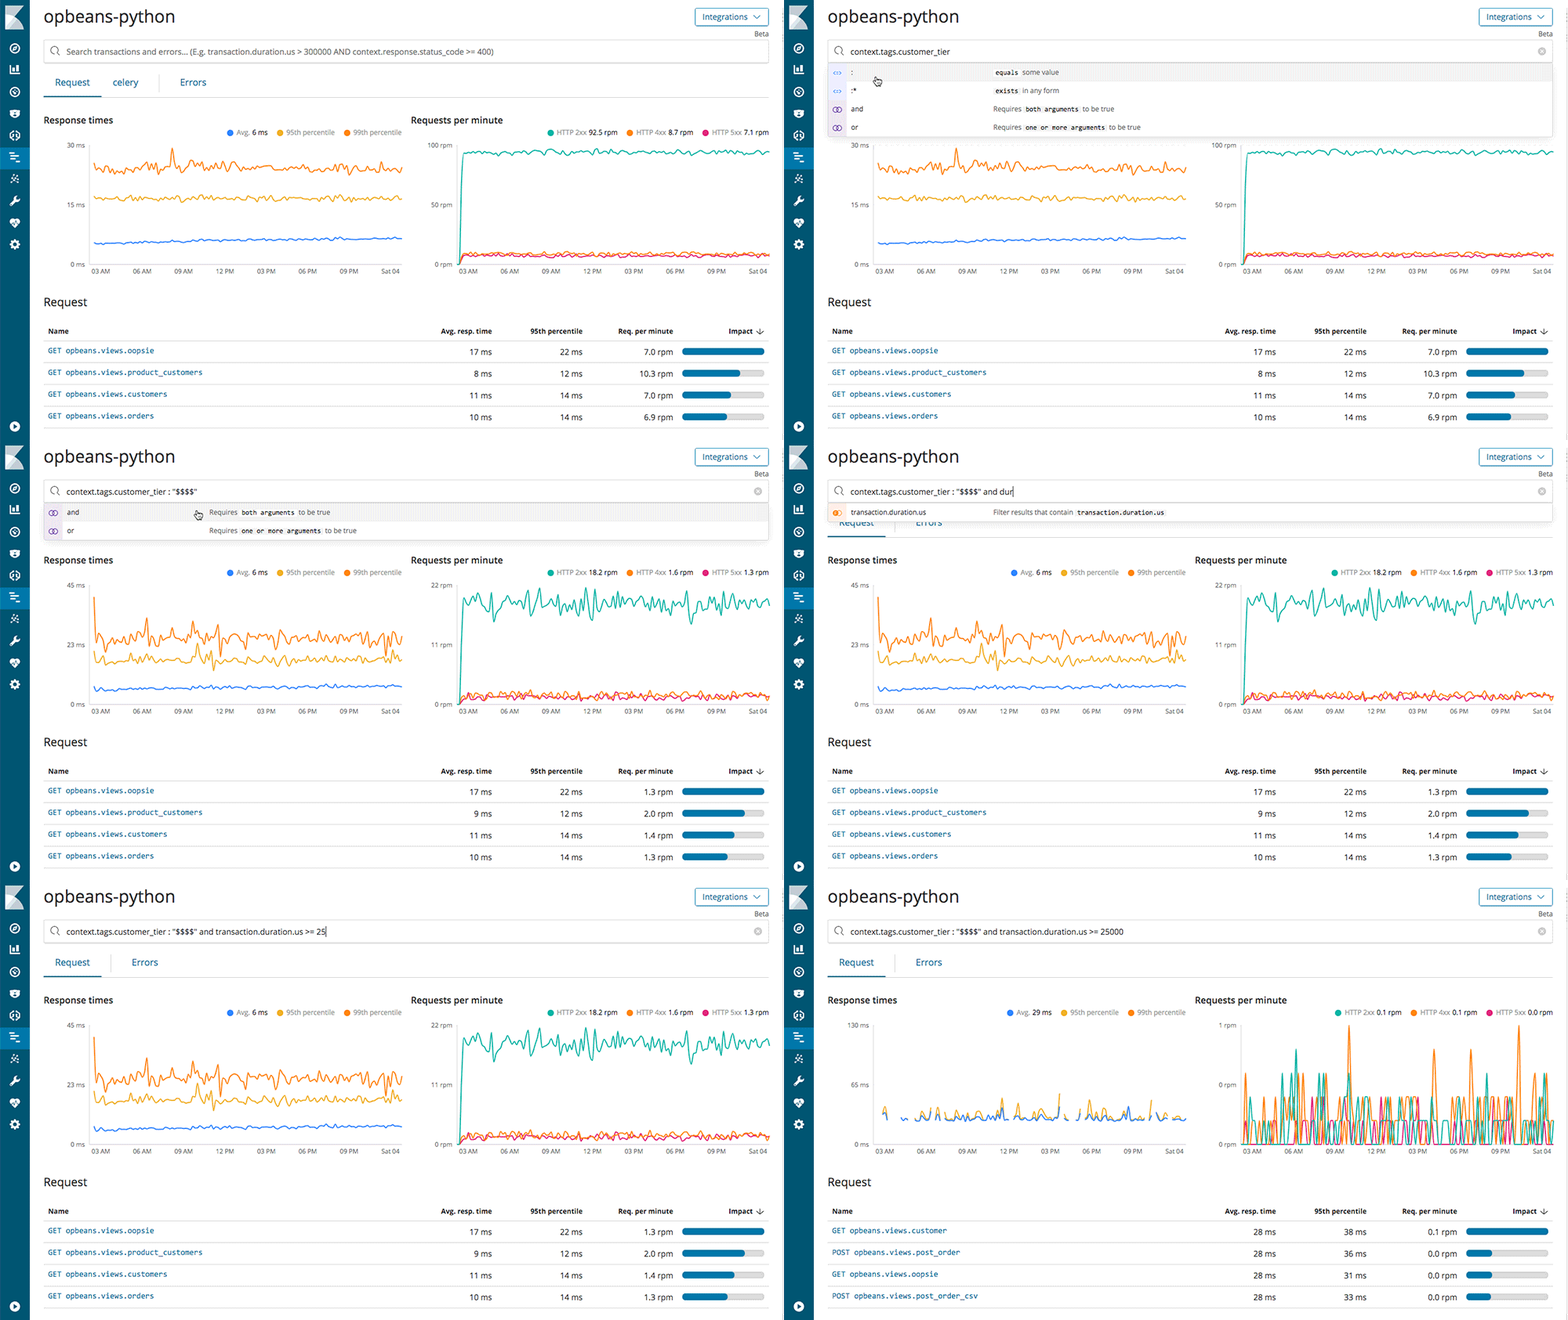
After all, APM is a search use case. By glancing at APM dashboards, you get a good sense of the overall health of your applications, but what if you want to dig deeper? Search is a wonderfully fast and powerful way to filter APM data, and now we've brought the power of Elasticsearch right into the APM UI.
The search bar enables you to filter transactions or errors in real time. You can search by any default metadata- fields that describe each request. Search on fields related to the infrastructure, like environment or host name. Dig into requests, filtering on endpoint name. Dig into request fields like endpoint name. You can concentrate on the response fields, such as status code, duration, or exception messages. Since it is Elasticsearch you can mix and match your criteria. If you append custom tags to your transactions or errors (for example, customer segment, so that you can ensure that heavy volume customers are experiencing as good performance as low volume customers) you can search those, too
The second feature turns up the dial on automation, providing insight into your response times.
Machine Learning Integration
 It's already possible to trigger static threshold alerts on slow response times by manually creating Watches. However, since web applications are dynamic, static thresholds can become noisy. With the new Machine Learning (ML) integration, it's now possible to enable ML jobs to detect anomalies on service response times - and it's as easy as clicking a button in the APM UI.
Activating the integration will create and start a predefined ML job on the APM indices. If the ML job detects severe (>= 75) anomalous high-mean response times those will be annotated on the Response times graph. For more details, you can follow the link to the full results of the job in the ML page. To enable alerts on any anomalies, use Watcher to monitor the ml-results index.
APM Agents
We're continuously adding support for new agents, and improving existing agents. As of 6.4, we've promoted our Real User Monitoring (JavaScript) and Ruby agents to GA! (blog post)
Real User Monitoring (RUM) enables you to track performance in the end-user client (browser) and understand how different clients and geographical locations are impacting the end-user experience. Keep an eye out for an upcoming blog post on the RUM GA agent release.
For Python, we've added automatic instrumentation of Cassandra, PyODBC and PyMSSQL. In Node.js, we added instrumentation of Cassandra, along with broader support for MySQL
Finally, ICYMI, we recently promoted our Java and Go agents to Beta. You can read the details about them here and here.
Future
We have a lot of exciting things we are currently working on. One of those things is adding support for distributed tracing. In microservice-oriented architectures, requests are often processed by multiple services. This can make it hard to troubleshoot latency problems and to find out the root cause of an error. Distributed tracing enables you to see how traces propagate through your service infrastructure and easily detect bottleneck services.
We are always open to feedback. Give our new features a try and let us know what you think. You can provide input with our Go agent survey or Java agent survey, or find us on our discussion forum. We are also always open for community engagement, so feel free to check out the source code over at GitHub and to open a ticket or pull request.