가상 모니터링
GitOps와 통합된 가상 모니터링을 통해 사용자 여정을 사전 예방적으로 모니터링
글로벌 테스팅 인프라에서 중요한 사용자 여정을 모니터링하고 웹 및 프런트 엔드 성능이 사용자 경험에 미치는 영향을 알아보세요. 개발에서 프로덕션에 이르기까지 웹사이트 성능, 기능 및 가용성에 대한 완벽한 전체 가시성을 확보하고 고객보다 먼저 문제를 파악하세요.
사용자 여정을 테스트하여
뛰어난 고객 경험 제공
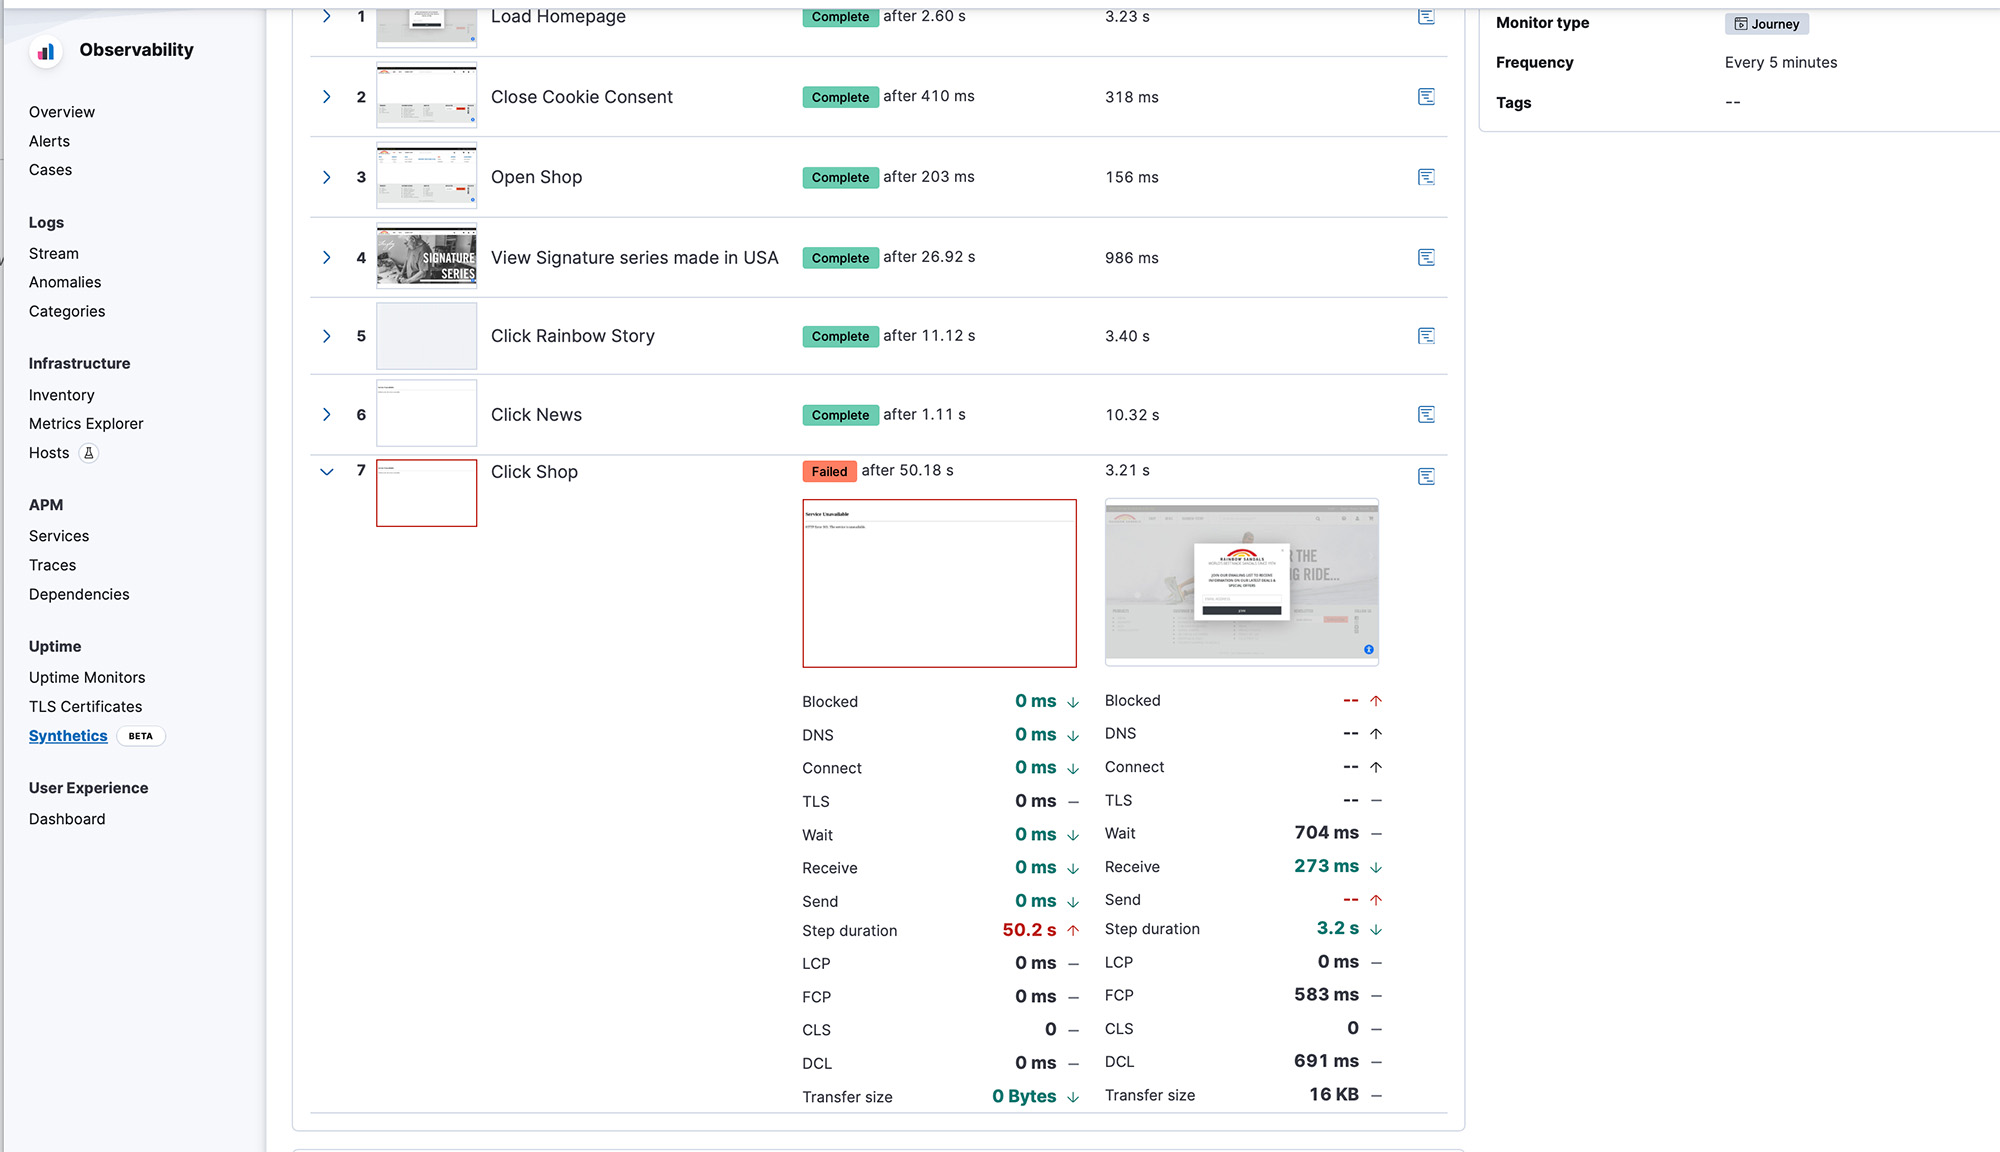
프런트 엔드 가상 모니터링은 사용자의 눈을 통해 애플리케이션의 중요한 흐름에 대한 탁월한 관점을 제공하는 APM 및 인프라 Observability에 필수적인 보완 기능입니다. 포인트 앤 클릭 스크립트 레코더로 테스트 스크립트를 만들고, 전자 상거래 스토어의 결제 흐름이나 내부 거래 애플리케이션의 트랜잭션 흐름과 같은 다단계 여정에 걸쳐 사용자 경험을 시뮬레이션하세요. 여정 중에 발생한 상태 정보와 오류에 대해 상세히 캡처하고 폭포형 뷰를 사용해 문제가 있는 영역을 식별 및 수정하고 탁월한 디지털 환경을 제공하세요.
SRE 경험 향상
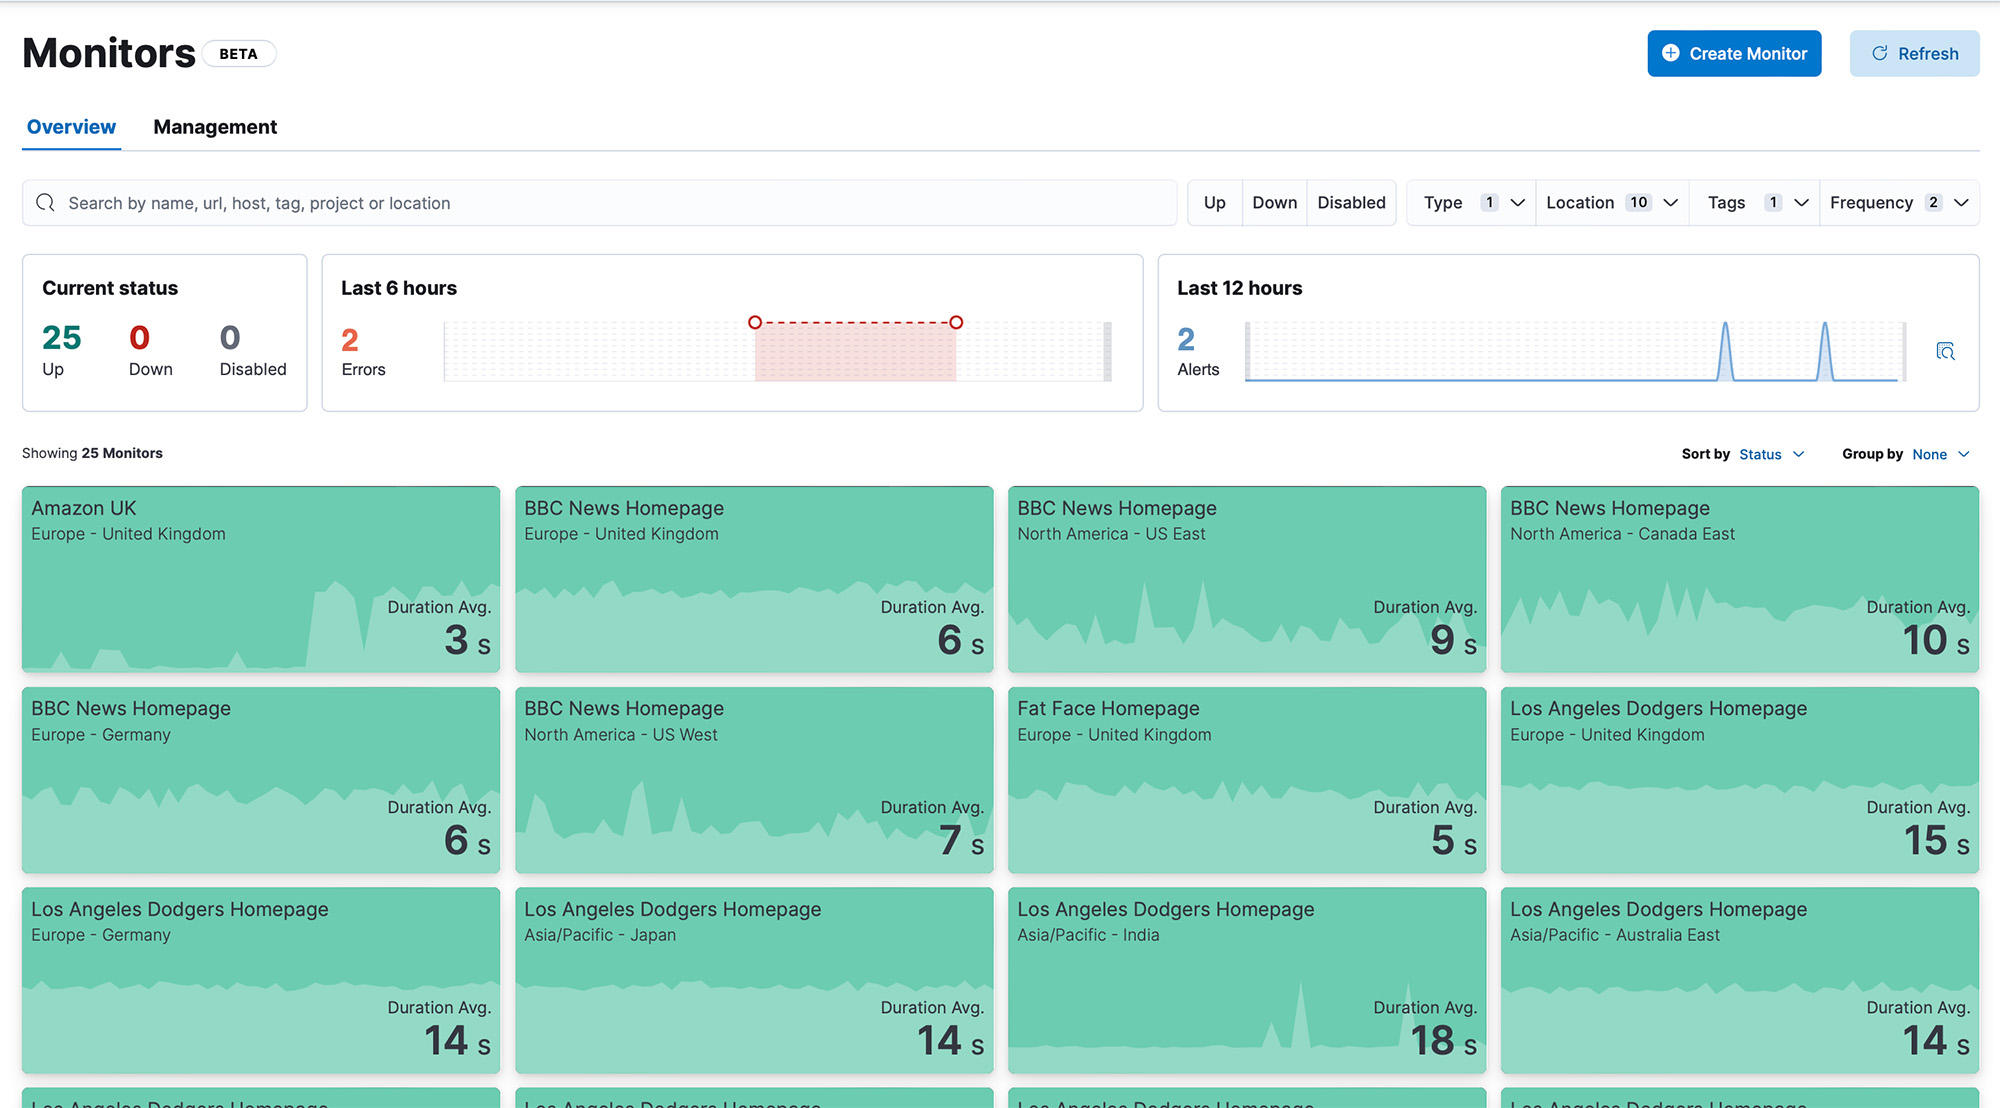
SRE에 맞게 특별히 조정된 엔드 투 엔드 워크플로우의 이점을 누리세요. 전용 오류 상세 페이지, 성능 추세 분석 및 중요한 정보를 한눈에 볼 수 있는 맞춤형 차트 등이 있습니다. 마지막으로 성공한 테스트 실행과 실패한 테스트 실행을 비교하여 문제를 손쉽게 분류하고 진단하세요. 서드파티 종속성에 대한 필수적인 가시성을 확보하여 성능을 최적화하세요. 사전 예방적인 경보를 활용하고 사고 관리 도구와 원활하게 통합하여 탁월한 사용자 경험을 제공하세요.
GitOps를 사용하여 개발에서 운영까지 테스팅 프로세스 간소화
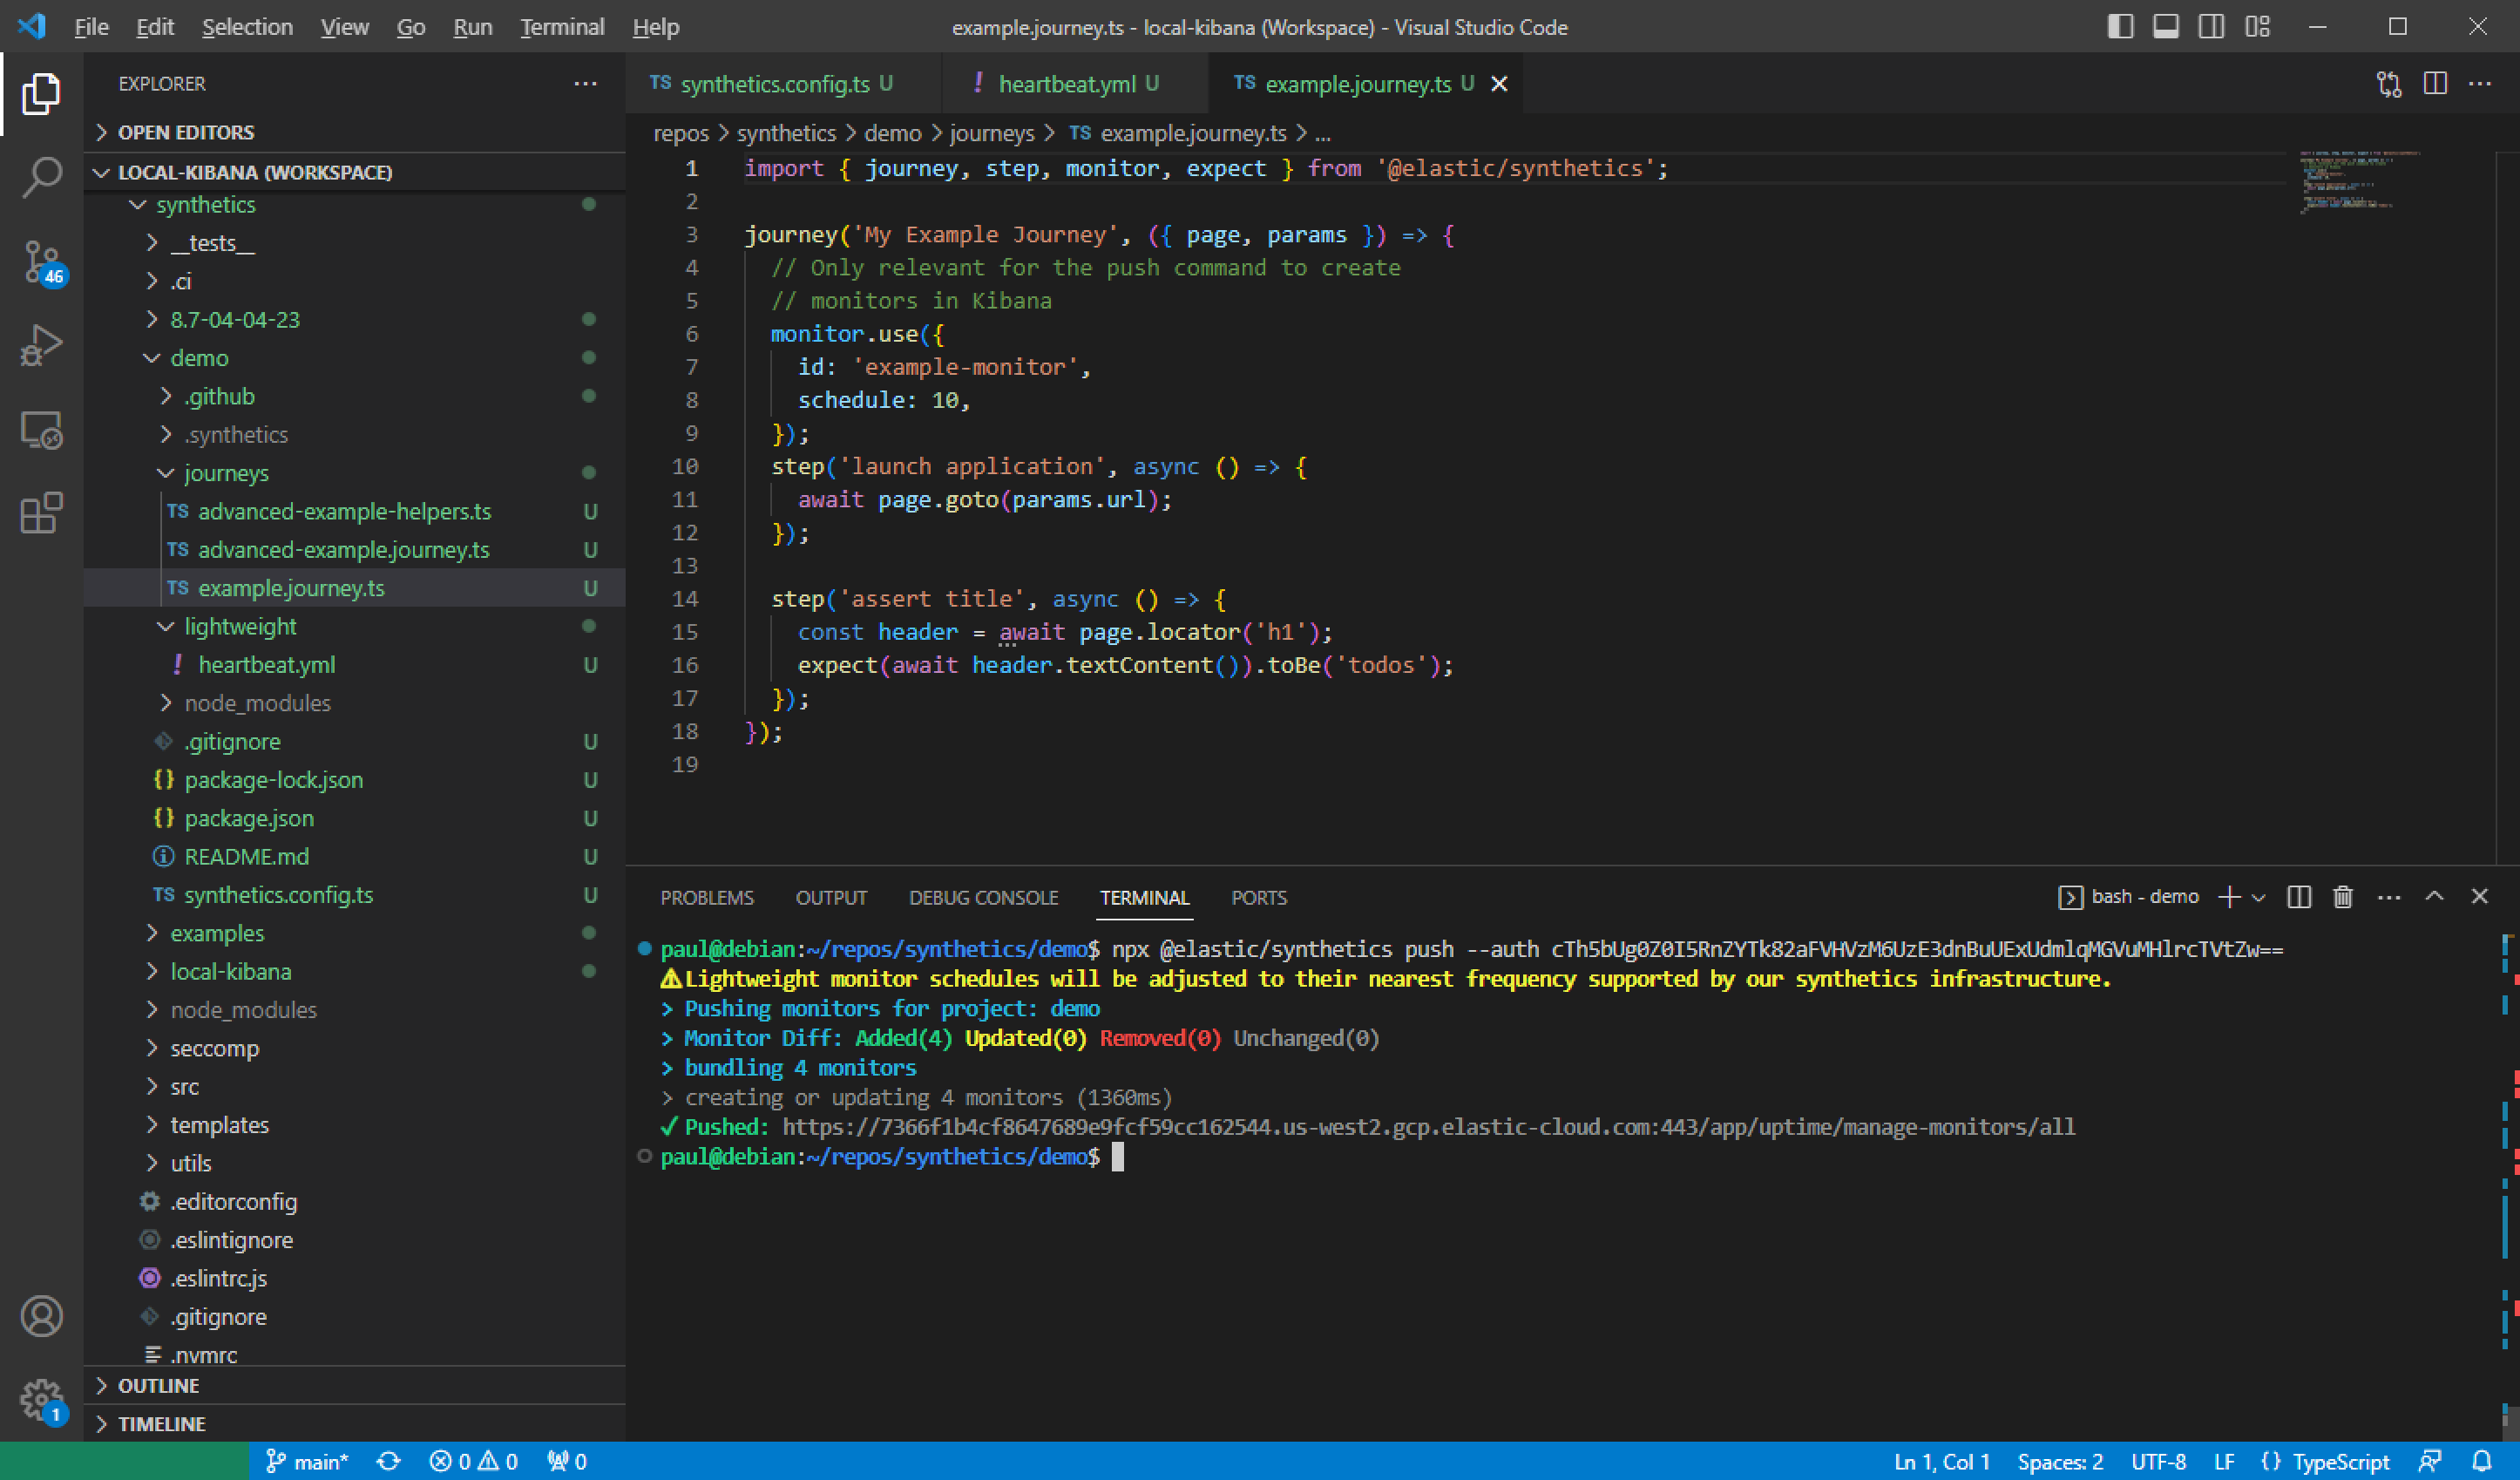
업계 최초의 가상 모니터링을 경험하고 모니터를 코드로 관리하세요. 사전 프로덕션에서 테스트를 작성하고 확인한 다음, 프로덕션에서 테스팅을 계속하려면 코드로 테스트 스크립트를 손쉽게 푸시하세요. 기본 제공되는 GitOps 관리 기능을 통해, 코드 릴리즈와 테스트 업데이트 간의 지연 시간을 없애고, 테스트 스크립트를 재사용하여 작업을 줄이고, 모니터 및 스크립트 관리를 간소화할 수 있습니다.
유지 관리가 필요 없는 가상 모니터링
하드웨어 관리, 용량 계획, 확장, 업데이트, 패치 적용 등의 작업이 더 이상 필요 없습니다. Elastic 관리형 글로벌 테스팅 인프라의 편리함을 누리시고, 가벼운 브라우저 테스트와 전체 브라우저 테스트를 손쉽게 수행하세요. 자동 확장, 기본 제공 보안 및 Elastic Observability와의 원활한 통합 등과 같은 추가 기능의 이점을 활용하세요. 테스팅 에이전트를 온프레미스에 배포해야 하는 사용 사례에 대해서도 개인 테스팅 위치를 사용할 수 있습니다.
가상 모니터링은 애플리케이션을 관찰하는 한 가지 방법일 뿐입니다
애플리케이션, 인프라 및 사용자를 모두 Elastic Observability라는 단일 솔루션에서 모니터링하세요.