Indexing Elasticsearch Audit Logs with Filebeat
When security features are enabled in Elasticsearch, it is possible to enable an audit log as well. This log contains events that occur in the Elasticsearch node that might be interesting from a security perspective. To analyze these events easily, they can be indexed back into Elasticsearch, preferably into a separate cluster from the one that's generating the events. This blog post explains how this indexing feature has changed in recent times.
Until version 6.7.0 of Elasticsearch, the recommended way of indexing audit logs back into Elasticsearch for easy analysis was to use the index output type when configuring the audit log settings. This output type was deprecated in version 6.7.0. In the same version, we introduced the audit fileset of the elasticsearch module in Filebeat, which performs the same role as the index output type of the Elasticsearch audit log.
In version 7.0.0 of Elasticsearch, we removed the index output of the Elasticsearch audit log completely. Configuring Filebeat is henceforth the only alternative for easy analysis of the audit log.
Why has the index output type been retired?
Although using the index output type was convenient from a configuration standpoint, there are strong technical reasons why this option is not suitable in production environments and so it has been retired. The main drawback is that the audit event throughput is related to the node’s request load. Nodes with higher traffic generate more audit events. The indexing throughput, however, is limited by the destination cluster’s capacity. If the destination cluster can’t keep up with the volume, then we eventually need to drop some of the audit events or selectively drop client requests. Moreover, the queueing buffer for audit events was in-memory with no disk persistence, because disk persistence was assured by the other dedicated logging output type logfile. All this can lead to audit data loss in a multitude of complex failure scenarios.
In short, this functionality was hard to maintain and provided little gains. Instead, by “outsourcing” the indexing task to Filebeat, Elasticsearch’s audit trail only has to focus on one task: storing events on the persistent storage and with no queueing. The audit capacity eats at a resource (disk I/O) that the administrators already have to plan for. Filebeat, being a separate process that runs alongside the Elasticsearch node, can take the indexing load off the Elasticsearch node's shoulders. And since Filebeat works off the audit log files generated by the Elasticsearch node, these files act as a natural queue. If the Elasticsearch cluster receiving the audit log documents for indexing is under load, Filebeat will wait until the load lessens and then continue indexing from the last entry it ingested from the audit log file.
Finally, using Filebeat provides you with additional options that weren’t available with the old index output, such as event filter (see examples below) or sending events to Logstash for enrichment or to Kafka for queueing before further routing.
Using Filebeat to ingest Elasticsearch audit logs
Let's see what steps are involved in using Filebeat to ingest Elasticsearch audit logs into an Elasticsearch cluster.
On every node in your Elasticsearch cluster, do the following:
- Enable the audit log for that node by setting
xpack.security.audit.enabled: trueinside theelasticsearch.ymlconfig file. See Auditing Security Events for more details. - Start the Elasticsearch node.
- Install Filebeat alongside the Elasticsearch node. This could mean installing Filebeat on the same host or VM as the Elasticsearch node or in a sidecar container.
- Filebeat ships with a variety of modules, each catering to a well-known source of log files. In this case, we want to use the Elasticsearch module, so enable it.
- Once the Elasticsearch Filebeat module is enabled, it will look in well-known paths for Elasticsearch log files and it will naturally follow them as they are rotated. If you want to customize these paths, edit the
elasticsearch.ymlfile under themodules.dfolder and make the necessary configuration changes. Themodules.dfolder is located in the same folder that containsfilebeat.yml, which is the main Filebeat configuration file. - To specify which Elasticsearch cluster you want to index your audit log events into, as well as other settings related to the Elasticsearch output (e.g., authentication settings), edit the
output.elasticsearchsection infilebeat.yml. - Finally, start Filebeat. Your Elasticsearch audit logs will be indexed into
filebeat-*indices (by default) on the Elasticsearch cluster you configured in the previous step.
Common considerations
Indexing a subset of audit log events
By default every event that appears in the audit log file will be picked up by Filebeat and indexed into Elasticsearch. However, you may want to index only certain audit log events. This can be achieved by using Filebeat's drop_event processor with the appropriate conditions.
For instance, you may want to only index audit log events involving the elastic user. To achieve this, edit the modules.d/elasticsearch.yml file and under the audit fileset section, add the following:
input:
  processors:
    - decode_json_fields:
        fields: [ "message" ]
        target: temp
    - drop_event:
        when:
          not:
            contains:
              temp.user.name: elastic
    - drop_fields:
        fields: [ "temp" ]
You can view the list of available audit event fields in the documentation.
Indexing audit log events in multiple Elasticsearch clusters
A single Filebeat instance can only send events to a single Elasticsearch cluster. This means that if you would like to send your audit log events to multiple Elasticsearch clusters that you have a couple of options:
- Run multiple Filebeat instances. Configure the
output.elasticsearchsection, particularly thehostssetting, of each instance to send to a different Elasticsearch cluster.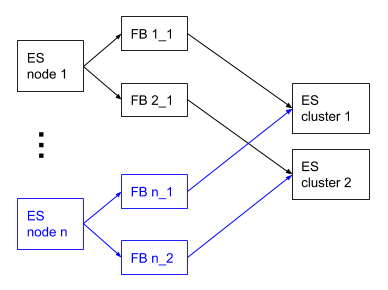
- Run a single Filebeat instance and send your audit logs to Logstash by configuring the
output.logstashsection in yourfilebeat.yml. Then configure your Logstash pipeline to with multipleelasticsearchoutputs to send to multiple Elasticsearch clusters.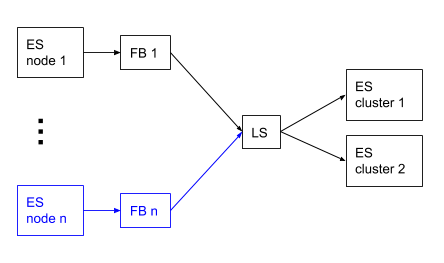
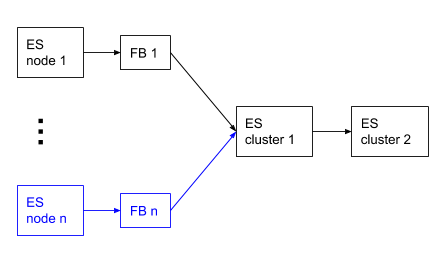
- Run a single Filebeat instance and send your audit logs to one Elasticsearch cluster. Then use cross-cluster replication to replicate the audit logs index over to another Elasticsearch cluster.
Analyzing audit logs in Elasticsearch
Once your audit logs have been indexed into filebeat-* indices, you can start running queries against them and creating visualizations in Kibana.
For instance, here's a sample query to count the different types of Elasticsearch transport-level actions that were performed every hour:
POST filebeat-*/_search
{
  "size": 0,
  "query": {
    "bool": {
      "filter": {
        "term": {
          "event.dataset": "elasticsearch.audit"
        }
      }
    }
  },
  "aggs": {
    "by_hour": {
      "date_histogram": {
        "field": "@timestamp",
        "interval": "1h"
      },
      "aggs": {
        "by_event_type": {
          "terms": {
            "field": "elasticsearch.audit.action"
          }
        }
      }
    }
  }
}
But wait, there's more!
Not only can Filebeat ingest Elasticsearch audit logs but it can also ingest other types of Elasticsearch logs — the main server log, GC log, slow log and deprecation log. Think of all the amazing correlation and other analysis you could do in Kibana about the all the events happening in your Elasticsearch cluster!
And if you're looking for an Elasticsearch cluster to send your audit — and other — logs to try taking our Elasticsearch Service for a 14-day free trial!
As always, questions are welcome (and encouraged) on our Discuss forums.