WARNING: Version 6.2 of the Elastic Stack has passed its EOL date.
This documentation is no longer being maintained and may be removed. If you are running this version, we strongly advise you to upgrade. For the latest information, see the current release documentation.
Creating Forecasts
editCreating Forecasts
editIn addition to detecting anomalous behavior in your data, you can use machine learning to predict future behavior. For more information, see Forecasting the Future.
To create a forecast in Kibana:
-
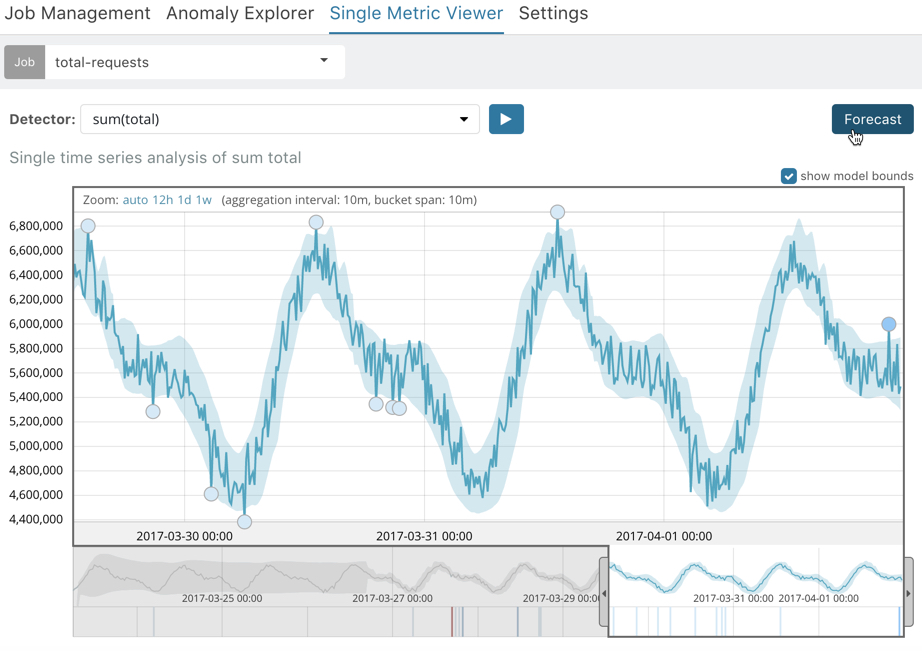
Go to the Single Metric Viewer and select one of the jobs that you created
in this tutorial. For example, select the
total-requestsjob. -
Click Forecast.
-
Specify a duration for your forecast. This value indicates how far to extrapolate beyond the last record that was processed. You must use time units, such as
30dfor 30 days. For more information, see Time Units. In this example, we use a duration of 1 week: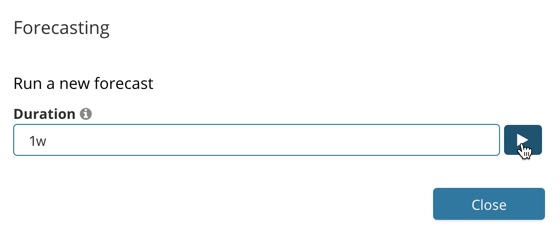
-
View the forecast in the Single Metric Viewer:
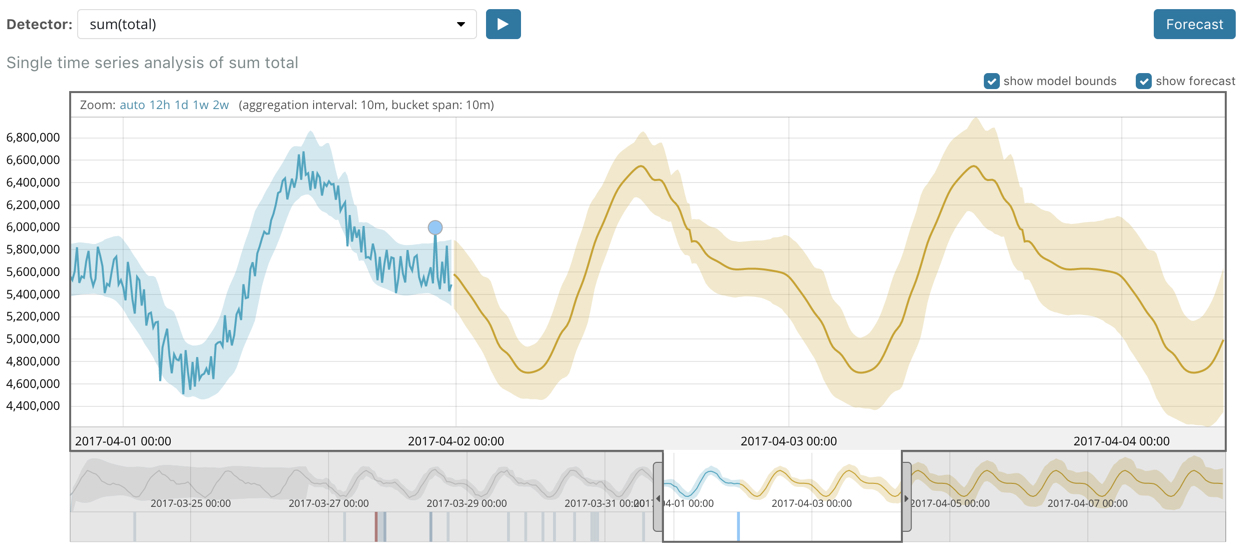
The yellow line in the chart represents the predicted data values. The shaded yellow area represents the bounds for the predicted values, which also gives an indication of the confidence of the predictions. Note that the bounds generally increase with time (that is to say, the confidence levels decrease), since you are forecasting further into the future. Eventually if the confidence levels are too low, the forecast stops.
-
Optional: Compare the forecast to actual data.
You can try this with the sample data by choosing a subset of the data when you create the job, as described in Creating Single Metric Jobs. Create the forecast then process the remaining data, as described in Managing Datafeeds.
-
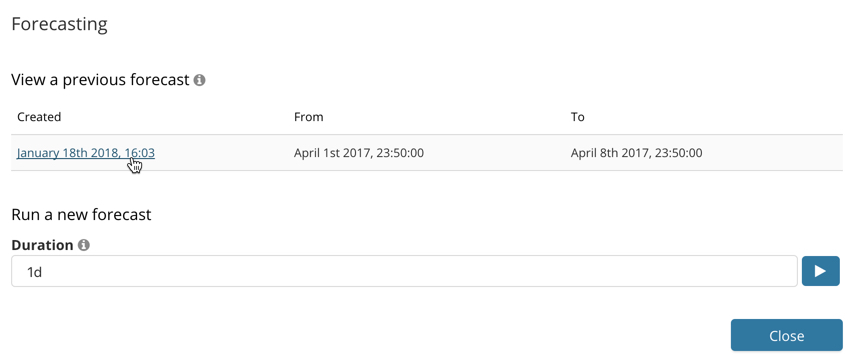
After you restart the datafeed, re-open the forecast by selecting the job in the Single Metric Viewer, clicking Forecast, and selecting your forecast from the list. For example:
-
View the forecast and actual data in the Single Metric Viewer:
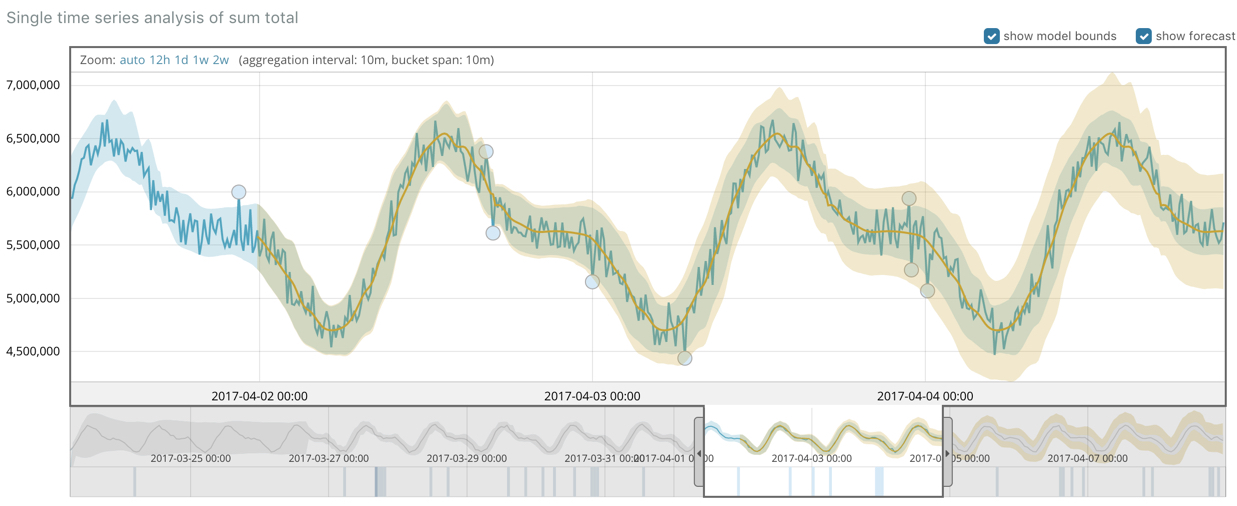
The chart contains the actual data values, the bounds for the expected values, the anomalies, the forecast data values, and the bounds for the forecast. This combination of actual and forecast data gives you an indication of how well the X-Pack machine learning features can extrapolate the future behavior of the data.
-
Now that you have seen how easy it is to create forecasts with the sample data, consider what type of events you might want to predict in your own data. For more information and ideas, as well as a list of limitations related to forecasts, see Forecasting the Future.