WARNING: Version 5.5 of the Elastic Stack has passed its EOL date.
This documentation is no longer being maintained and may be removed. If you are running this version, we strongly advise you to upgrade. For the latest information, see the current release documentation.
Viewing Monitoring Metrics
editViewing Monitoring Metrics
editThe Clusters page summarizes the status of your Elastic stack. You can drill down into the metrics to view more information about your cluster and specific nodes, instances, and indices.
Cluster Alerts
editThe Top Cluster Alerts shown on the Clusters page notify you of conditions that require your attention:
- Elasticsearch Cluster Health Status is Yellow (missing at least one replica) or Red (missing at least one primary).
- Elasticsearch Version Mismatch. You have Elasticsearch nodes with different versions in the same cluster.
- Kibana Version Mismatch. You have Kibana instances with different versions running against the same Elasticsearch cluster.
-
Logstash Version Mismatch. You have Logstash nodes with different versions reporting stats to the same monitoring cluster.
If you do not preserve the data directory when upgrading a Kibana or Logstash node, the instance is assigned a new persistent UUID and shows up as a new instance
- Logstash Version Mismatch. You have Logstash nodes with different versions running against the same Elasticsearch cluster.
Monitoring checks the cluster alert conditions every minute. Cluster alerts are automatically dismissed when the condition is resolved.
Watcher must be enabled to view cluster alerts. If you have a Basic license, Top Cluster Alerts are not displayed.
Elasticsearch Metrics
editYou can drill down into the status of your Elasticsearch cluster by clicking the Overview, Nodes, and Indices links.
Cluster Overview
editTo view the key metrics that indicate the overall health of an Elasticsearch cluster, click Overview in the Elasticsearch section. Anything that needs your attention is highlighted in yellow or red.
Conditions that require your attention are listed at the top of the Clusters page. You can also set up watches to alert you when the status of your cluster changes. To learn how, see Watch Your Cluster Health.
The panel at the top shows the current cluster statistics, the charts show the search and indexing performance over time, and the table at the bottom shows information about any shards that are being recovered.
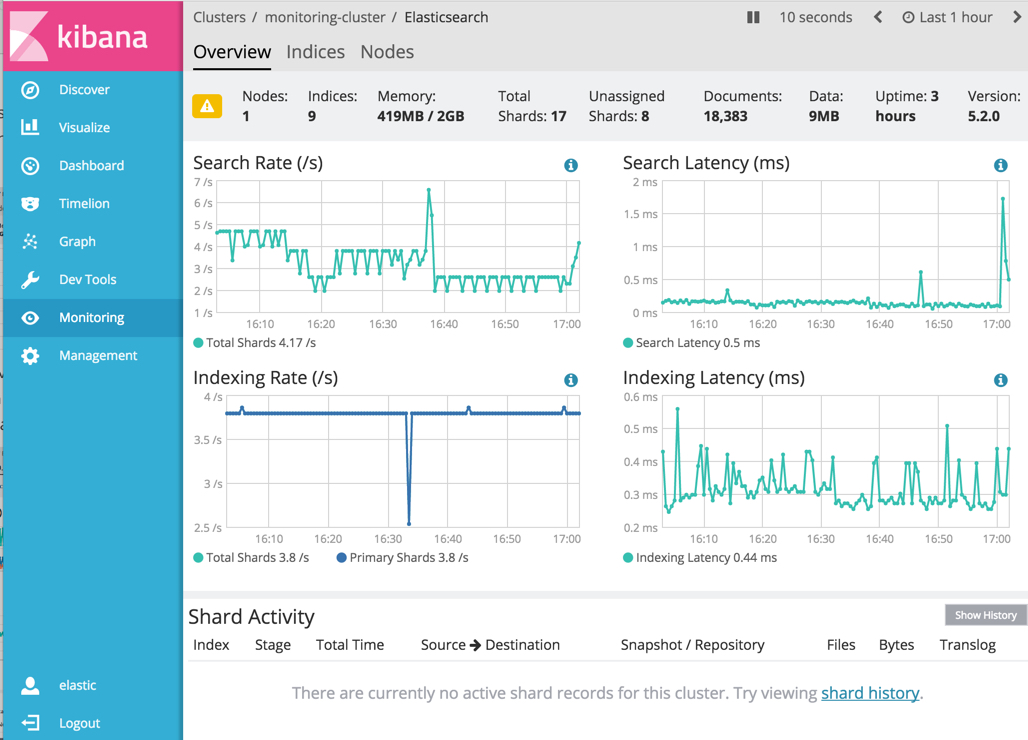
Not sure what a chart is showing? Click the info button for a description of the metrics.
From there, you can dive into detailed metrics for particular nodes and indices.
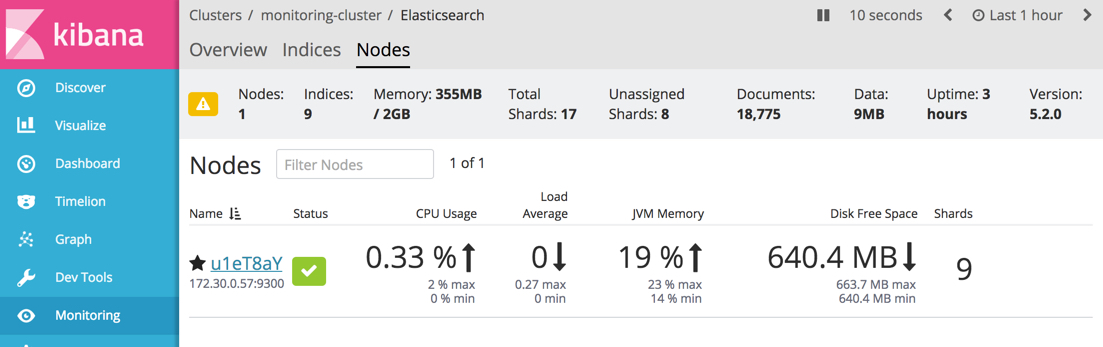
Nodes
editTo view node metrics, click Nodes. The Nodes section shows the status of each node in your cluster.
Node Overview
editClick the name of a node to view its node statistics over time. These represent high-level statistics collected from Elasticsearch that provide a good overview of health.
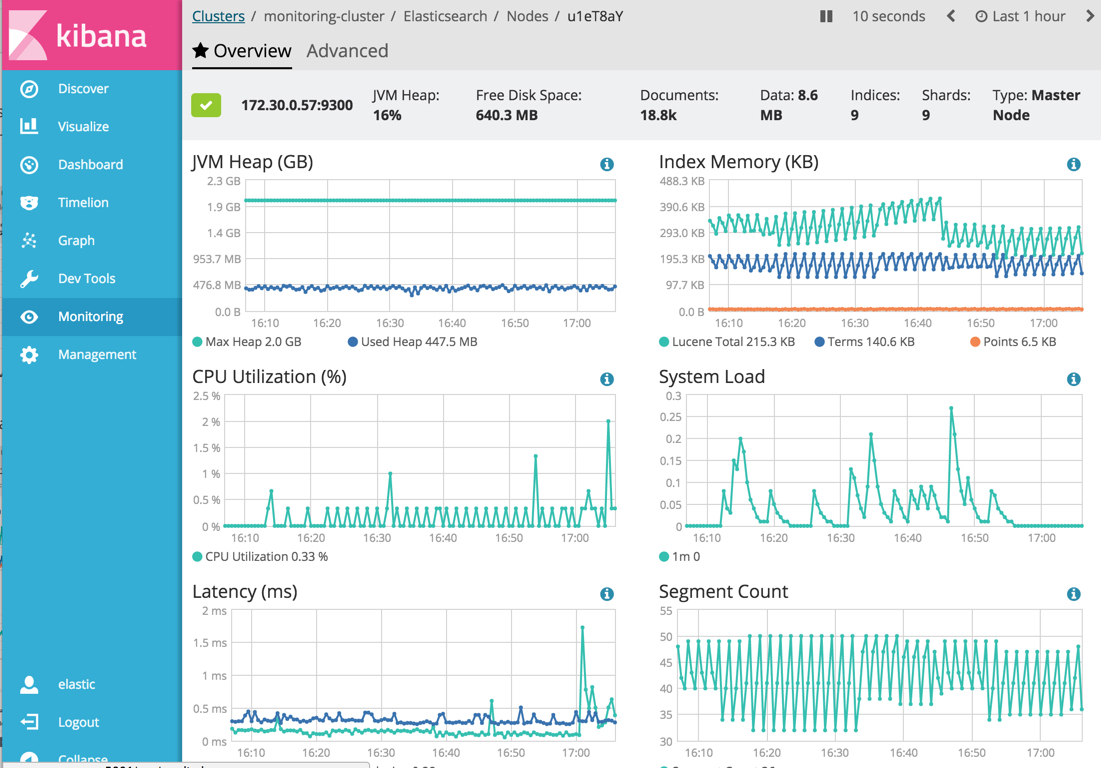
Node Advanced
editTo view advanced node metrics, click the Advanced tab for a node. The Advanced tab shows additional metrics, such as memory and garbage collection statistics reported by the selected Elasticsearch node.
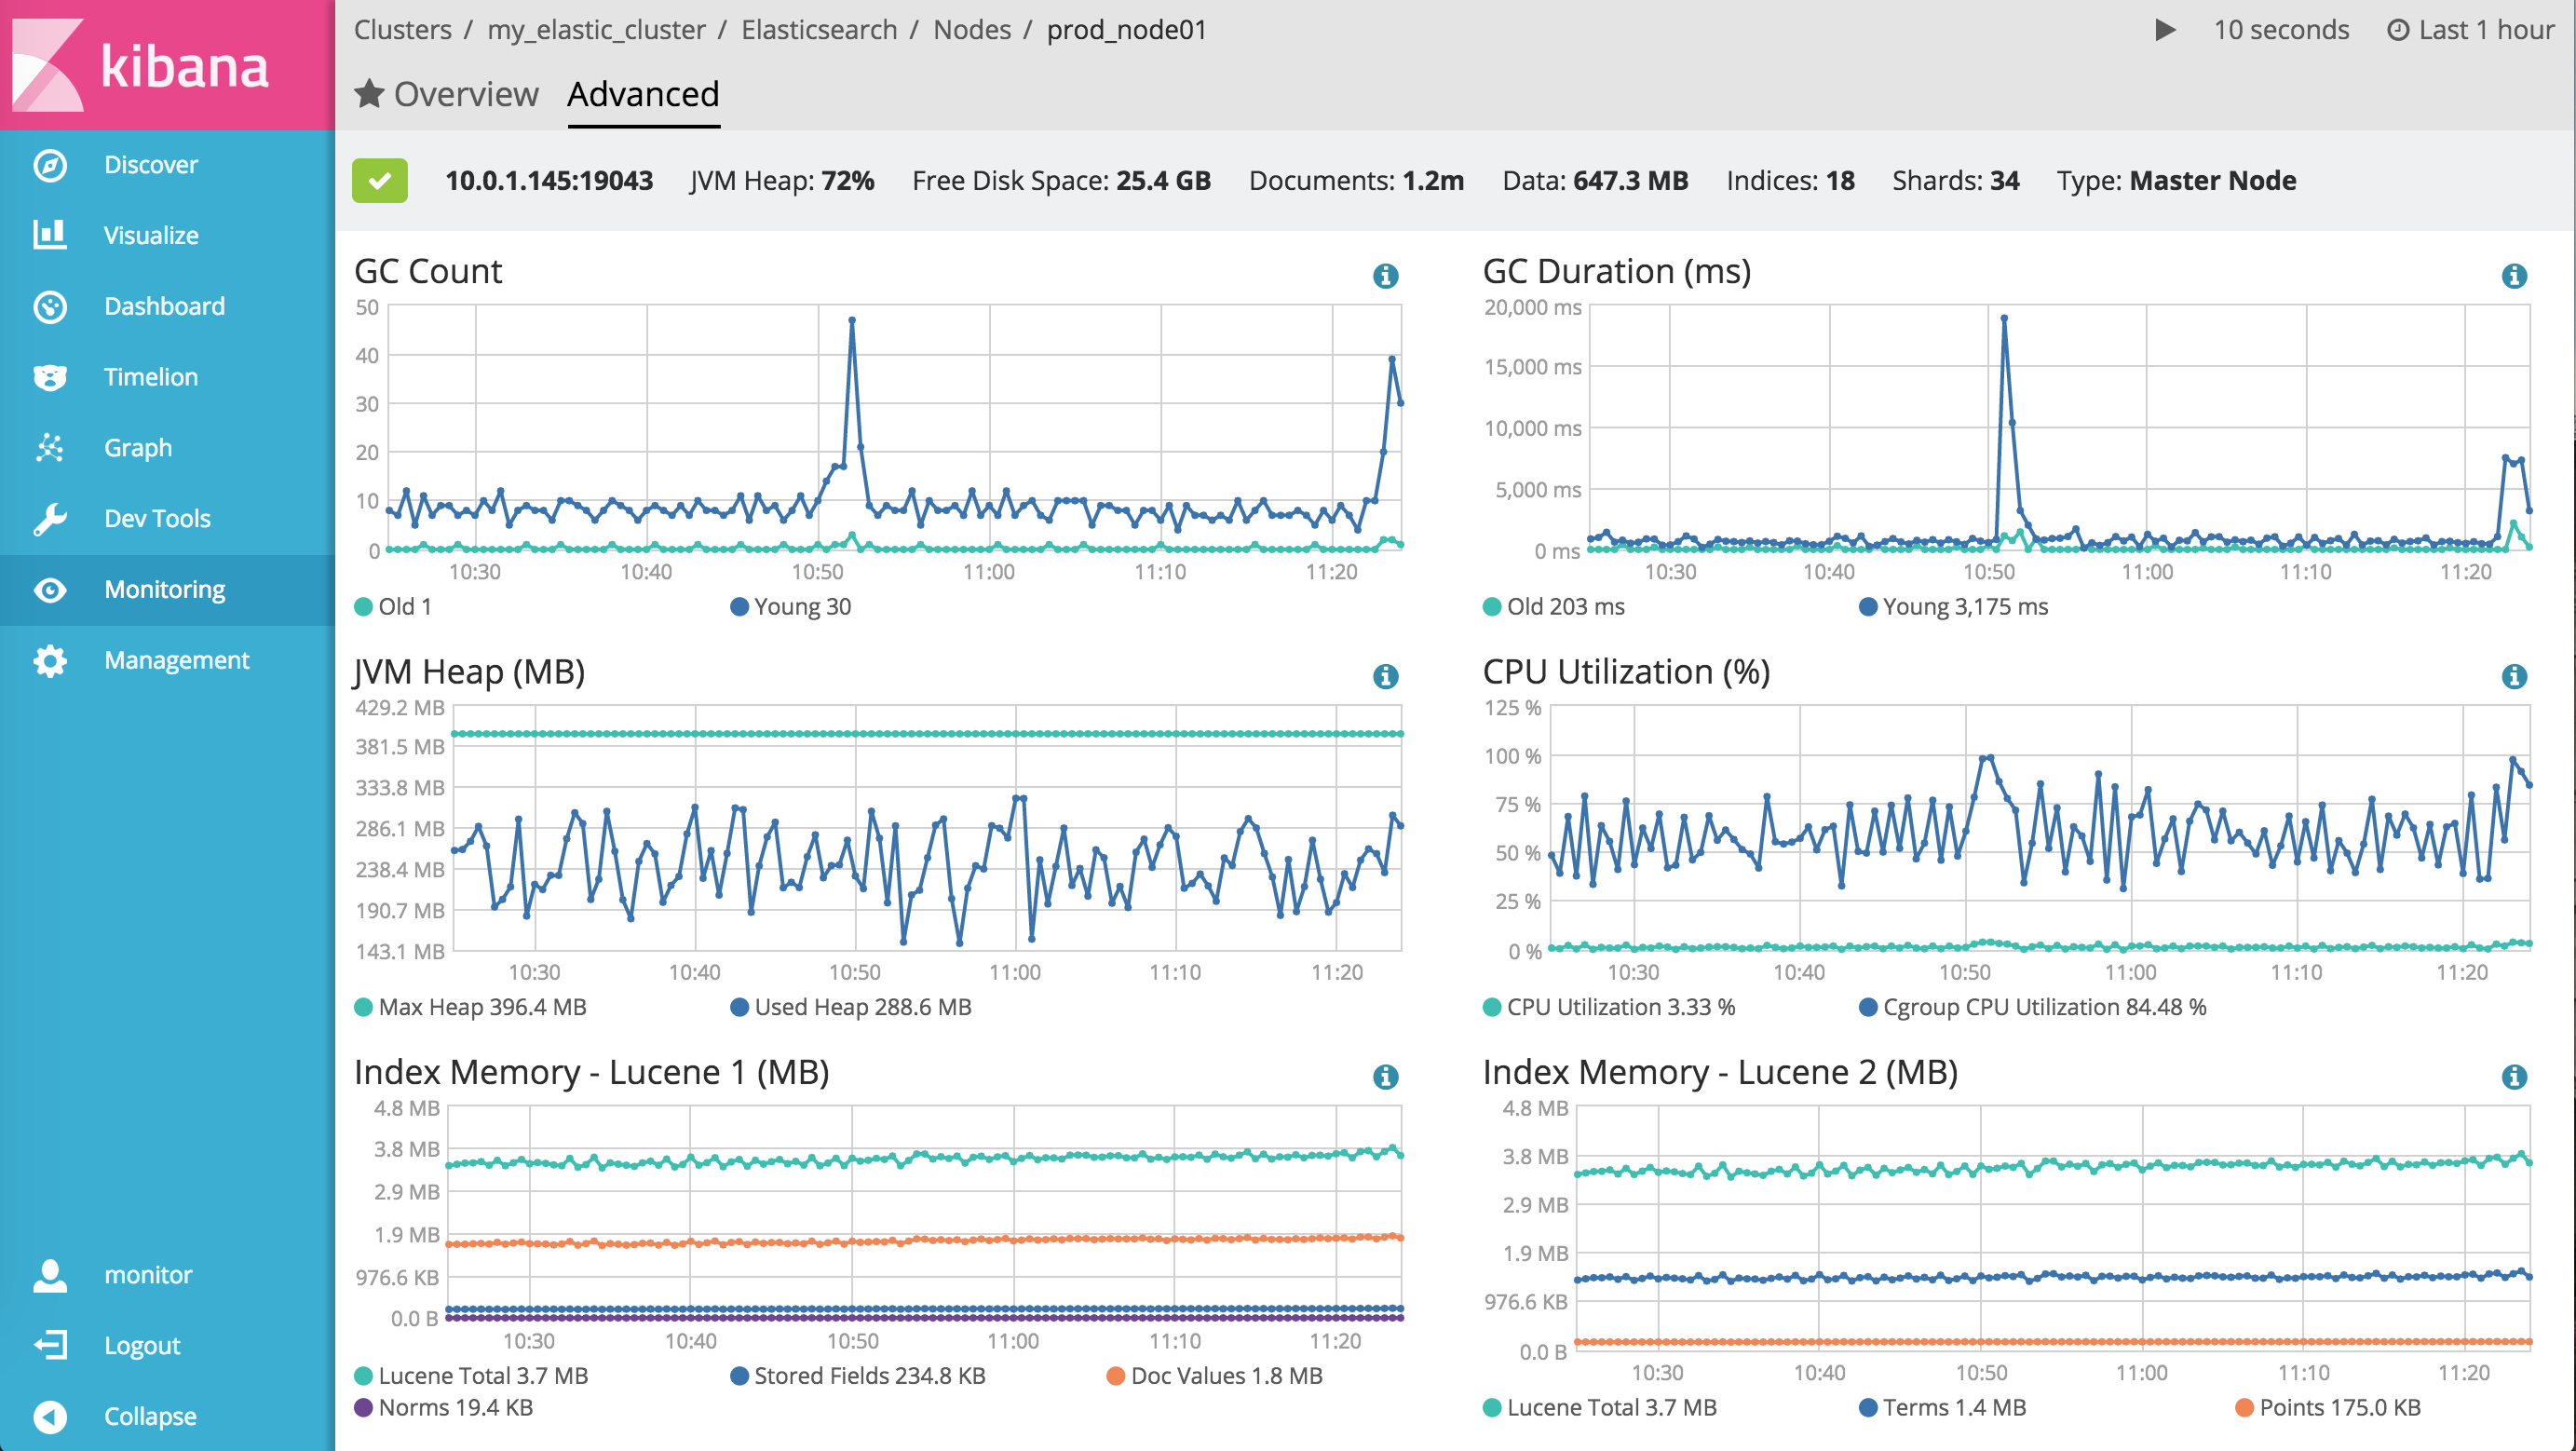
The Advanced node view can be used to diagnose issues that generally involve more advanced knowledge of Elasticsearch, such as poor garbage collection performance.
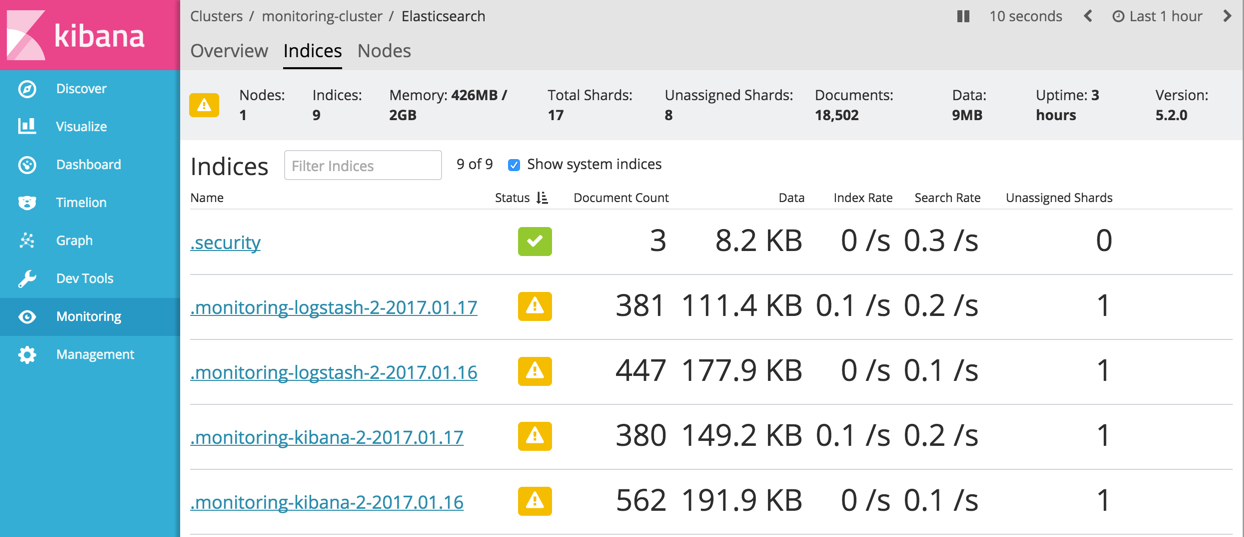
Indices
editTo view index metrics, click Indices. The Indices section shows the same overall index and search metrics as the Overview and a table of your indices.
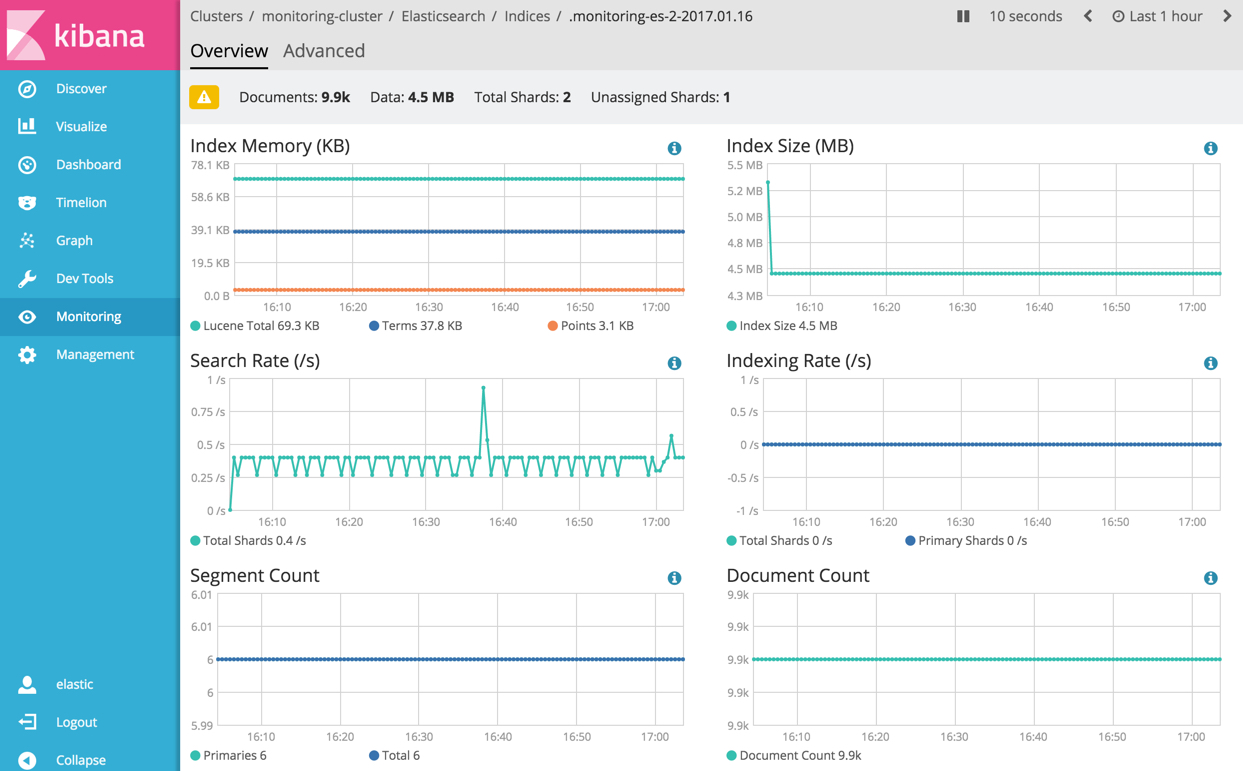
Index Overview
editFrom the Indices listing, you can view data for a particular index. To drill down into the data for a particular index, click its name in the Indices table.
Index Advanced
editTo view advanced index metrics, click the Advanced tab for an index. The Advanced tab shows additional metrics, such as memory statistics reported about the Elasticsearch index. If the index has more than one shard, then its shards may live on more than one node.
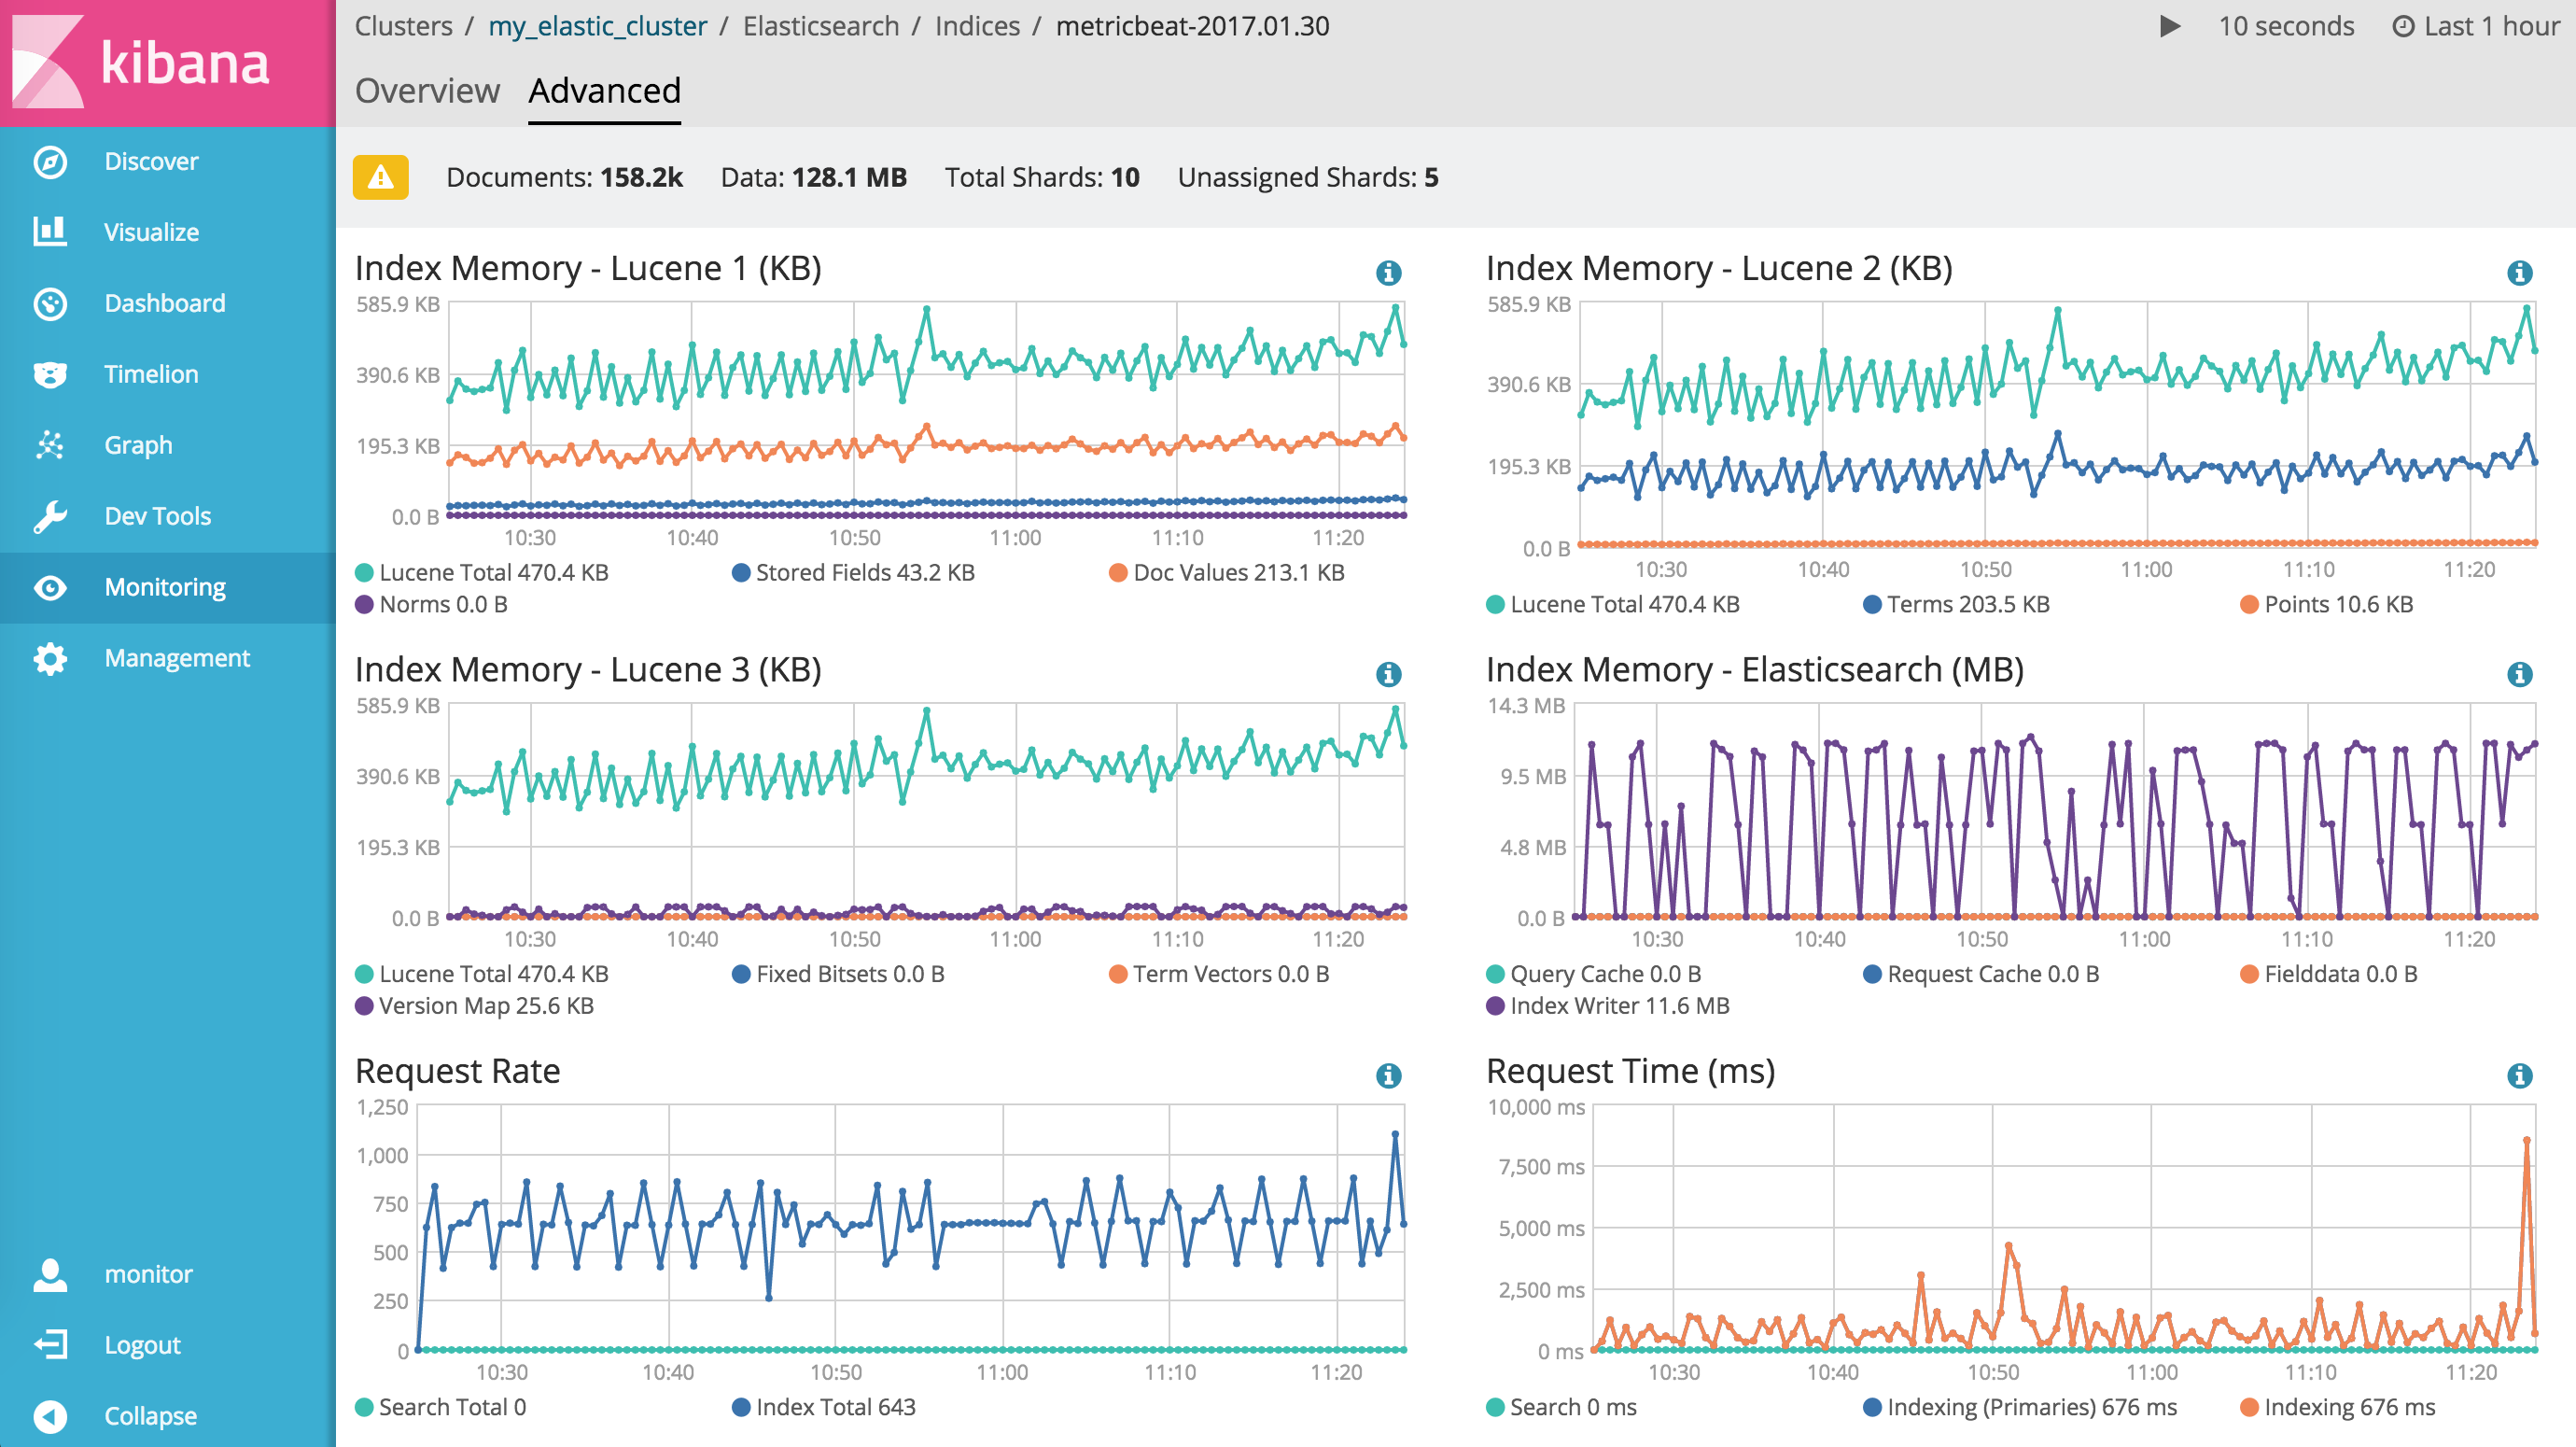
The Advanced index view can be used to diagnose issues that generally involve more advanced knowledge of Elasticsearch, such as wasteful index memory usage.
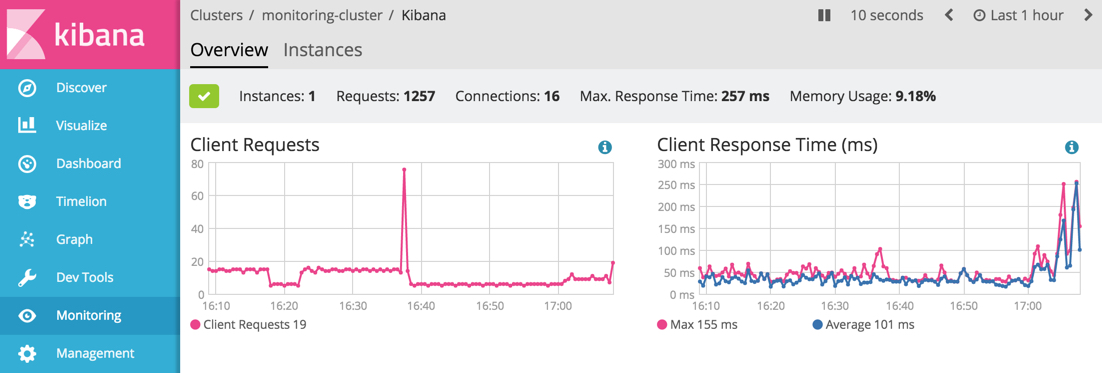
Kibana
editTo view the key metrics that indicate the overall health of Kibana itself, click Overview in the Kibana section.
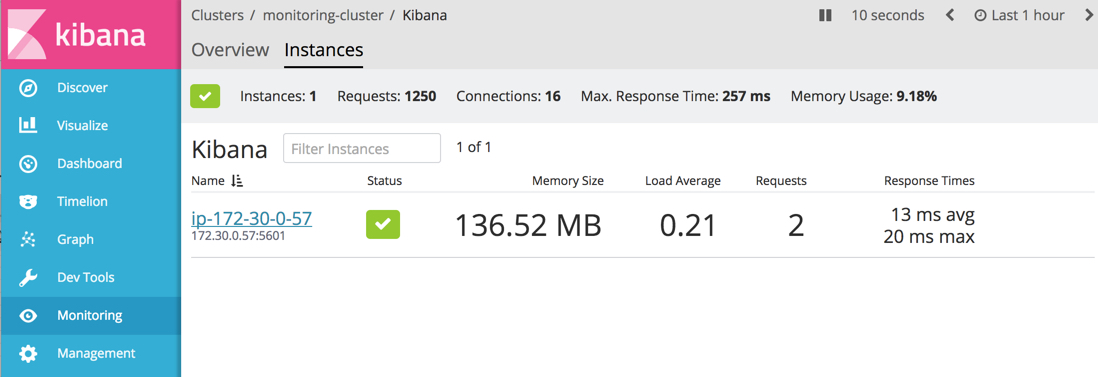
To view Kibana instance metrics, click Instances. The Instances section shows the status of each Kibana instance.
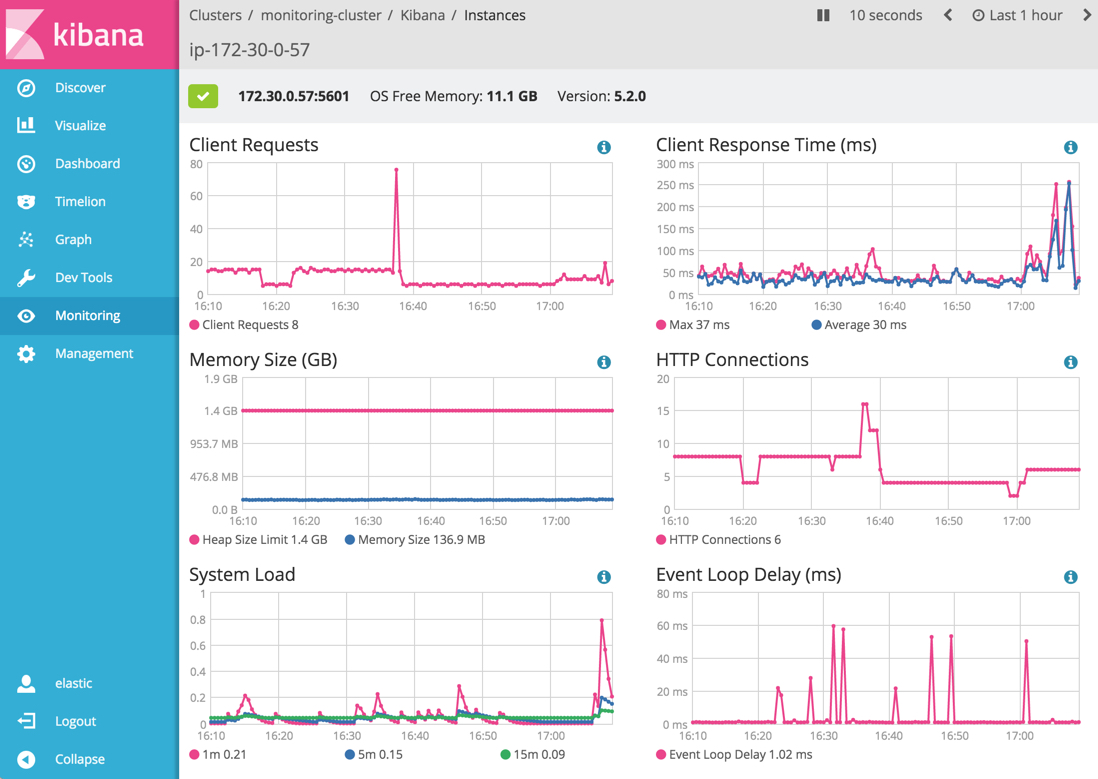
Click the name of an instance to view its instance statistics over time.
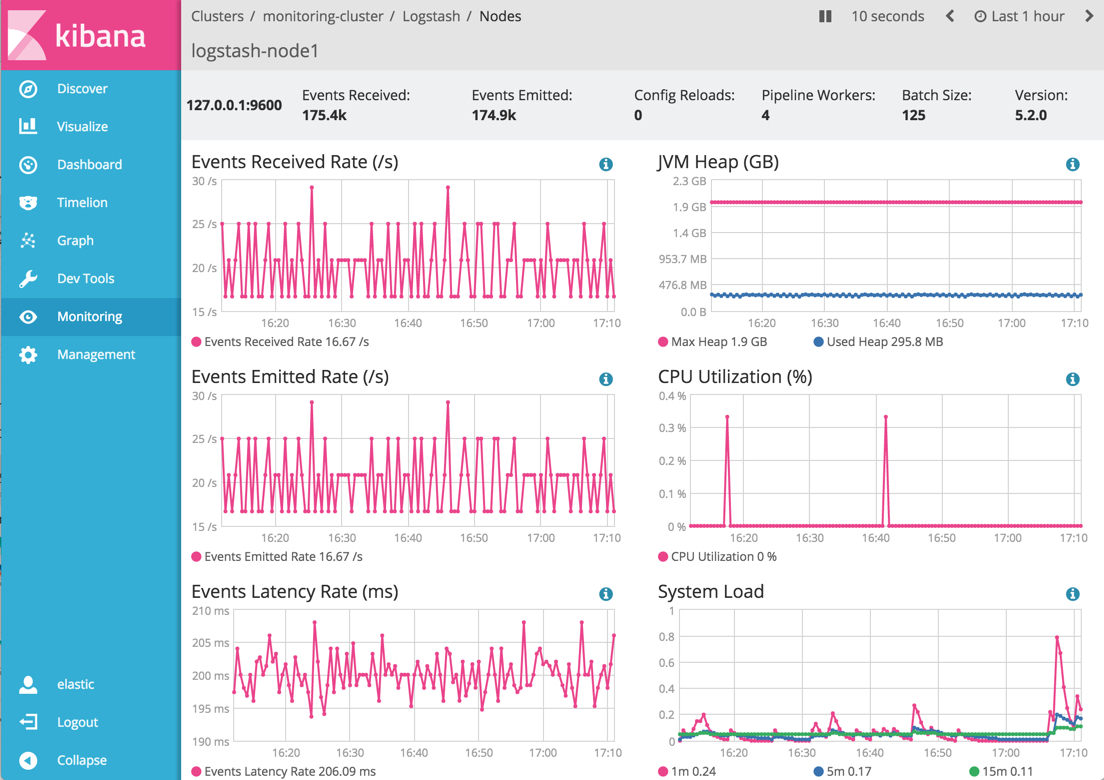
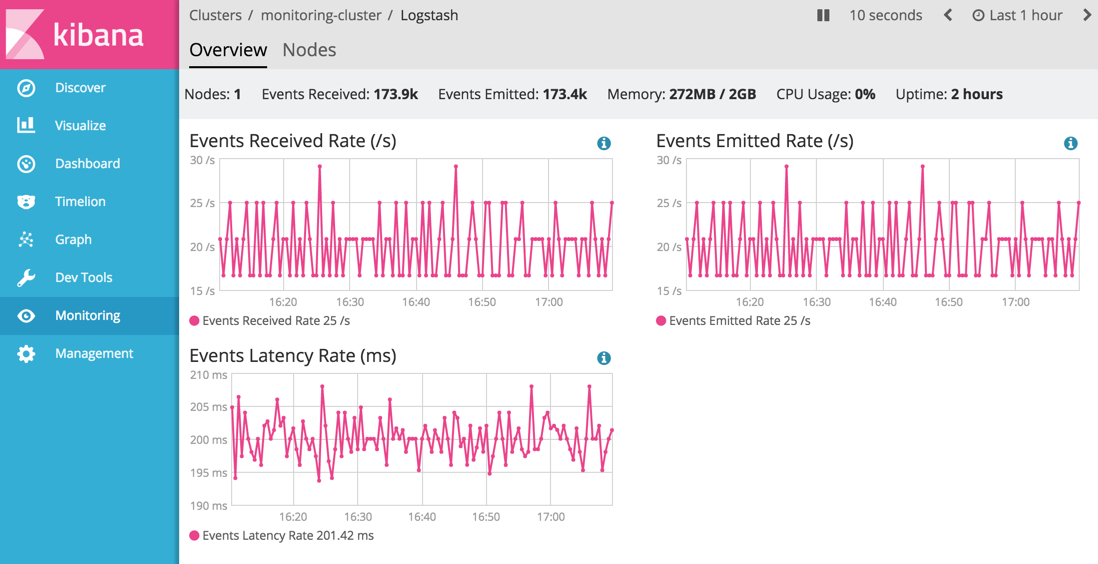
Logstash
editIf you are Monitoring Logstash nodes, click Overview in the Logstash section to view the overall health of those nodes.
To view Logstash node metrics, click Nodes. The Nodes section shows the status of each Logstash node.
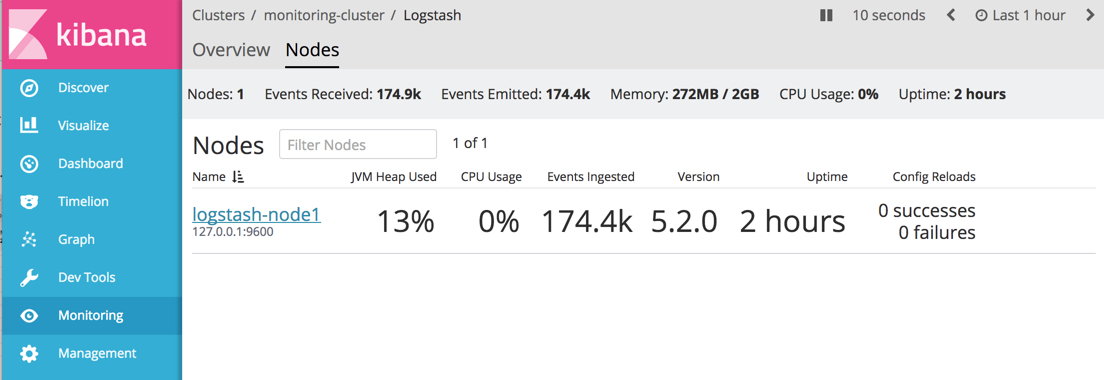
Click the name of a node to view its statistics over time.