WARNING: Version 5.5 of the Elastic Stack has passed its EOL date.
This documentation is no longer being maintained and may be removed. If you are running this version, we strongly advise you to upgrade. For the latest information, see the current release documentation.
Getting Started
editGetting Started
editMonitoring is automatically enabled when you install X-Pack into Elasticsearch, Logstash, and Kibana. By default, the monitoring agents on Elasticsearch index data within the same cluster.
If you dedicated monitoring cluster, the information is accessible even if the Elasticsearch cluster you’re monitoring is not. You can send data from multiple clusters to the same monitoring cluster and view them all through the same instance of Kibana.
To view and analyze the health and performance of Elasticsearch, Logstash, and Kibana:
-
Open Kibana in your web browser and log in. If you are running Kibana
locally, go to
http://localhost:5601/. To access Kibana and view the monitoring dashboards, you must log in as a user who has thekibana_userandmonitoring_userroles. - Click Monitoring in the side navigation. This displays any cluster alerts that require your attention and a summary of the available monitoring metrics for Elasticsearch, Logstash, and Kibana. To view additional information, click the Overview, Nodes, Indices, or Instances links.
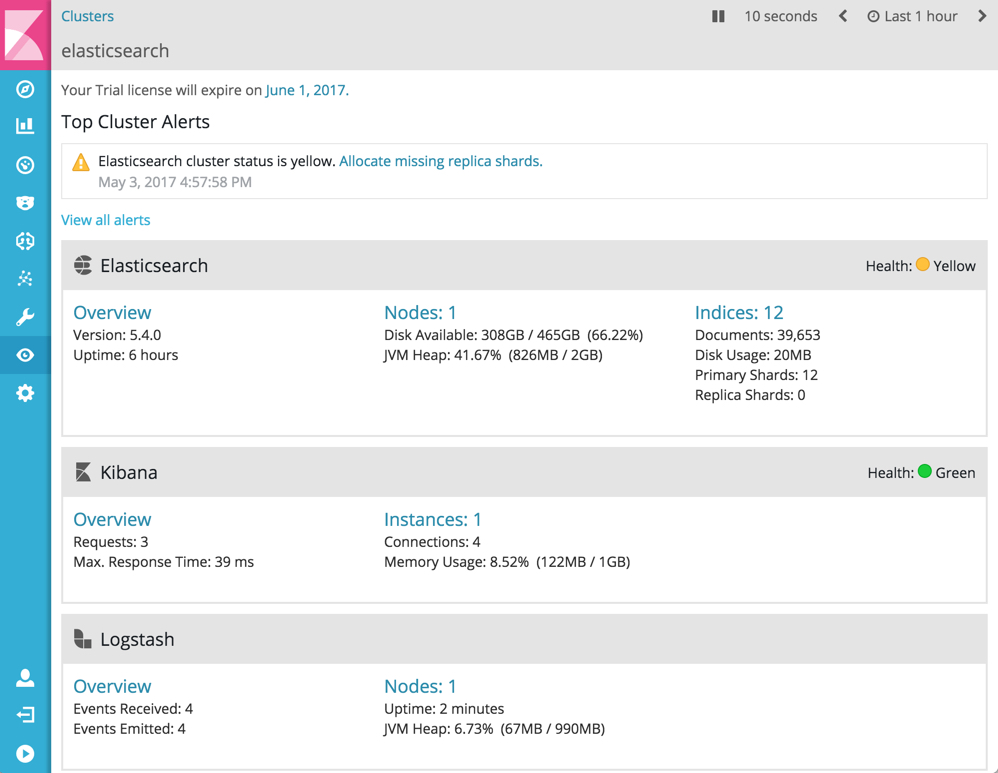
Watcher must be enabled to view cluster alerts. If you have a Basic license, Top Cluster Alerts are not displayed.