Getting started: Monitor applications and systems with Elastic Observability
editGetting started: Monitor applications and systems with Elastic Observability
editThis guide walks you through a simple monitoring scenario so you can learn the basics of creating an Elasticsearch cluster, adding data, and analyzing the results in Kibana. To get started, you can create a deployment in Elastic Cloud, where most of the configuration happens automatically. In just a few steps, you’ll learn how to retrieve metrics from your host and feed them directly into the Elastic Stack for viewing and monitoring.
In this tutorial, you’ll deploy the Elastic Stack, install an Elastic Agent on your host to collect logs and metrics, and visualize information from those collected logs and metrics.
If you prefer video tutorials, check out the
Logging Quick Start
or the
Metrics Quick Start.
Prerequisites
editTo get started, all you need is an internet connection, an email address, and a local or virtual machine from which you’d like to gather some performance data.
Step 1: Create an Elastic Cloud deployment
editIf you’ve already signed up for a trial deployment you can skip this step.
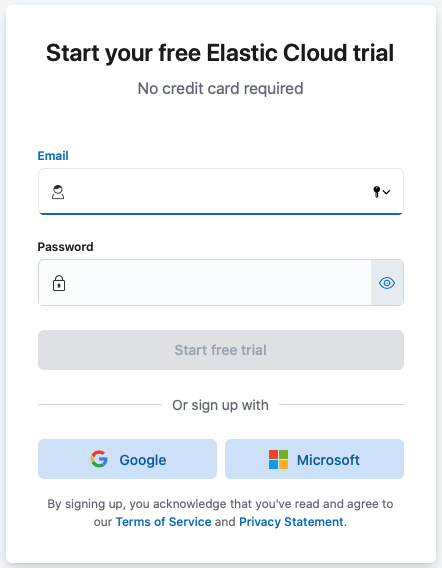
An Elastic Cloud deployment offers you all of the features of the Elastic Stack as a hosted service. To test drive your first deployment, sign up for a free Elastic Cloud trial:
- Go to our Elastic Cloud Trial page.
-
Enter your email address and a password.
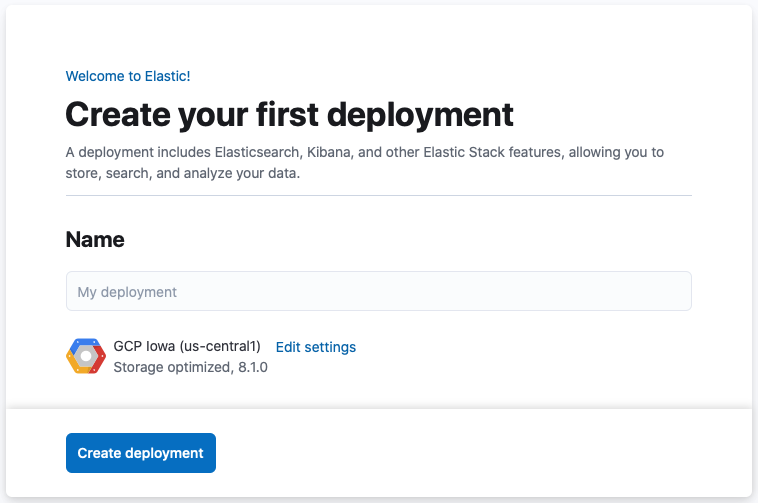
-
After you’ve logged in, you can directly create a deployment. Give your deployment a name and select Create deployment.
-
While the deployment sets up, make a note of your
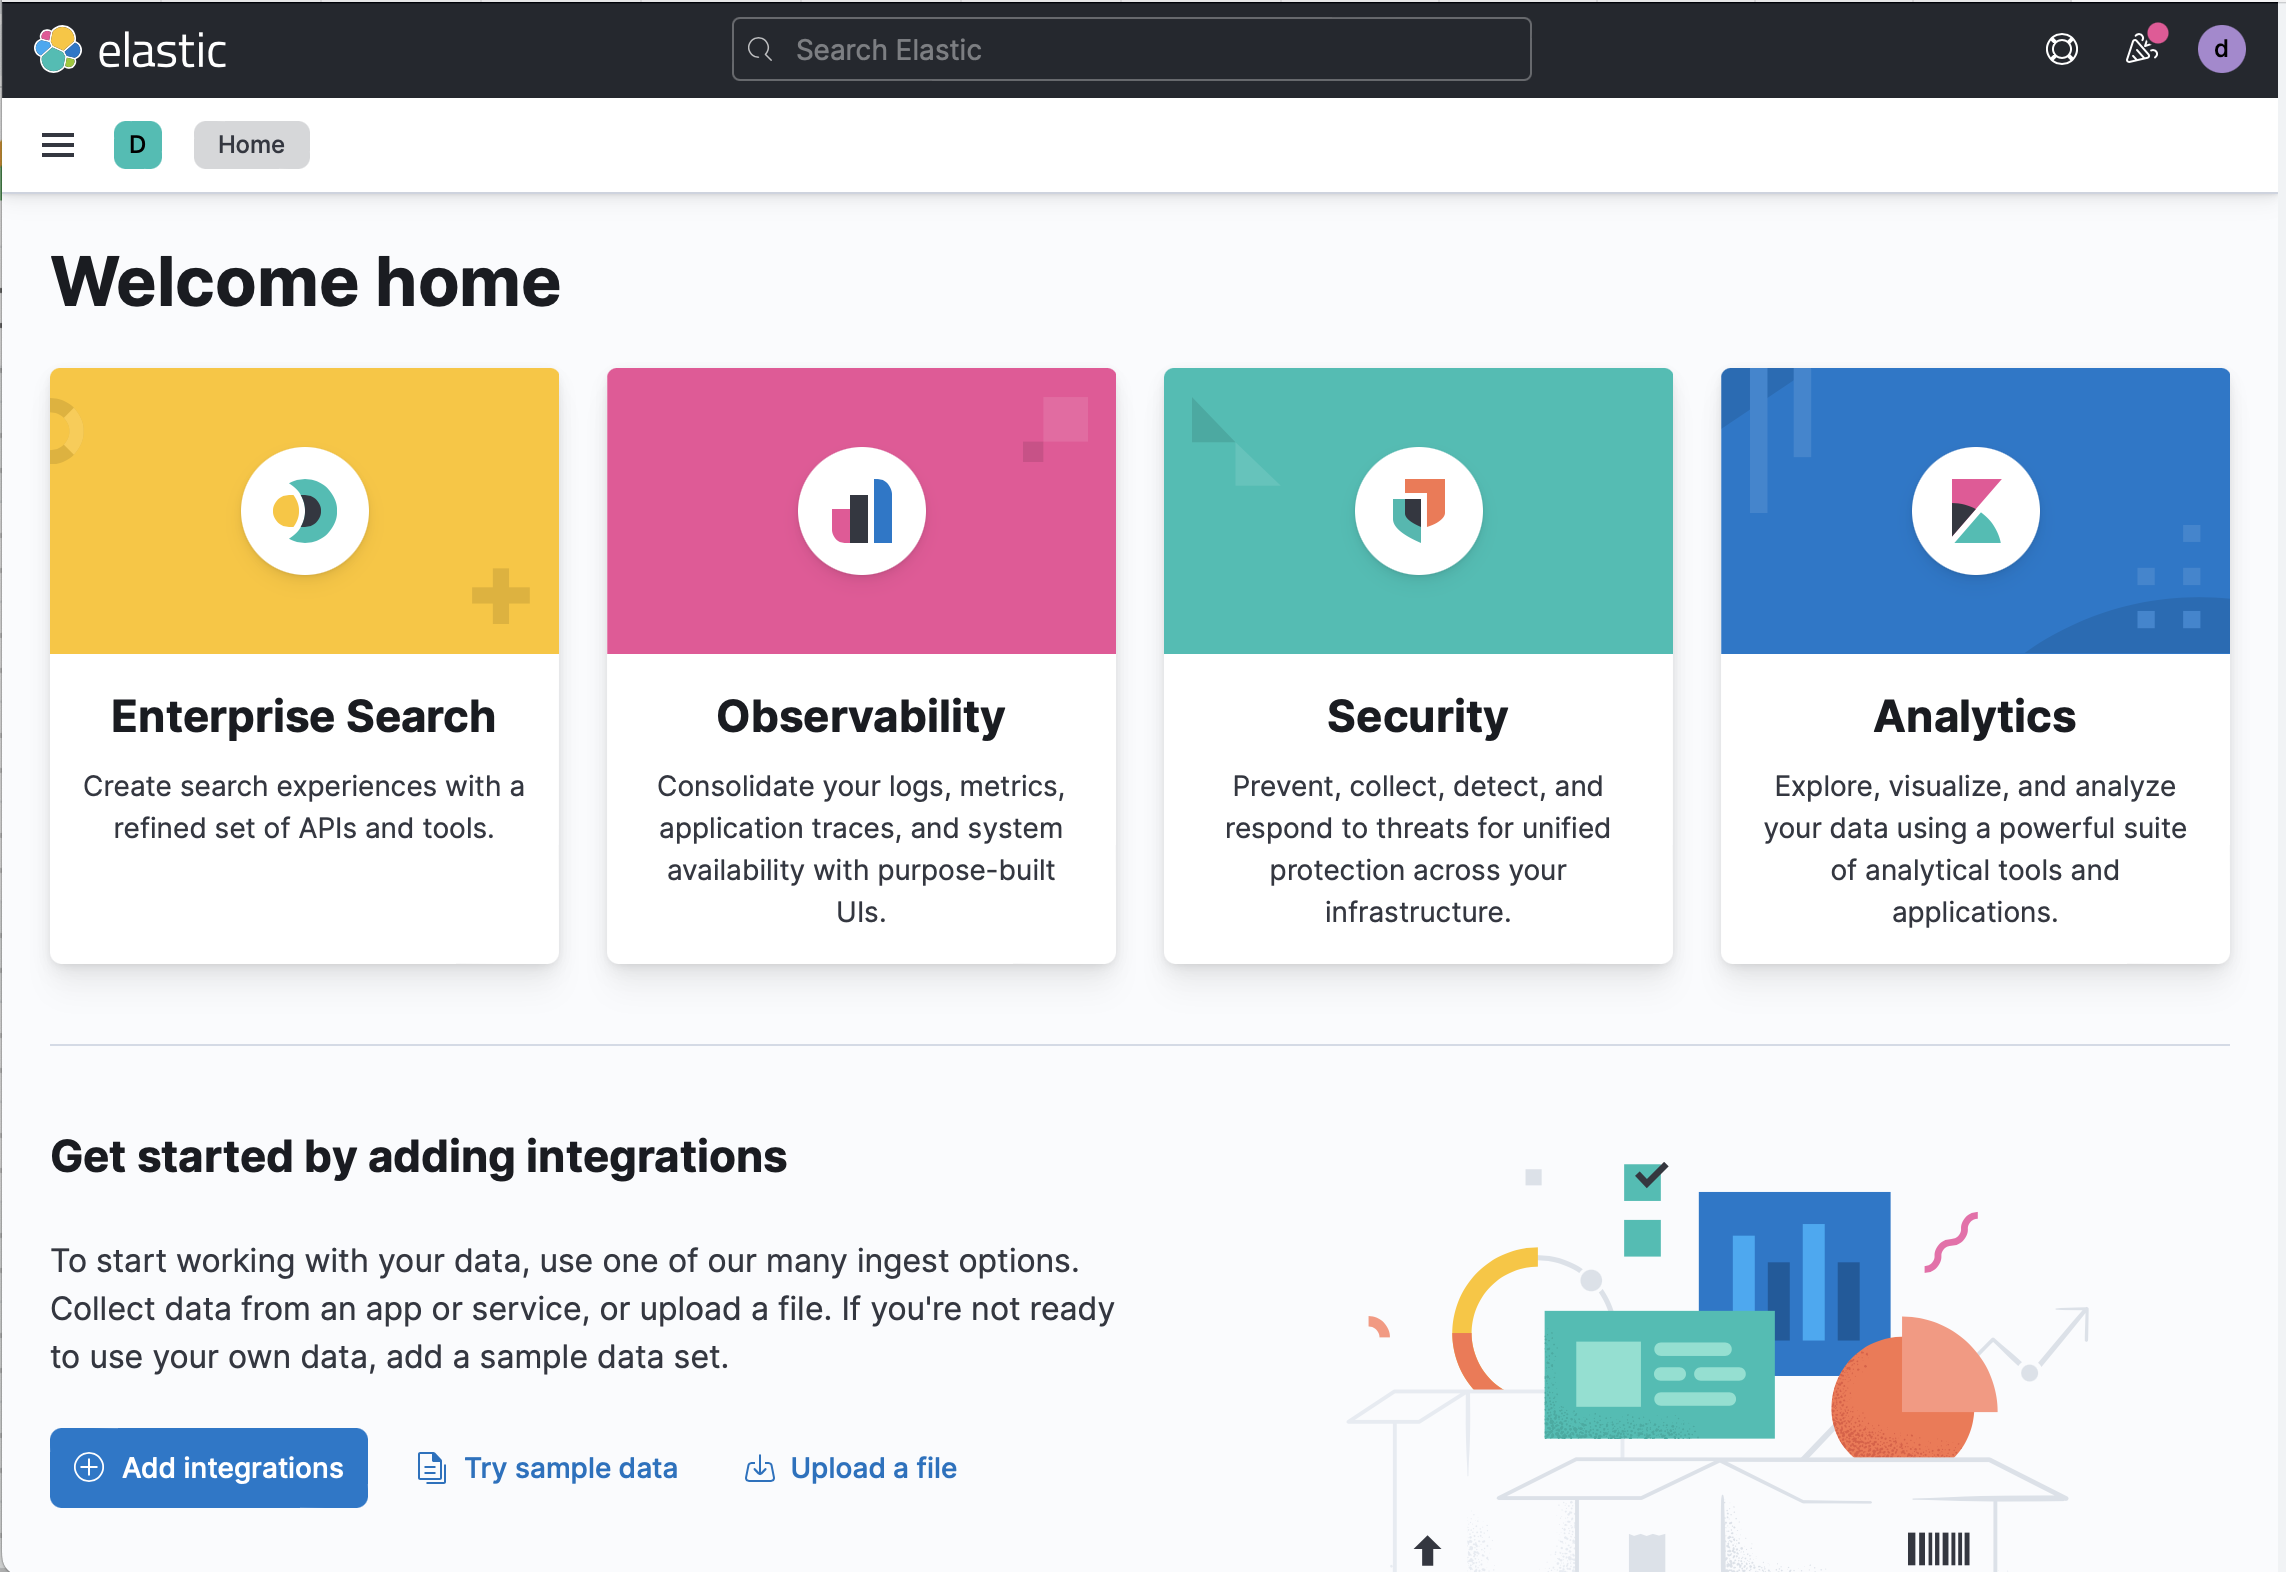
elasticsuperuser password and keep it in a safe place. - Once the deployment is ready, select Continue. At this point, you access Kibana and are prompted to Add integrations or to Explore on your own. Feel free to check the various options and integrations available. You can return to the home page of Kibana at any time by selecting the Elastic logo.
Your deployment includes a pre-configured instance of Fleet Server, which manages the Elastic Agents that you can use to monitor a host system.
Step 2: Add Elastic Agent and the Elastic Agent System integration
editElastic Agent is a single, unified way to add monitoring for logs, metrics, and other types of data to a host. It can also protect hosts from security threats, query data from operating systems, and more. A single agent makes it easy and fast to deploy monitoring across your infrastructure. Each agent has a single policy (a collection of input settings) that you can update to add integrations for new data sources, security protections, and more.
-
Go to the Kibana home page and select Add integrations.
- In the query bar, search for System and select the integration.
- Select Add System.
- Before configuring the integration, you’ll need to install and enroll Elastic Agent. Select Install Elastic Agent. The Set up System integration page opens.
-
Download, install, and enroll the Elastic Agent on your host by selecting your host operating system and following the Install Elastic Agent on your host step.
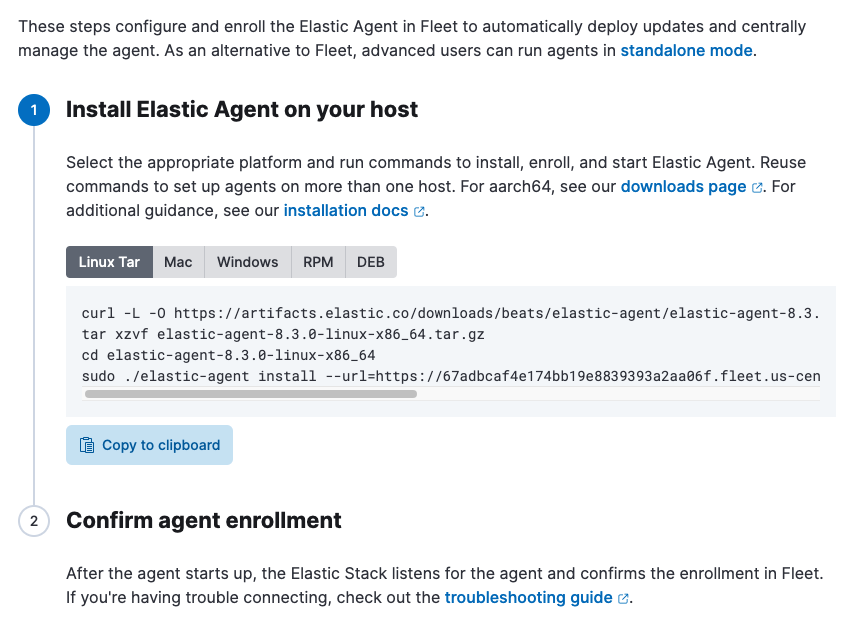
Wait for confirmation that the Elastic Agent is enrolled. This takes about a minute.
- Select Add the integration.
-
You can configure your System integration policy by choosing the types of logs, events, and metrics to collect. For this guide, keep the default options unchanged.
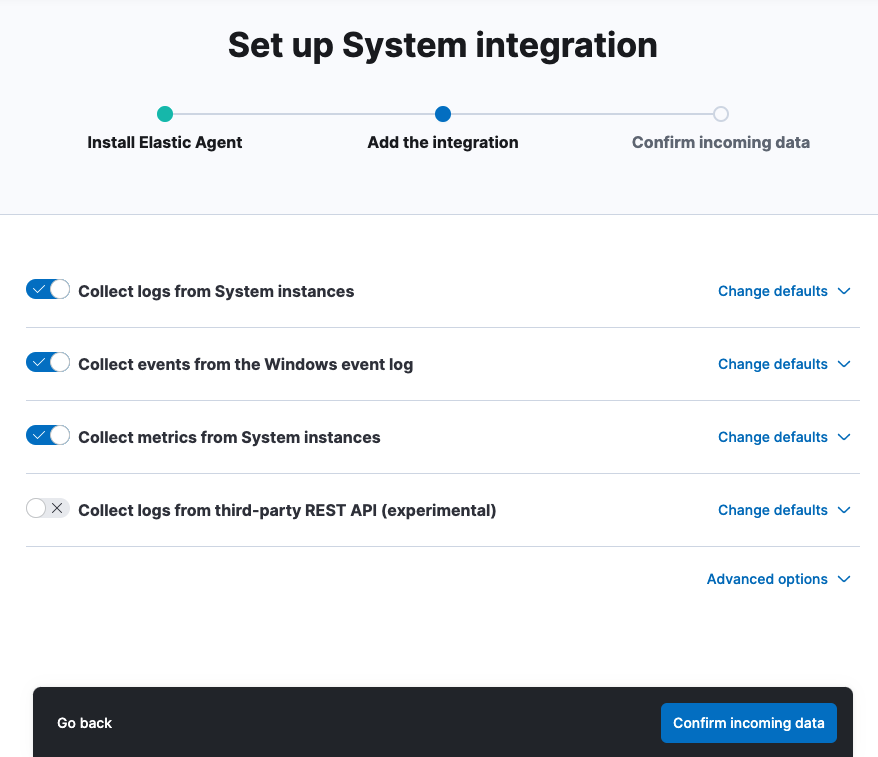
-
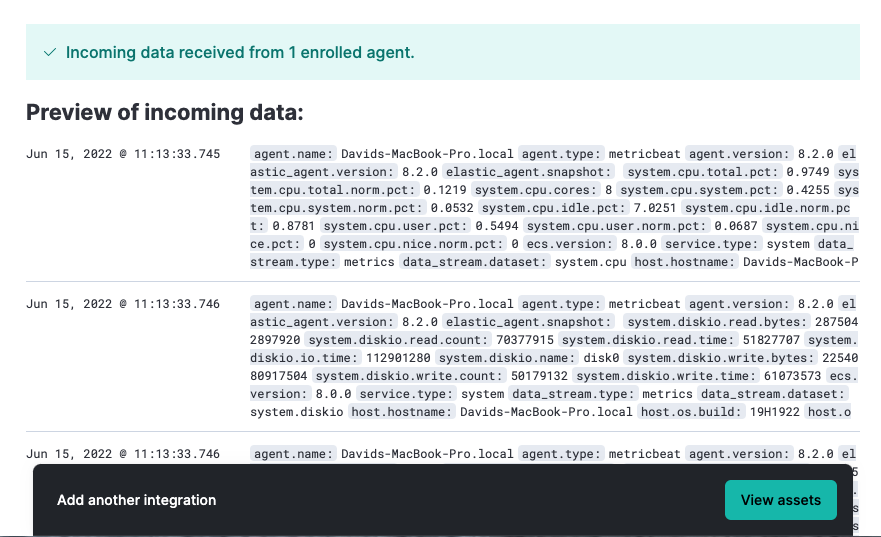
Click Confirm incoming data. Elastic Agent will download the configuration you specified in the policy you just created, start collecting data, and add it to Elasticsearch in your Elastic Cloud deployment.
After the initial data is collected, a preview is available with data collected from your host system.
Step 3: Monitor host logs and metrics
edit- Now that the data is flowing, click View assets to access dashboards related to the System integration.
-
Choose a dashboard that is related to the operating system of your monitored system. Dashboards are available for Microsoft Windows systems and Unix like systems (for example, Linux and macOS).
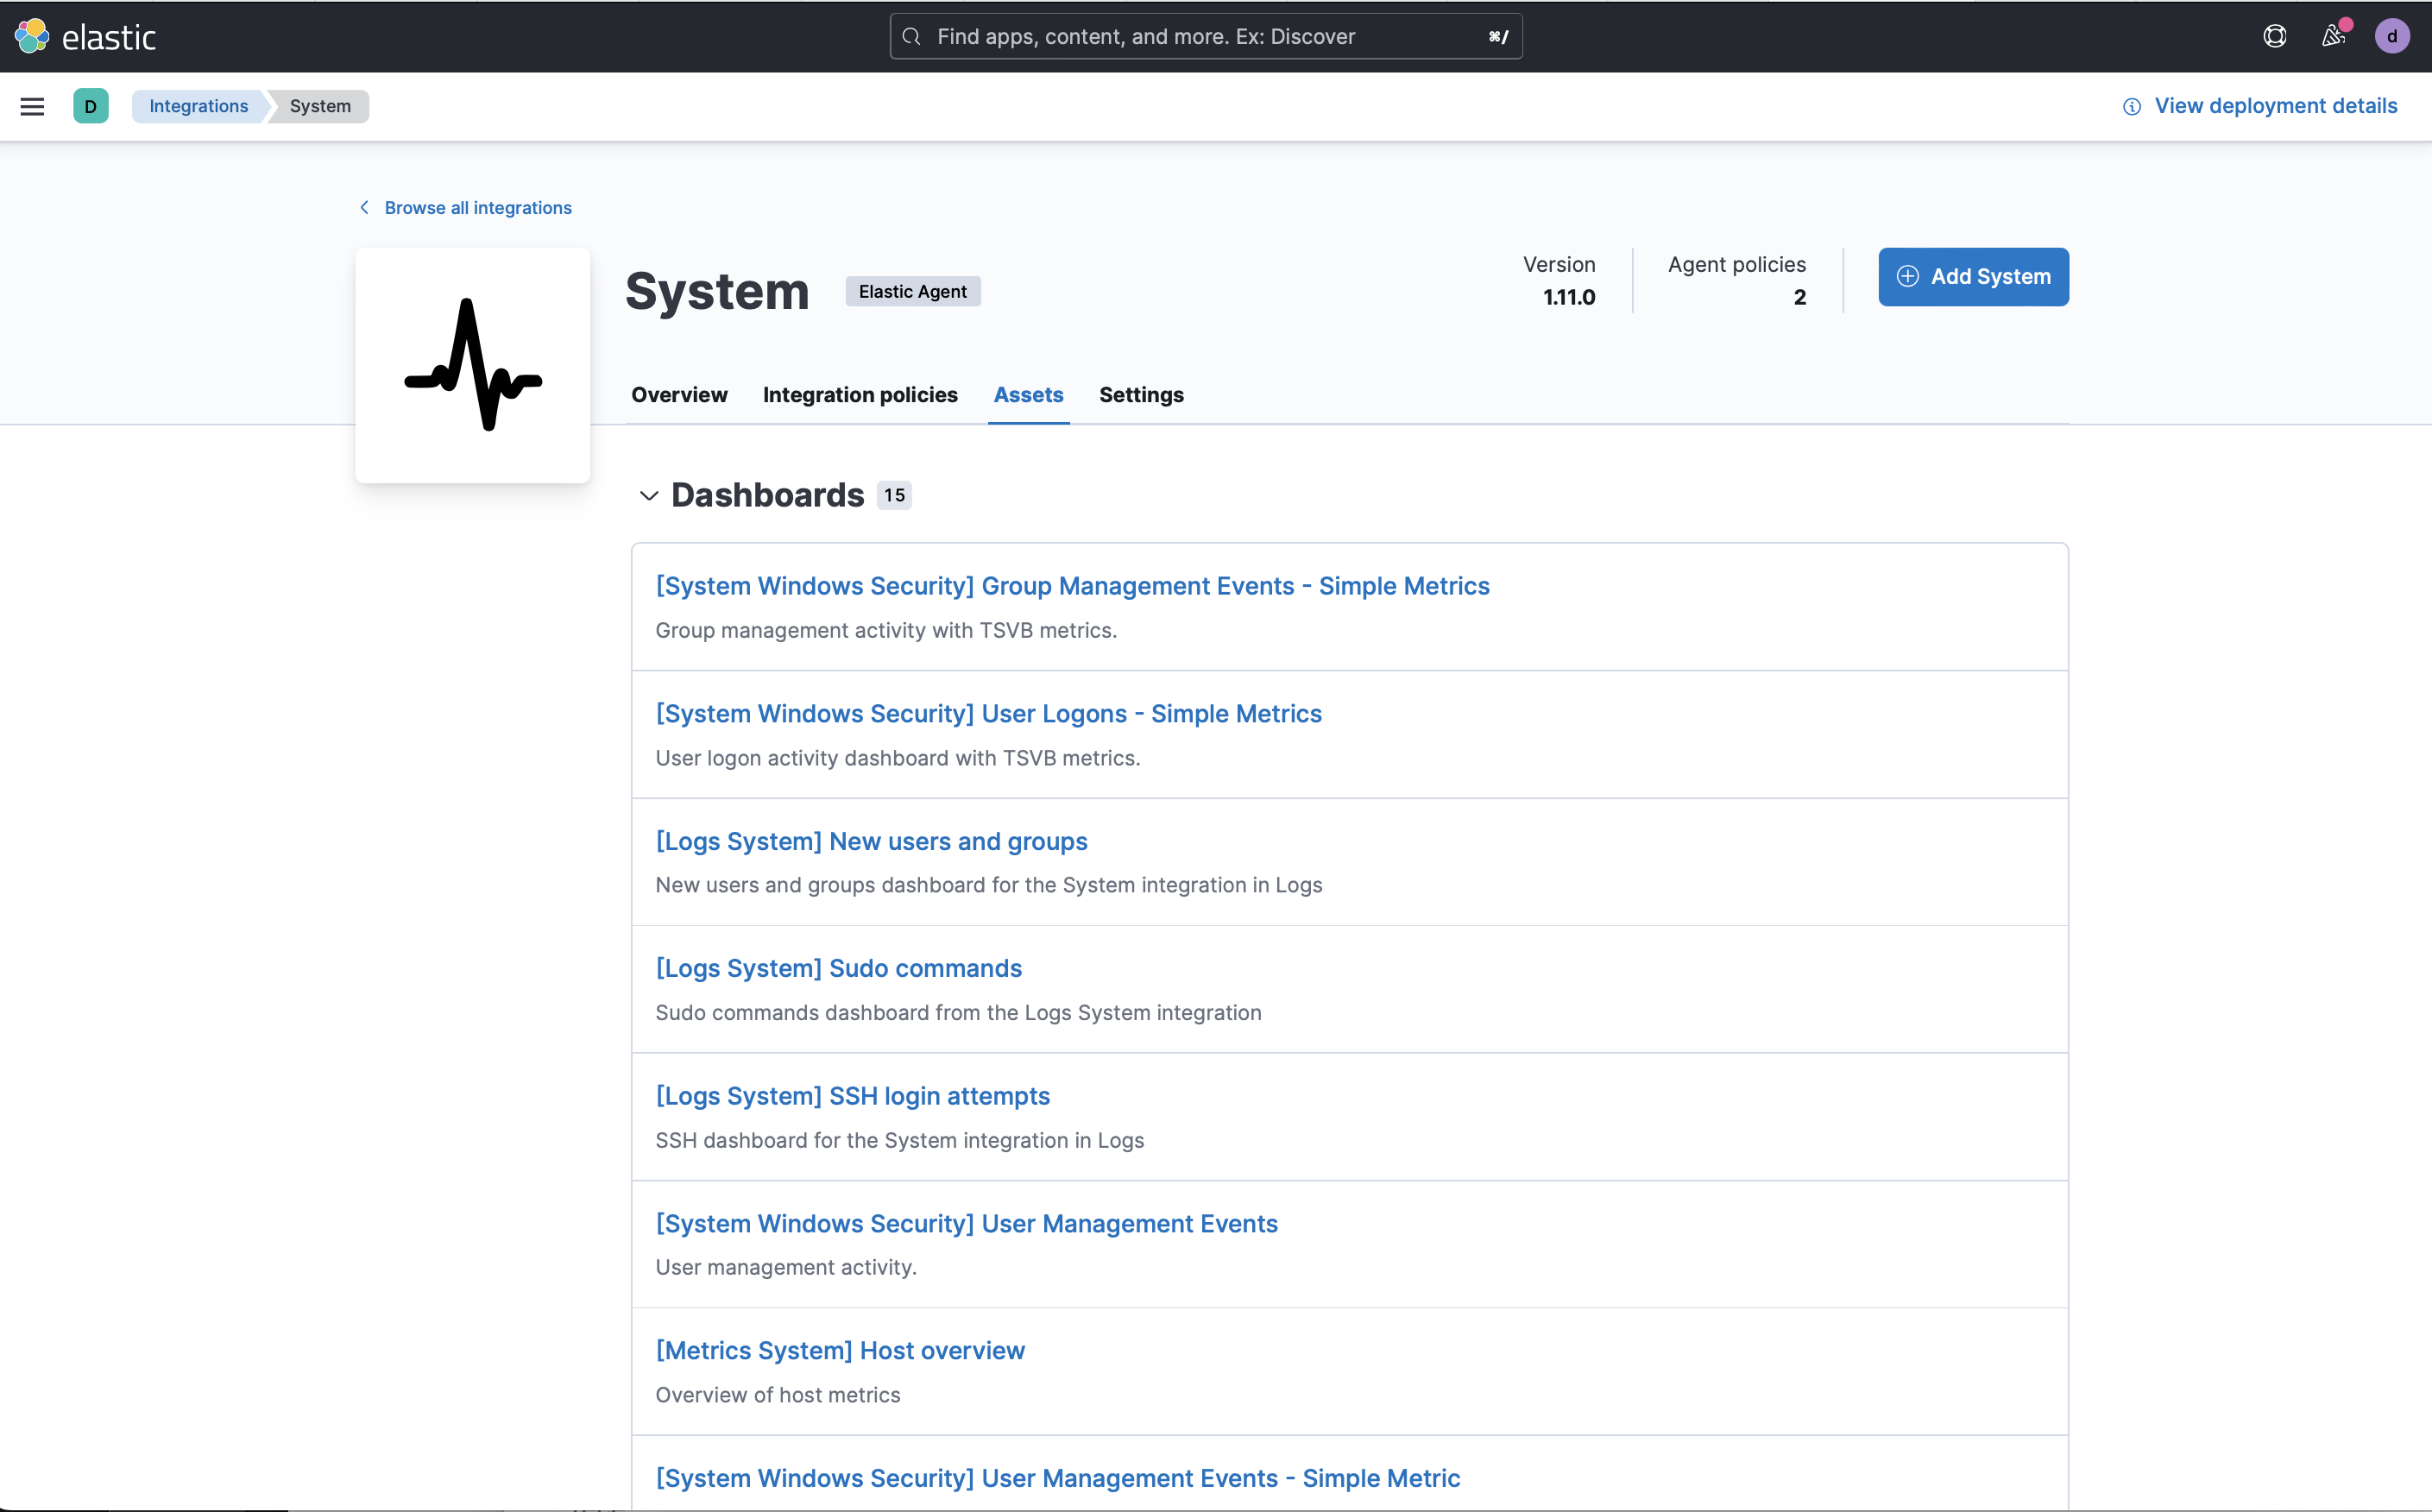
-
Open the [Metrics System] Host overview dashboard to view performance metrics from your host system.
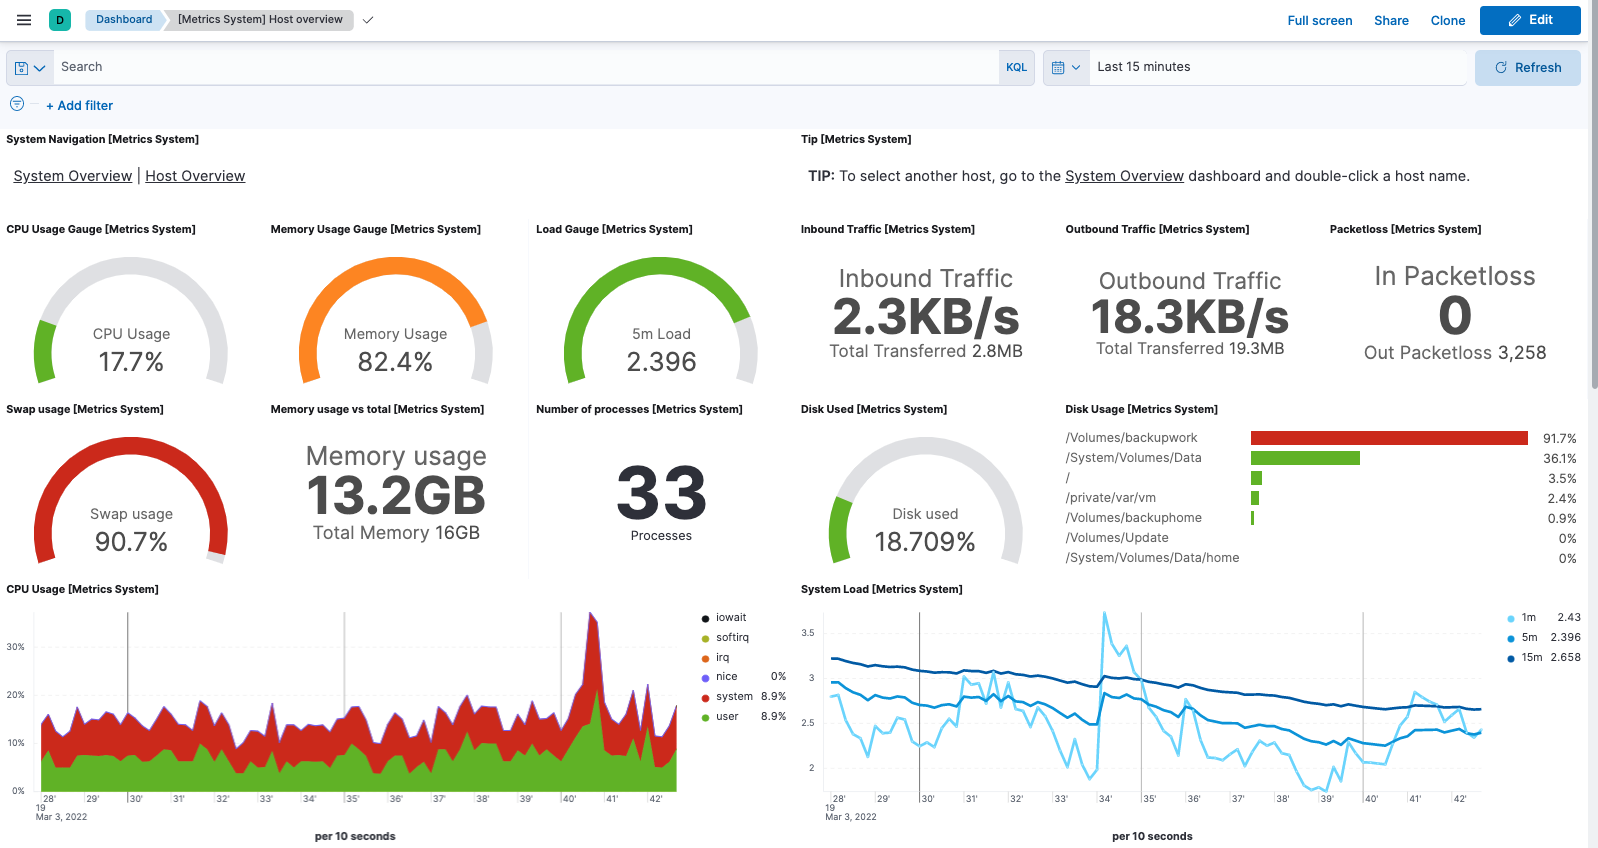
You can hover over any visualization to adjust its settings, or select the Edit button to make changes to the dashboard. To learn more, refer to Dashboard and visualizations.
Step 4: Tidying up
edit-
You’ve now learned how to set up an Elastic Cloud deployment and bring in data from a host system. If you’d like to remove Elastic Agent from your system, run the
uninstallcommand from the directory where it’s running and then follow the prompts.You must run this command as the root user.
sudo /Library/Elastic/Agent/elastic-agent uninstall
You must run this command as the root user.
sudo /opt/Elastic/Agent/elastic-agent uninstall
Open a PowerShell prompt as an Administrator (right-click the PowerShell icon and select Run As Administrator).
From the PowerShell prompt, run:
C:\"Program Files"\Elastic\Agent\elastic-agent.exe uninstall
If you run into any problems, check Uninstall Elastic Agents from edge hosts for the detailed uninstall steps.
What’s next?
editLearn more about Elastic Observability
- For a more detailed version of this guide, including instructions for Elastic Cloud and self-managed environments, and additional steps to monitor Nginx logs and metrics, check Ingest logs, metrics, and uptime data with Elastic Agent.
- Take your investigation to a deeper level! Use Elastic Observability to unify your logs, metrics, uptime, and application performance data.
- Are your eyes tired from staring at a wall of screens? Create alerts and find out about problems while sipping your favorite beverage poolside.
- Got everything working as you want it? Roll out your agent policies to other hosts by deploying Elastic Agents across your infrastructure!
Learn about other Elastic solutions and features
- Want to add search to your website, applications, or organization data? Try out Enterprise Search.
- Want Elastic to do the heavy lifting? Use machine learning to detect anomalies.
- Want to protect your endpoints from security threats? Try Elastic Security. Adding endpoint protection is just another integration that you add to the agent policy!