IMPORTANT: No additional bug fixes or documentation updates will be released for this version.
Managing signal detection rules
editManaging signal detection rulesedit
This functionality is in beta and is subject to change. The design and code is less mature than official GA features and is being provided as-is with no warranties. Beta features are not subject to the support SLA of official GA features.
Rules run periodically and search for documents or machine learning job anomaly scores that meet their criteria. For both prebuilt and custom rules, you can use the Kibana Alerting and Actions feature to send notifications when signals are created. Notifications can be sent via Email, PagerDuty, Slack, and Webhook, and can be configured in the SIEM app when you create or edit a rule.
After you activate a rule, periodically check the rule is running as expected
in the Monitoring tab on the All rules page. If you see
values in the Gap column, you can Troubleshoot missing signals.
When a rule fails to run, the SIEM app tries to rerun it at its next scheduled run time.
On the Rules page, you can:
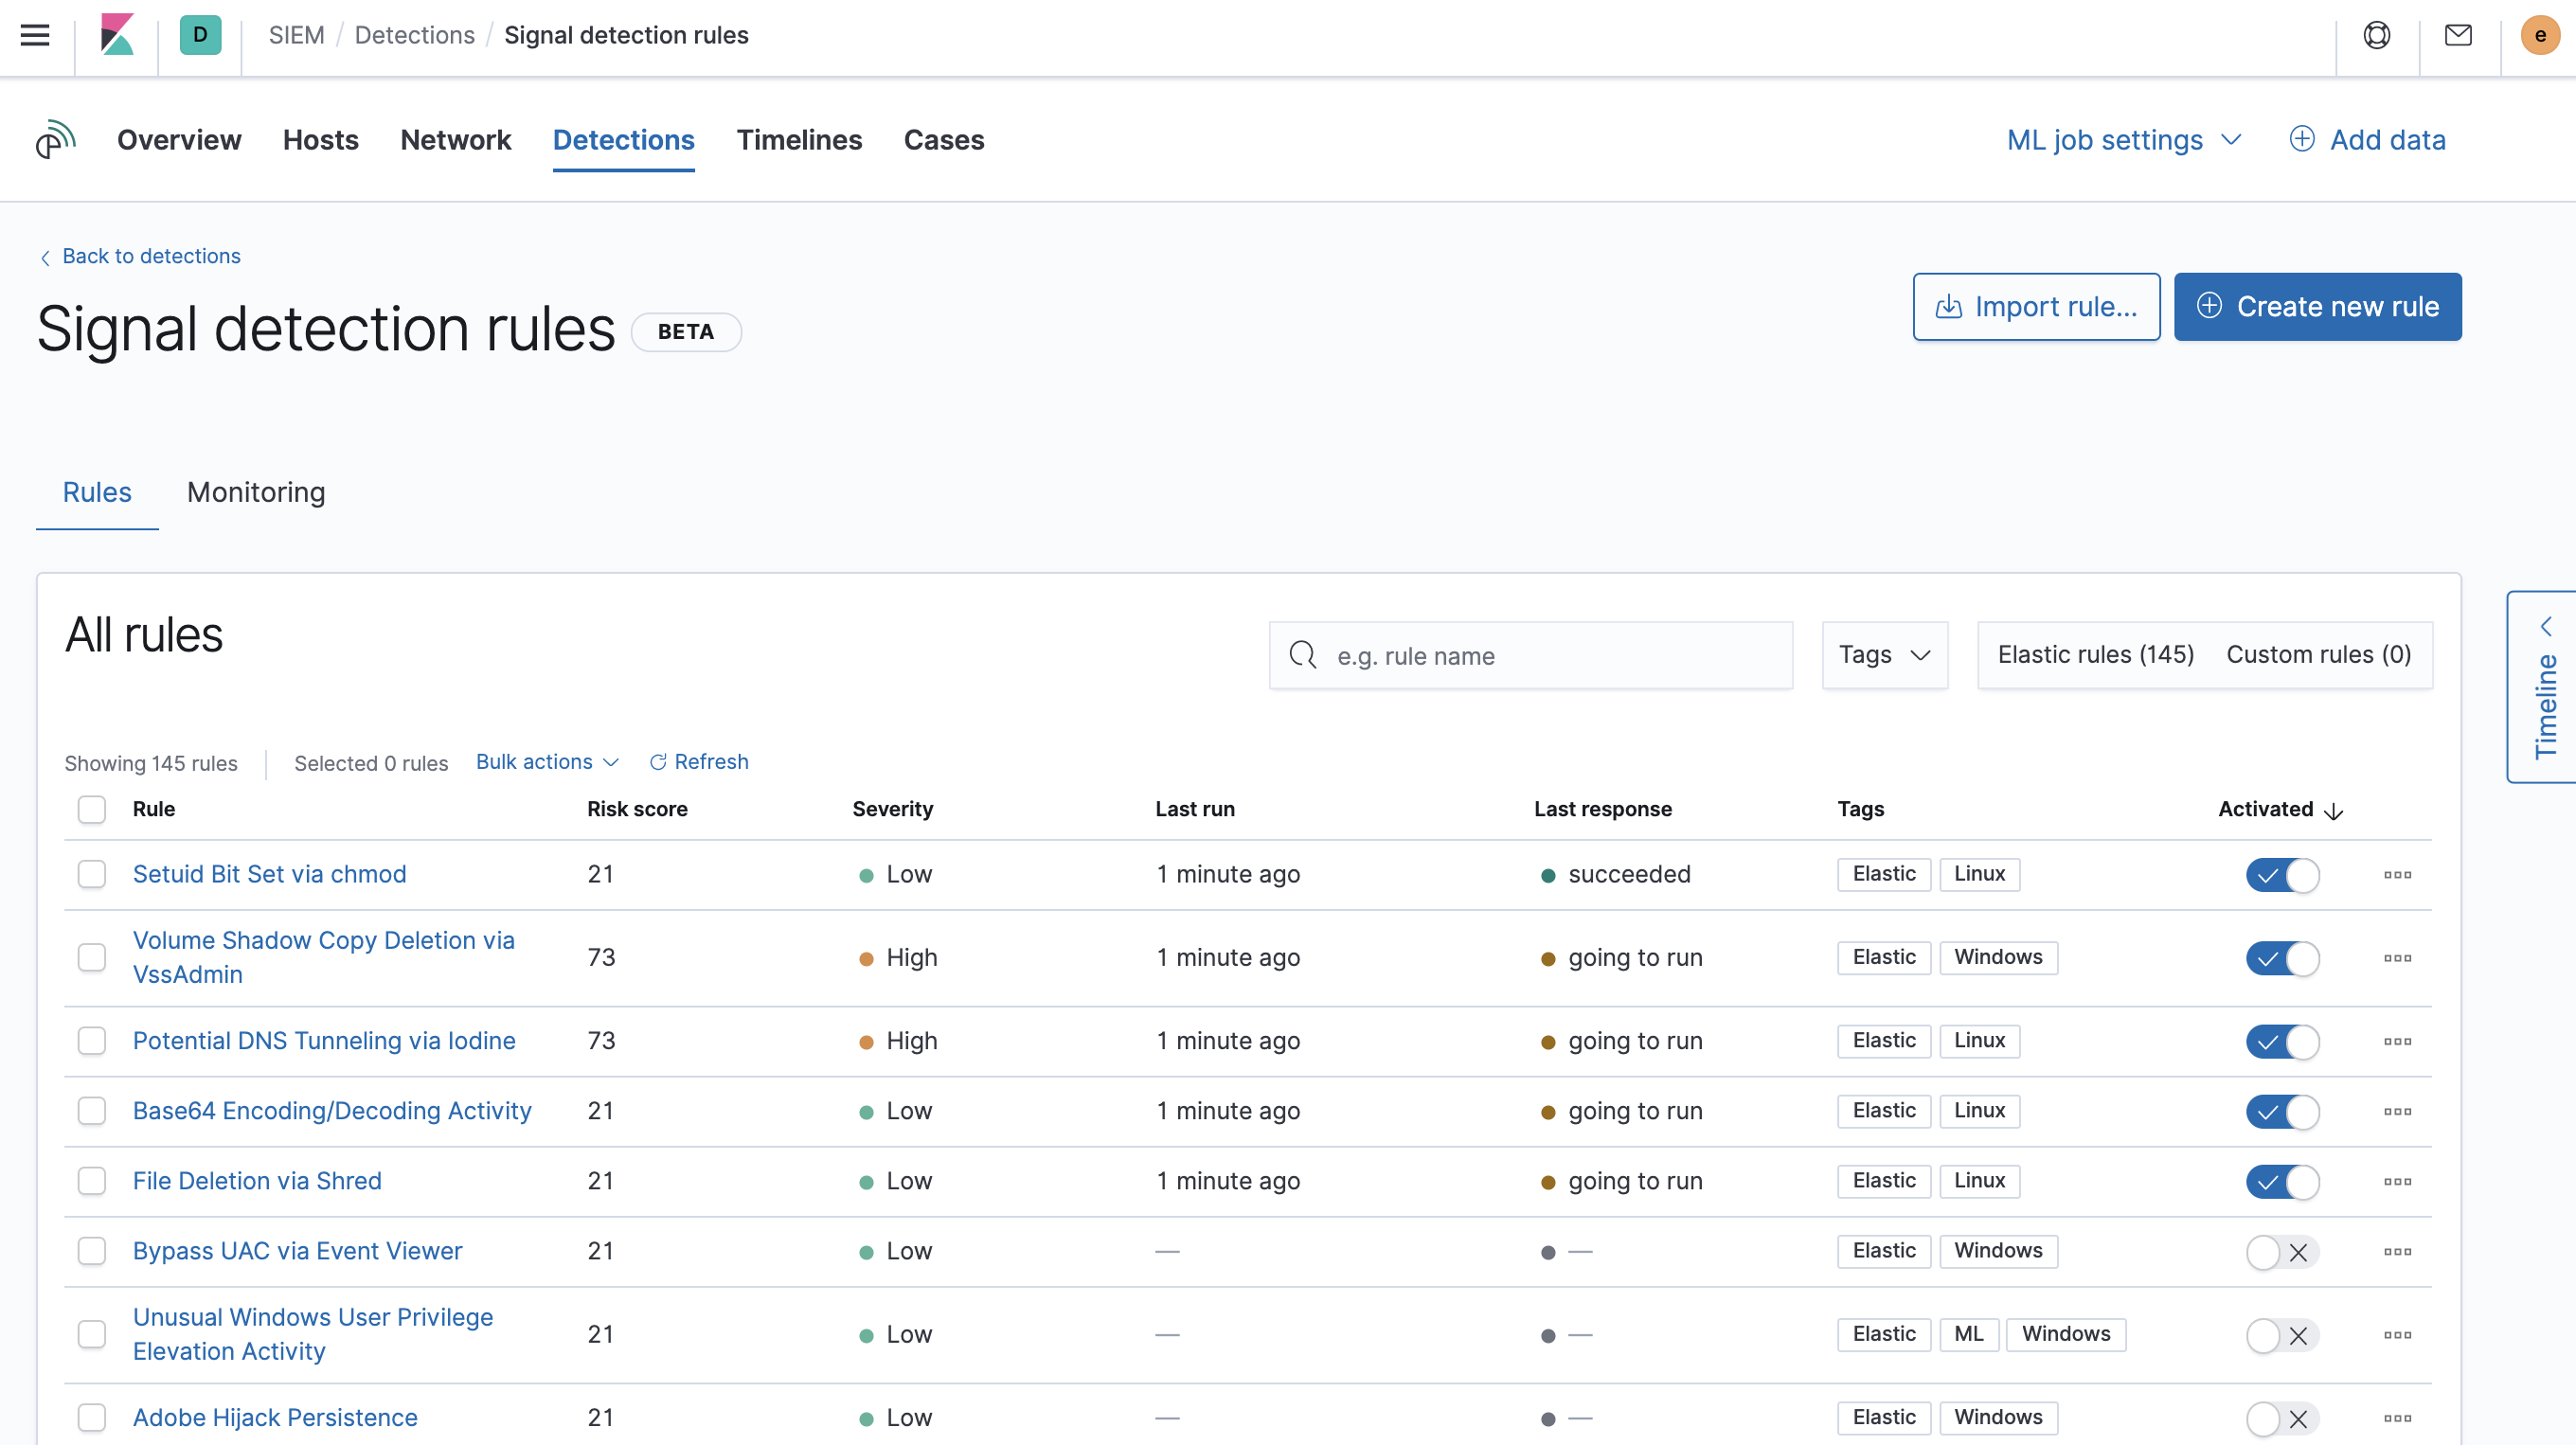
Load prebuilt Elastic rulesedit
To load the SIEM app’s prebuilt rules, click Load Elastic prebuilt rules on the Signal detection rules page (SIEM → Detections → Manage signal detection rules).
If you delete any of the prebuilt rules, a button appears that enables reloading all the deleted prebuilt rules.
By default, prebuilt rules are not activated. If you want to modify a prebuilt rule, you must first duplicate it and then make your changes to the duplicated rule. Filter out uncommon application signals provides a detailed example of duplicating and modifying a rule.
All Elastic prebuilt rules are tagged with the word Elastic.
Select and duplicate all prebuilt rulesedit
- Select the Elastic rules tab.
- Scroll to the bottom of the page.
-
Click the
Rows per pagemenu, and then select 200 rows. - When the page reloads, select all the rules.
- Click Bulk actions → Duplicate selected.
- Select the Custom rules tab.
You can then modify the duplicated rules and, if required, delete the prebuilt ones.
Create a new ruleedit
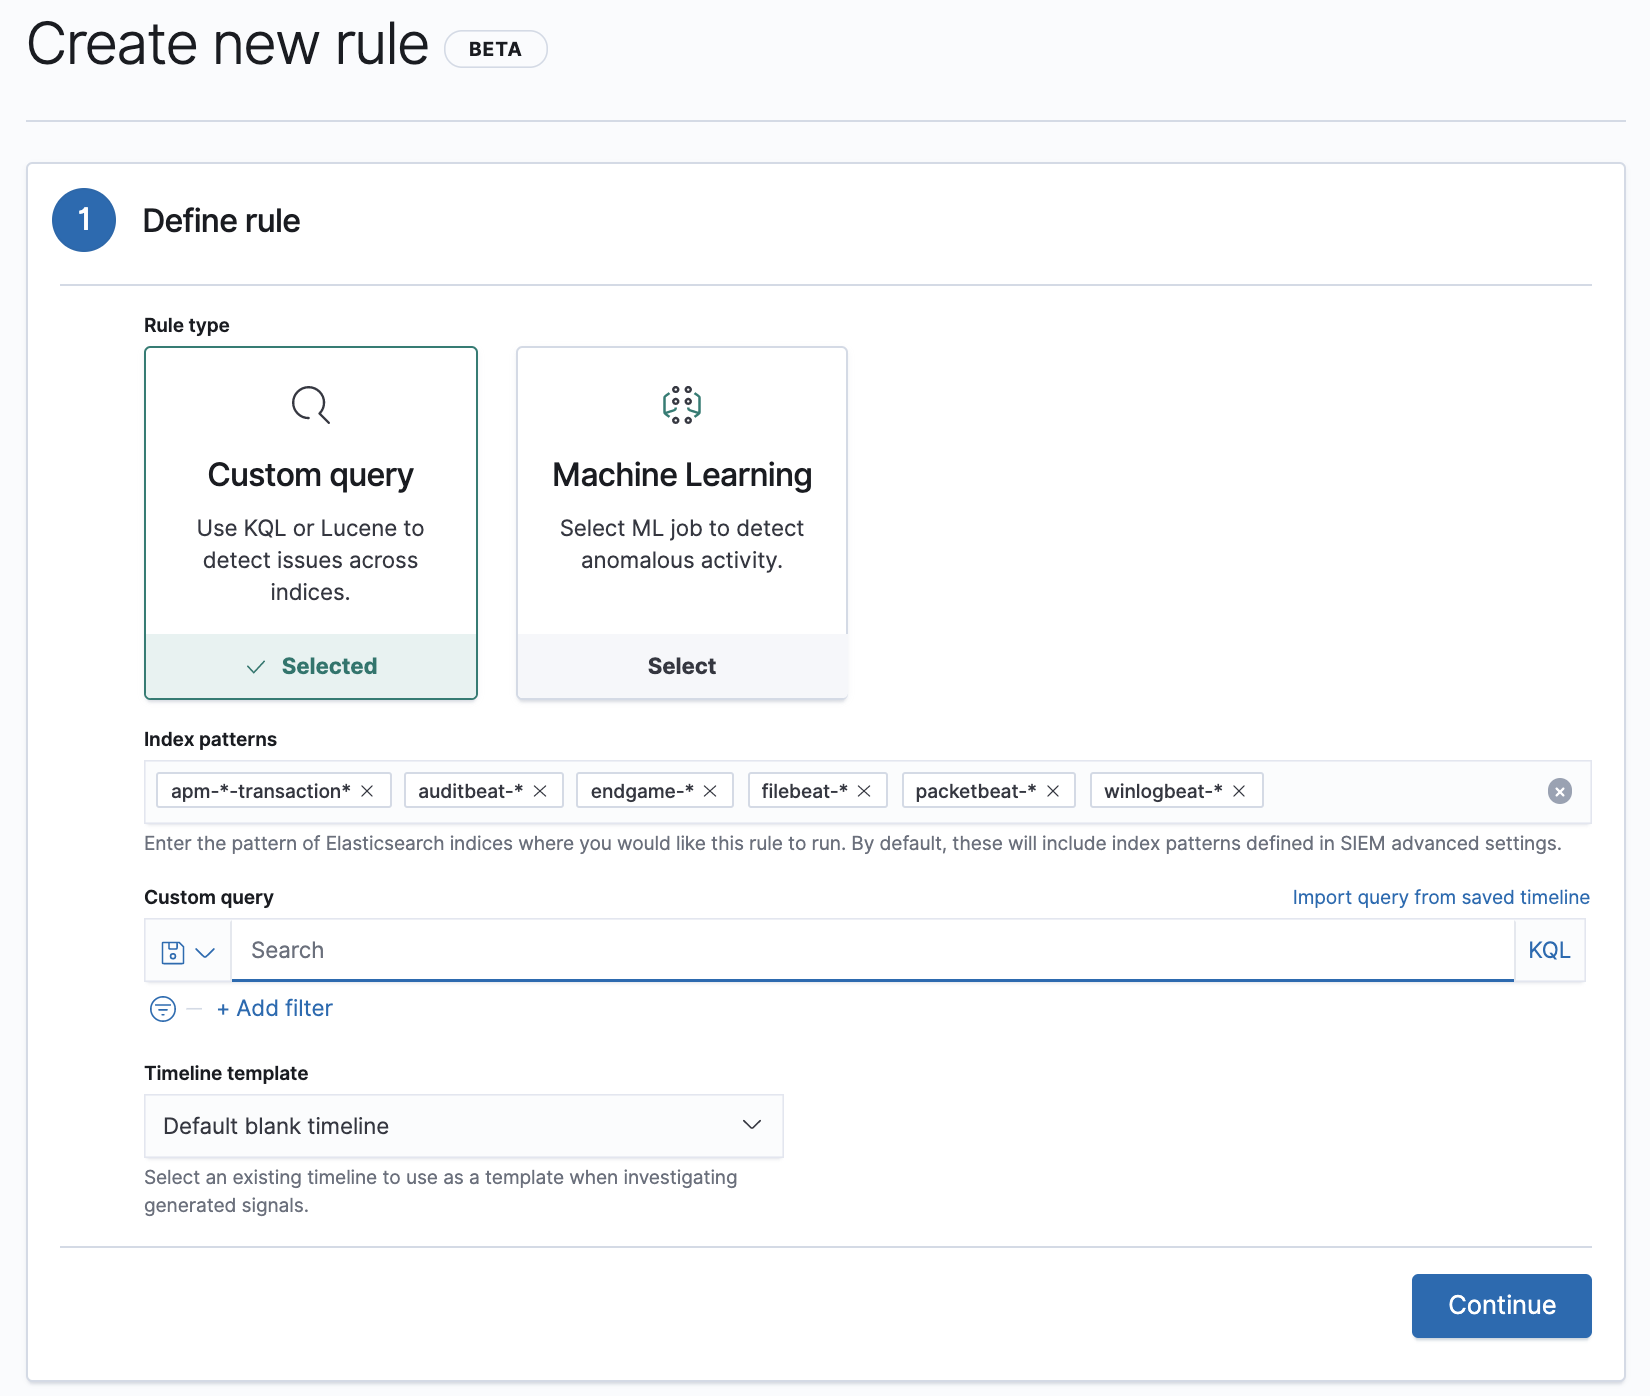
You can create two types of rules:
- Custom query: Query-based rule, which searches the defined indices and creates a signal when a document matches the rule’s query.
-
Machine learning: Machine learning rule, which creates a signal when a machine learning job discovers an anomaly above the defined threshold (see Anomaly Detection with Machine Learning).
For machine learning rules, the associated machine learning job must be running. If the machine learning job is not running, the rule will:
- Run and create signals if existing anomaly scores above the defined threshold are discovered.
- Issue an error stating the machine learning job was not running when the rule executed.
To create or edit machine learning rules, you must have the
appropriate license or use a
cloud deployment. Additionally, you must have the
machine_learning_admin user role.
- Go to SIEM → Detections → Manage signal detection rules.
-
Click Create new rule.
The Create new rule page is displayed.
-
Do one of the following:
-
To create a rule based on a machine learning anomaly threshold, select Machine Learning and then:
- The required machine learning job.
-
The anomaly score threshold above which signals are created.
The selected machine learning job must be running for the rule to function correctly.
-
To create a rule based on a KQL or Lucene query, select Custom query and then:
- Define which Elasticsearch indices the rule analyzes for signals.
-
Use the filter and query fields to create the criteria used for detecting signals.
You can use Kibana saved queries (save icon) and queries from saved timelines (
Import query from saved timeline) as rule conditions.For example, the following rule detects when the
vssadmin delete shadowsWindows command is executed:-
Index patterns:
winlogbeat-*Winlogbeat ships Windows event logs to the SIEM app.
-
Custom query:
event.action:"Process Create (rule: ProcessCreate)" and process.name:"vssadmin.exe" and process.args:("delete" and "shadows")Searches the
winlogbeat-*indices forvssadmin.exeexecutions with thedeleteandshadowarguments, which are used to delete a volume’s shadow copies.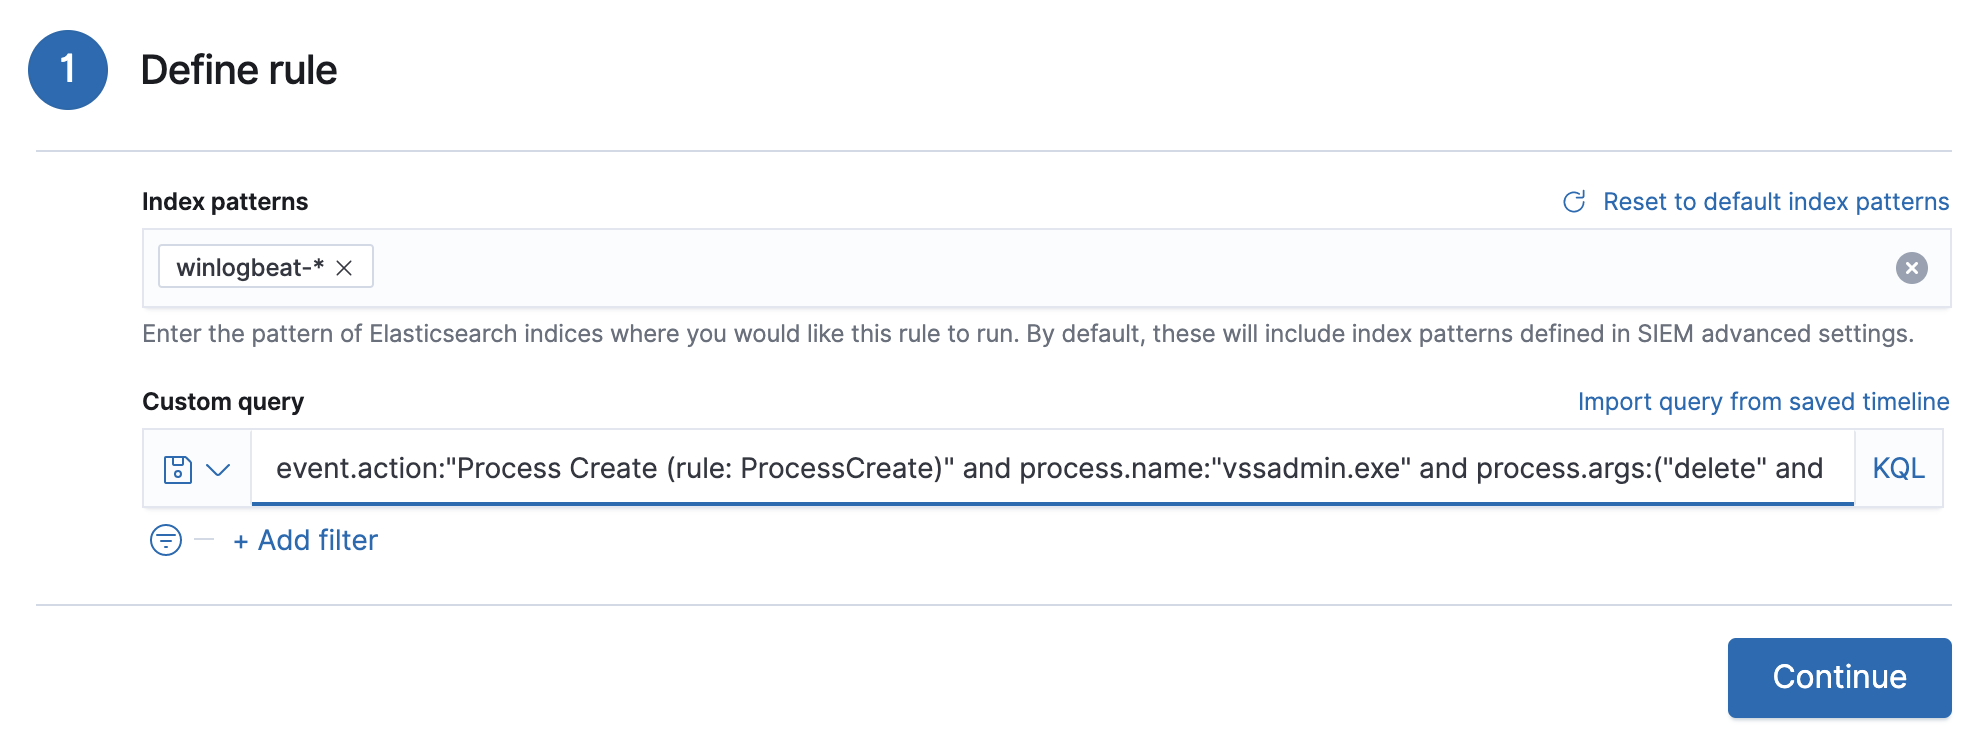
This example is based on the Volume Shadow Copy Deletion via VssAdmin prebuilt rule.
-
-
-
Select the timeline template used when you investigate a signal created by the rule in Timeline (optional).
Before you create rules, create and save relevant timelines so they can be selected here. When signals generated by the rule are investigated in Timeline, some query field values are replaced with their corresponding signal field values.
-
Click Continue.
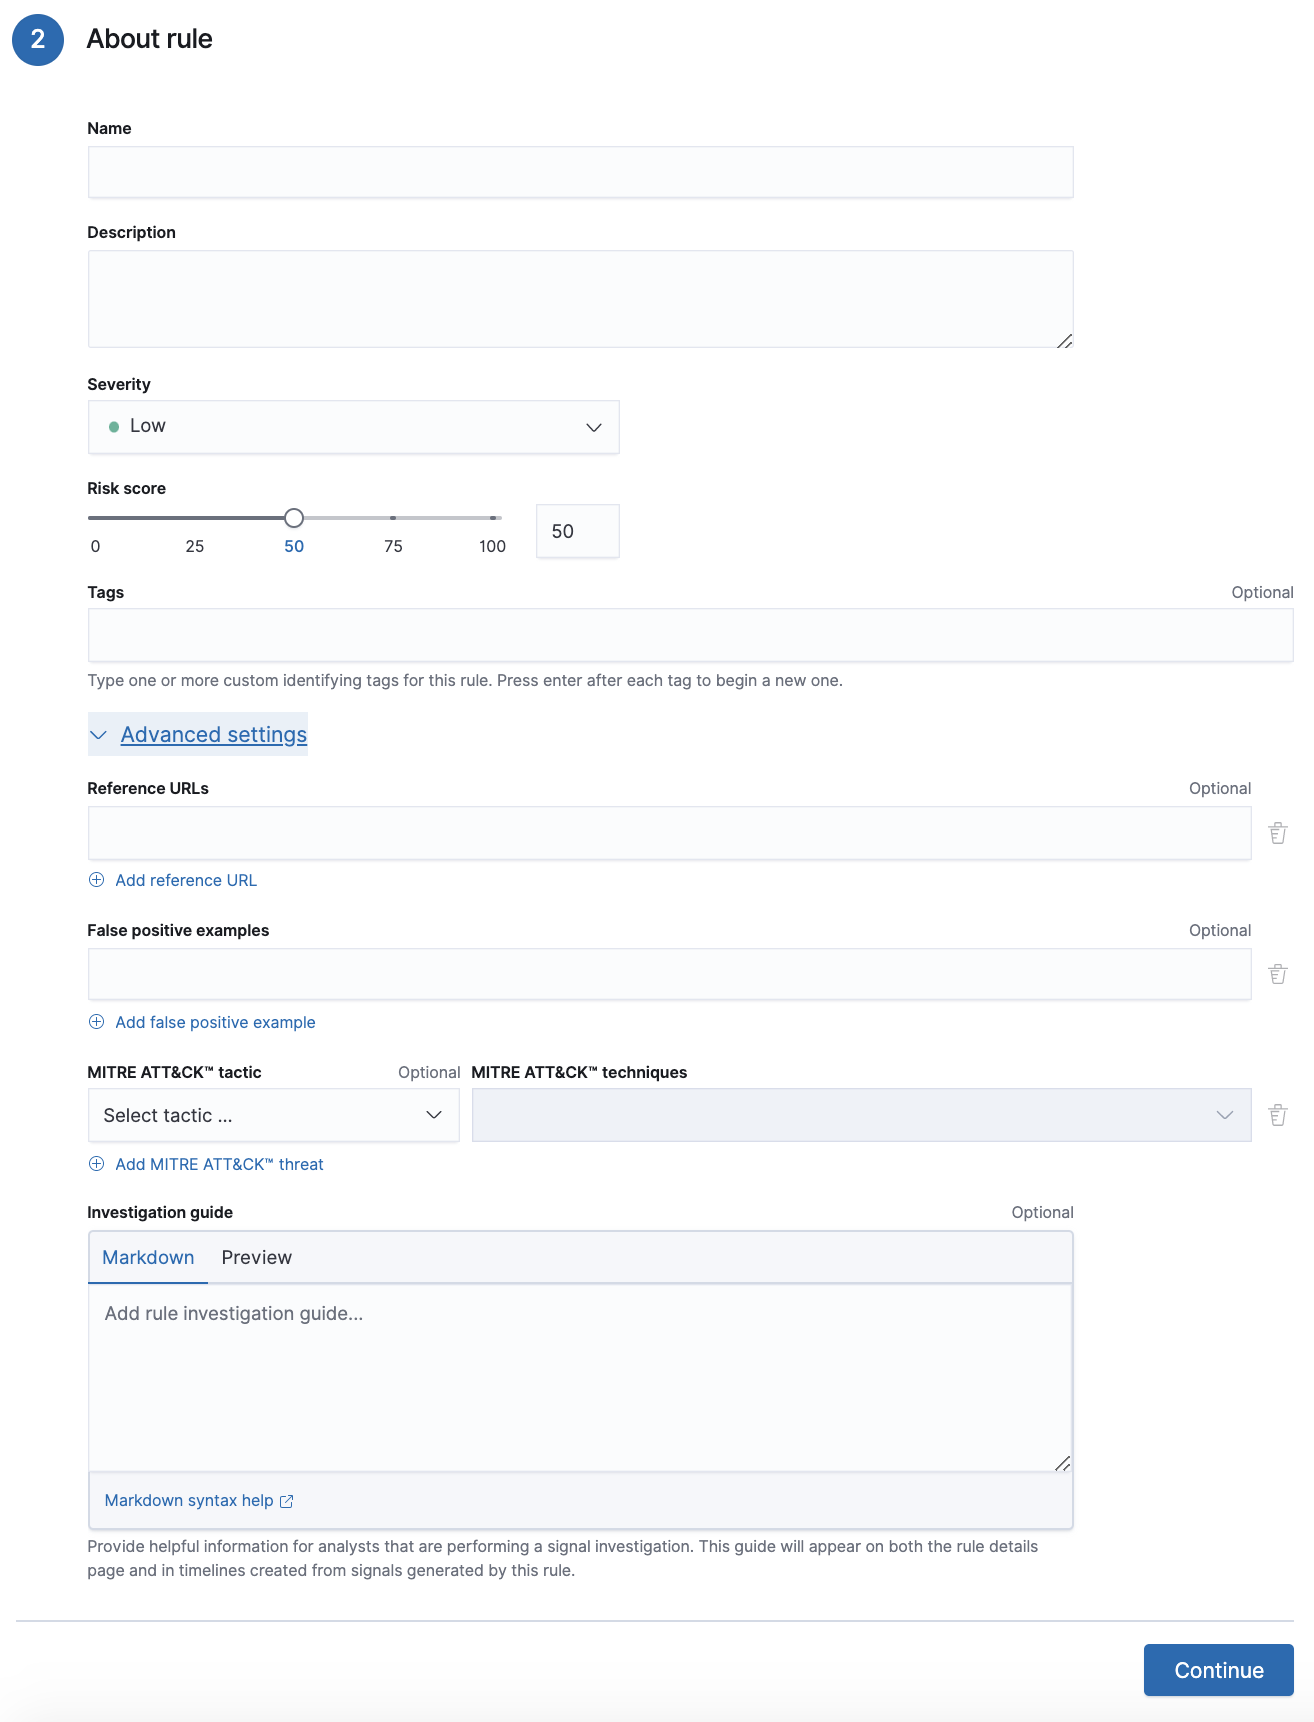
The About rule pane is displayed.
-
Fill in the following fields:
- Name: The rule’s name.
- Description: A description of what the rule does.
-
Severity: Select the severity levels of signals created by the rule:
-
Low: Signals that are of interest but generally not considered to be security incidents. Sometimes, a combination of low severity events can indicate suspicious activity. -
Medium: Signals that require investigation. -
High: Signals that require an immediate investigation. -
Critical: Signals that indicate it is highly likely a security incident has occurred.
-
-
Risk score: A numerical value between 0 and 100 that correlates with the Severity level. General guidelines are:
-
0-21represents low severity. -
22-47represents medium severity. -
48-73represents high severity. -
74-100represents critical severity.
-
-
For additional options, click Advanced settings and fill in any of these fields:
- Reference URLs (optional): References to information that is relevant to the rule. For example, links to relevant background information.
- False positives (optional): List of common scenarios that may produce false-positive signals.
- MITRE ATT&CKTM (optional): Relevant MITRE framework tactics and techniques.
- Tags (optional): Words and phrases used to categorize, filter, and search the rule.
- Investigation guide (optional): Information for analysts investigating signals created by the rule.
-
Click Continue.
The Schedule rule pane is displayed.
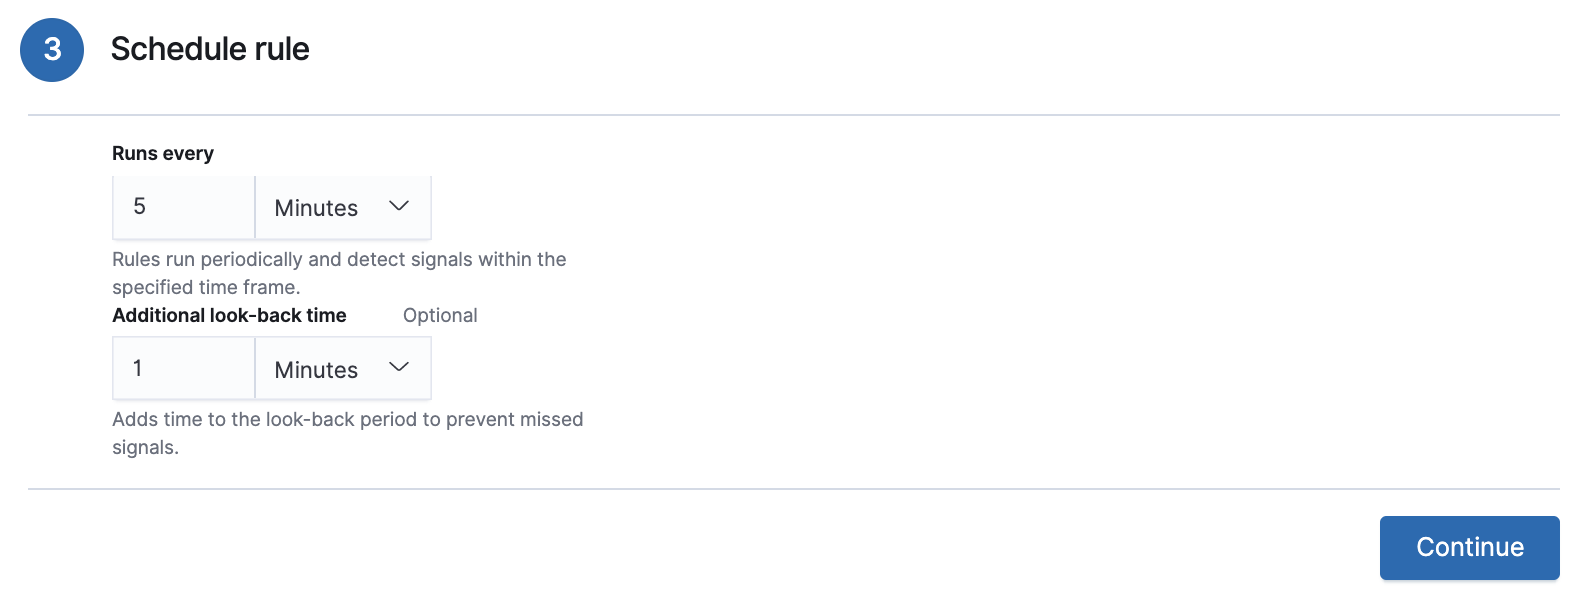
- Select how often the rule runs.
-
Optionally, add
Additional look-back timeto the rule. When defined, the rule searches indices with the additional time.For example, if you set a rule to run every 5 minutes with an additional look-back time of 1 minute, the rule runs every 5 minutes but analyses the documents added to indices during the last 6 minutes.
It is recommended to set the
Additional look-back timeto at least 1 minute. This ensures there are no missing signals when a rule does not run exactly at its scheduled time.The SIEM app performs deduplication. Duplicate signals discovered during the
Additional look-back timeare not created. -
Click Continue.
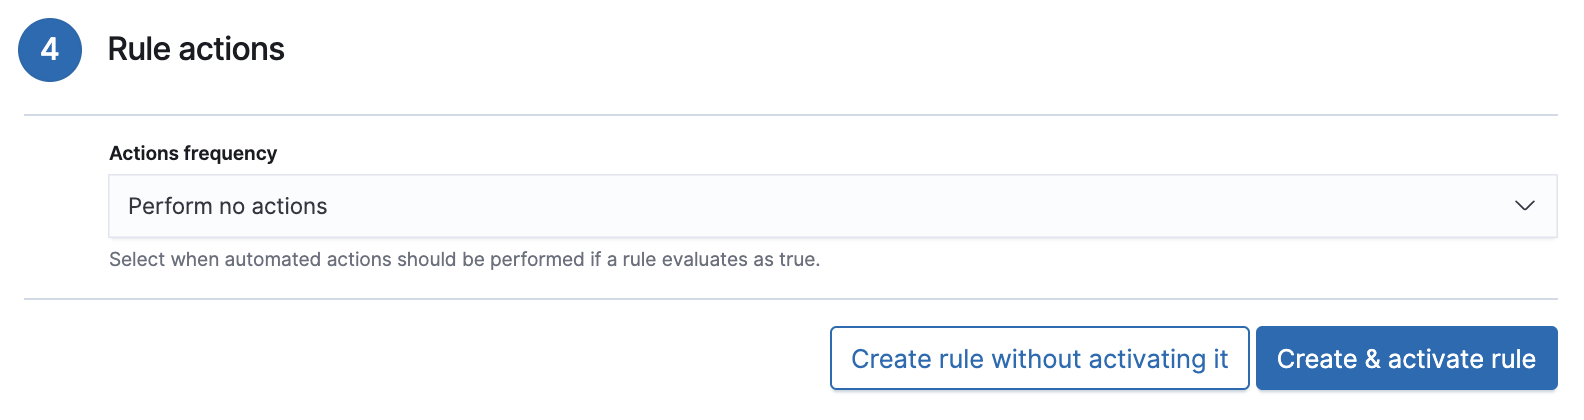
The Rule actions pane is displayed.
-
Optionally, use Kibana Actions to set up notifications sent via other systems when new signals are detected.
To use Kibana Actions for signal notifications, you need the appropriate license.
-
Set how often notifications are sent:
- On each rule execution: Sends a notification every time new signals are detected.
- Hourly: Sends a notification every hour.
- Daily: Sends a notification every day.
-
Weekly: Sends a notification every week.
Notifications are sent only when new signals are detected.
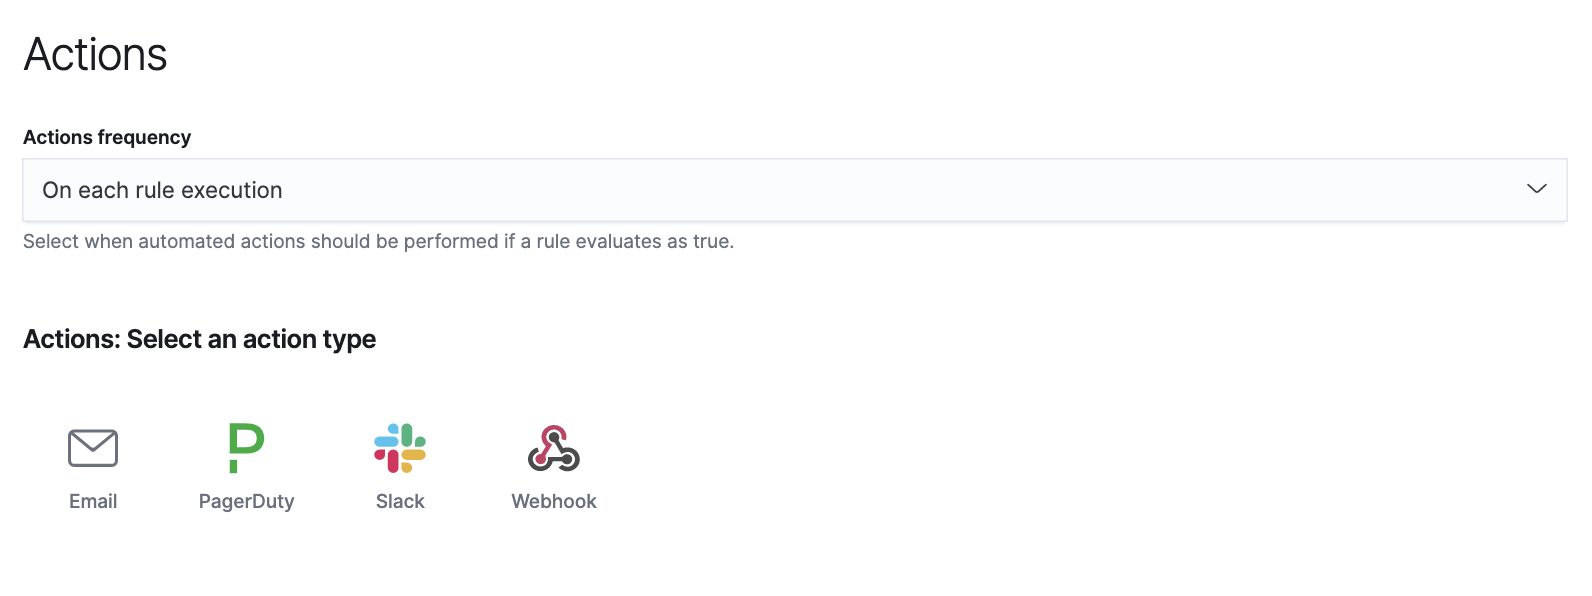
The available action types are displayed.
-
Select the required action type, which determines how notifications are sent (Email, PagerDuty, Slack, Webhook).
Each action type requires a connector. Connectors store the information required to send the notification from the external system. You can configure connectors while creating the rule or on the Kibana Alerts and Actions page (Management → Alerts and Actions → Connectors). For more information, see Action and connector types.
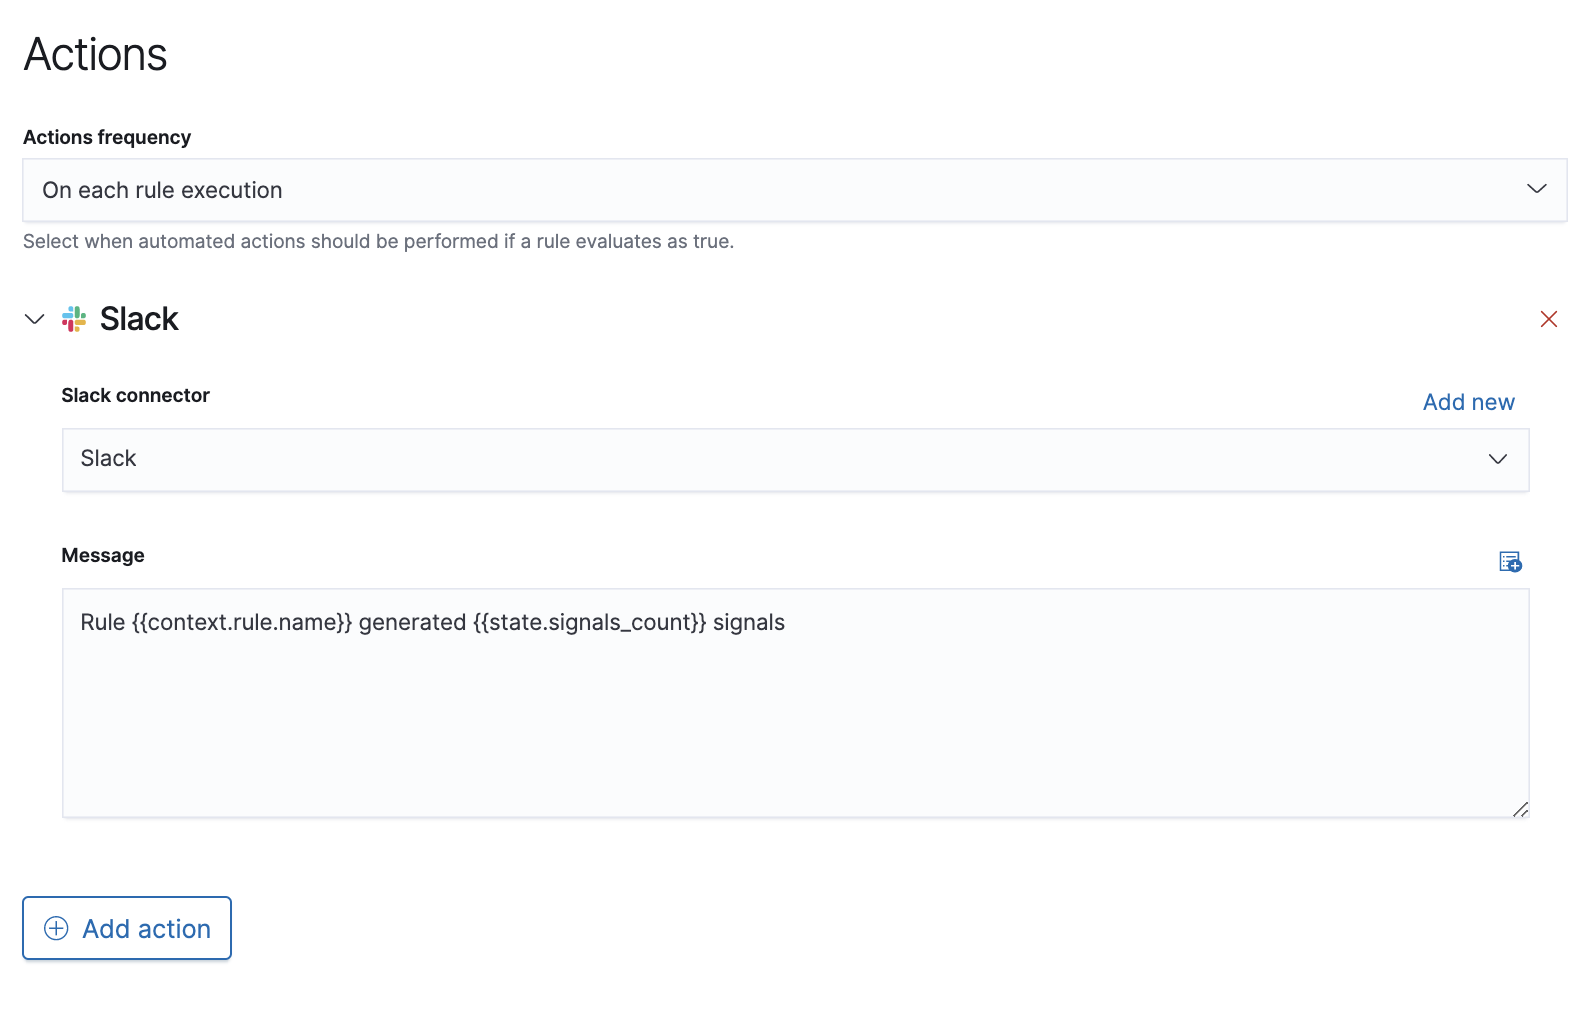
The selected action type fields are displayed (Slack example).
-
Fill in the fields for the selected action types. For all action types, click
the icon above the
Messagefield to add placeholders for rule and signal details to the notifications.
-
-
Save the rule with or without activation.
When you activate a rule, it is queued and its schedule is determined by its initial run time. For example, if you activate a rule that runs every 5 minutes at 14:03 but it does not run until 14:04, it will run again at 14:09.
Notification placeholdersedit
These placeholders can be added to rule action fields:
-
{{state.signals_count}}: Number of signals detected -
{{{context.results_link}}}: URL to the signals in Kibana -
{{context.rule.anomaly_threshold}}: Anomaly threshold score above which signals are generated (machine learning rules only) -
{{context.rule.description}}: Rule description -
{{context.rule.false_positives}}: Rule false positives -
{{context.rule.filters}}: Rule filters (query-based rules only) -
{{context.rule.id}}: Unique rule ID returned after creating the rule -
{{context.rule.index}}: Indices rule runs on (query-based rules only) -
{{context.rule.language}}: Rule query language (query-based rules only) -
{{context.rule.machine_learning_job_id}}: ID of associated machine learning job (machine learning rules only) -
{{context.rule.max_signals}}: Maximum allowed number of signals per rule execution -
{{context.rule.name}}: Rule name -
{{context.rule.output_index}}: Index to which signals are written -
{{context.rule.query}}: Rule query (query-based rules only) -
{{context.rule.references}}: Rule references -
{{context.rule.risk_score}}: Rule risk score -
{{context.rule.rule_id}}: Generated or user-defined rule ID that can be used as an identifier across systems -
{{context.rule.saved_id}}: Saved search ID -
{{context.rule.severity}}: Rule severity -
{{context.rule.threat}}: Rule threat framework -
{{context.rule.timeline_id}}: Associated timeline ID -
{{context.rule.timeline_title}}: Associated timeline name -
{{context.rule.type}}: Rule type -
{{context.rule.version}}: Rule version
Modify existing rulesedit
You can clone, edit, activate, deactivate, and delete rules:
- Go to SIEM → Detections → Manage signal detection rules.
-
Do one of the following:
- Click the actions icon (three dots) and then select the required action.
-
In the Rule column, select all the rules you want to modify, and then the
required action from the
Bulk actionsmenu.
- To activate or deactivate a rule, click the Activate toggle button.
For prebuilt rules, you can only activate, deactivate, delete, and edit rule actions.
Monitor all rule executionsedit
To view a summary of all rule executions, such as failures and last execution times, click the Monitoring tab in the All rules table (SIEM → Detections → Manage signal detection rules).
For detailed information on a rule, its produced signals, and errors, click on a rule name in the All rules table.
Import and export rulesedit
- Go to SIEM → Detections → Manage signal detection rules.
-
To import rules:
- Click Import rule.
-
Drag-and-drop files containing the signal detection rules.
Imported rules must be in an
ndjsonfile.
-
To export rules:
- In the All rules table, select the rules you want to export.
-
Select Bulk actions → Export selected.
You cannot export prebuilt rules.
Troubleshoot missing signalsedit
When a rule fails to run close to its scheduled time, some signals may be missing. There are a number of steps you can perform to try and resolve this issue.
If you see Gaps in the All rules table or on the Rule details page
for a small number of rules, you can increase those rules'
Additional look-back time (Signal detection rules page → the rule’s
actions icon → Edit rule settings → Schedule → Additional look-back time).
If you see gaps for a lot of rules:
- If you restarted Kibana when many rules were activated, try deactivating them and then reactivating them in small batches at staggered intervals. This ensures Kibana does not attempt to run all the rules at the same time.
- Consider adding another Kibana instance to your environment.