IMPORTANT: No additional bug fixes or documentation updates will be released for this version.
SIEM UI
editSIEM UIedit
The SIEM app is a highly interactive workspace designed for security analysts. It provides a clear overview of events from your environment, and you can use the interactive UI to drill down into areas of interest.
The Kibana Query Language (KQL) bar is available throughout the SIEM app for searching and filtering. You can also select areas of interest in time-based histograms, which updates the timepicker.
All SIEM histograms, graphs, and tables contain an Inspect button, so you can examine the Elasticsearch queries used to retrieve data throughout the app.
Chart legends and many grid fields are interactive. Fields that can be dragged to Timeline are indicated with two dotted vertical lines, and are highlighted when you hover over a grid’s row:
When a popup menu appears while hovering over a field, you can perform these actions:
- Filter for value: adds the field to the filter bar
-
Filter out value: adds the field with a
NOToperator to the filter bar - Add to Timeline investigation: adds the field to Timeline
- Show top <field name>: displays a histogram of the top field values
- Copy to clipboard: copies the field and its value to your clipboard, using KQL syntax
The default index glob patterns defined for SIEM events are
endgame-*, auditbeat-*, winlogbeat-*, filebeat-*, packetbeat-*,
and apm-*-transaction*. You can change the default glob patterns in Kibana →
Management → Advanced Settings → siem:defaultIndex.
Overview pageedit
The Overview page provides a high-level view of security events available for analysis, and can help surface problems with data ingestion.
Searchedit
Filter for signals, events, process and other important security information with the benefit of Kibana Query Language (KQL) in the SIEM search bar. A date/time filter set to Last 24 hours is enabled by default, but can be changed to any time range. If you want to filter your search results with other fields, select Add Filter, followed by the field from which to filter and the operator (such is not or is between) for your query.
To save specific filters and queries, click the Save icon and then Save current query.
Timelinesedit
Select the collapsable Timeline button on the right of the SIEM UI to start an investigation. See the Timelines section for more information.
The most recent timelines you’ve accessed appear in Recent Timelines.
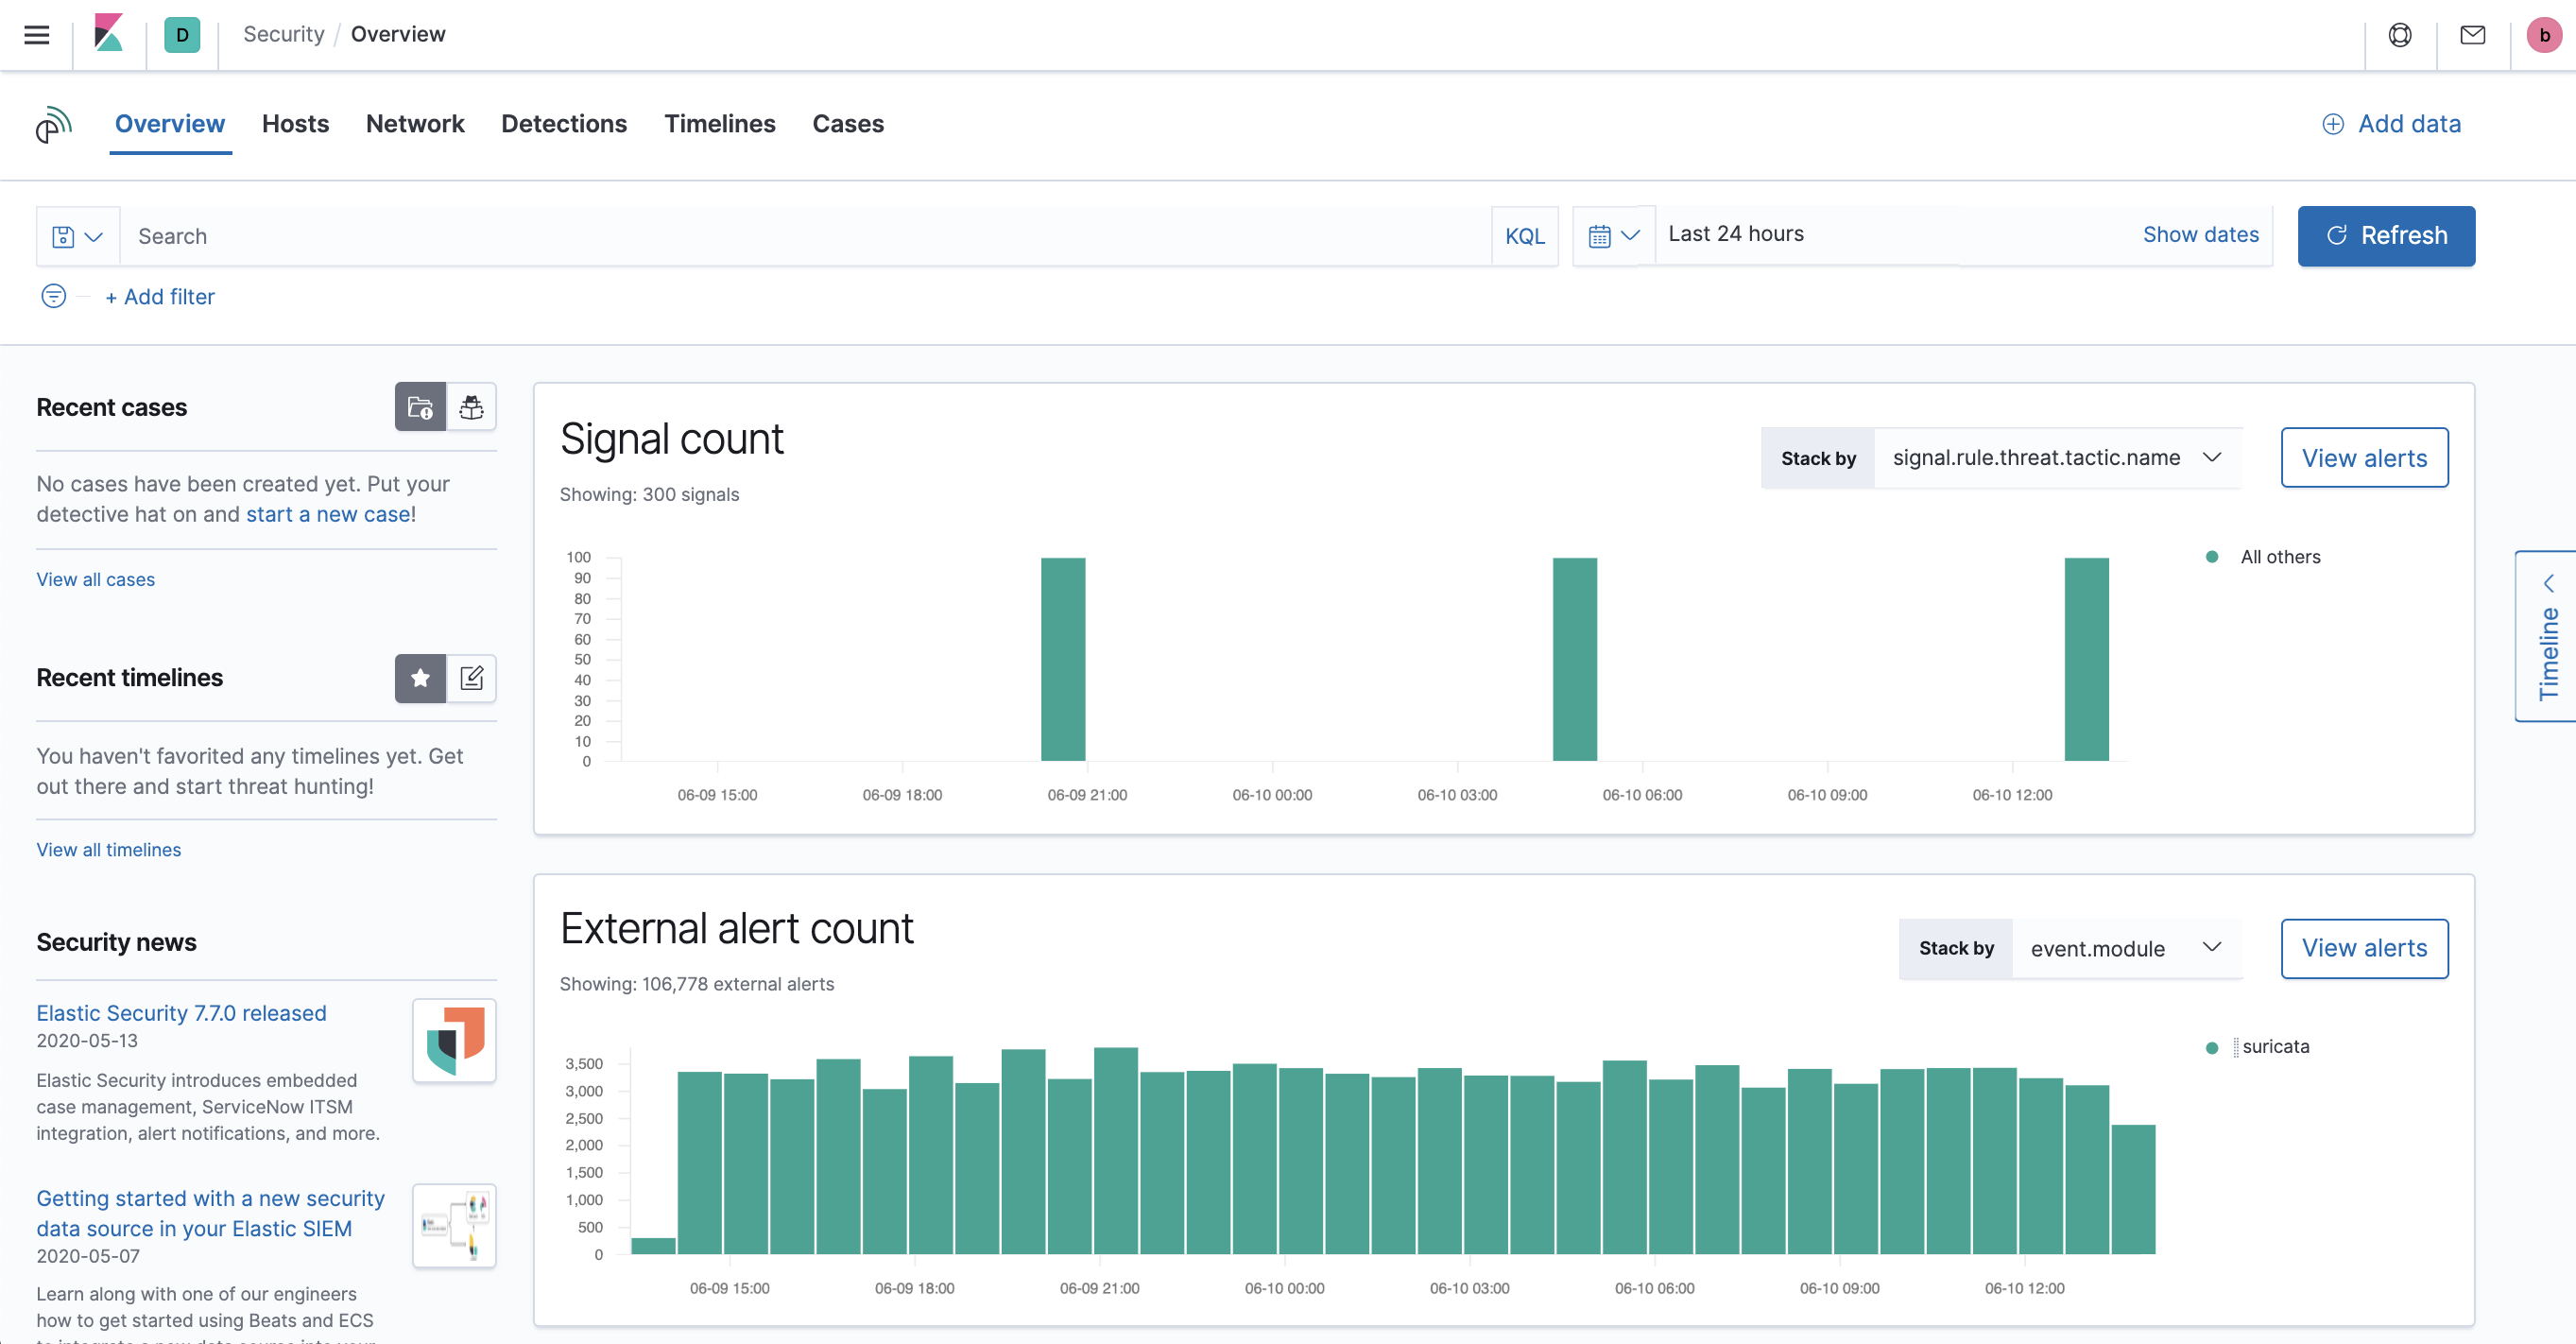
Signals countedit
The signals histogram displays a count of all the Signals detected by the SIEM app within a set time frame. In the Stack by dropdown, select specific parameters for which to visualize the signal count. For example, stack by user.name for the graph to visualize the number of signals attributed to a specific user.
To create signal detection rules, see Managing Signal Detection Rules.
External alerts countedit
The external alerts histogram displays a count within a certain time frame. You can stack by two parameters: event-category or event.module.
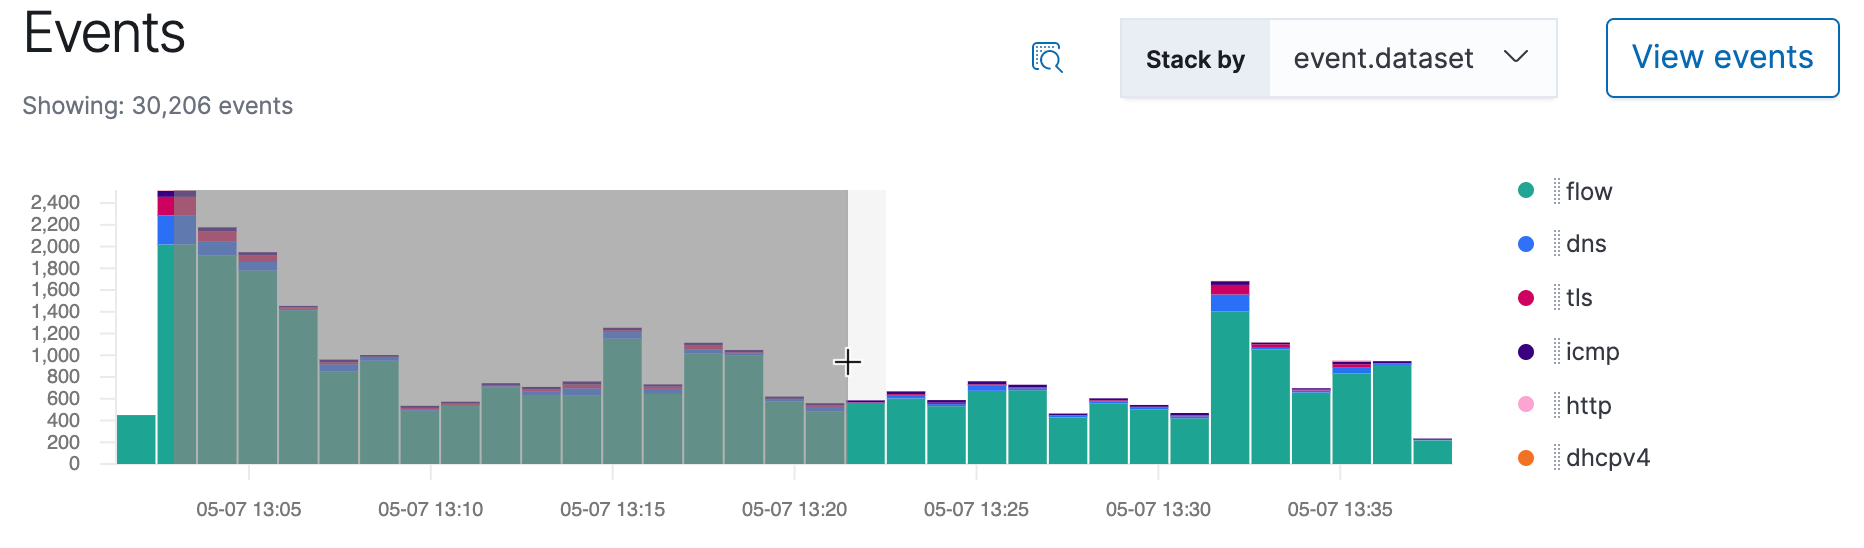
Events countedit
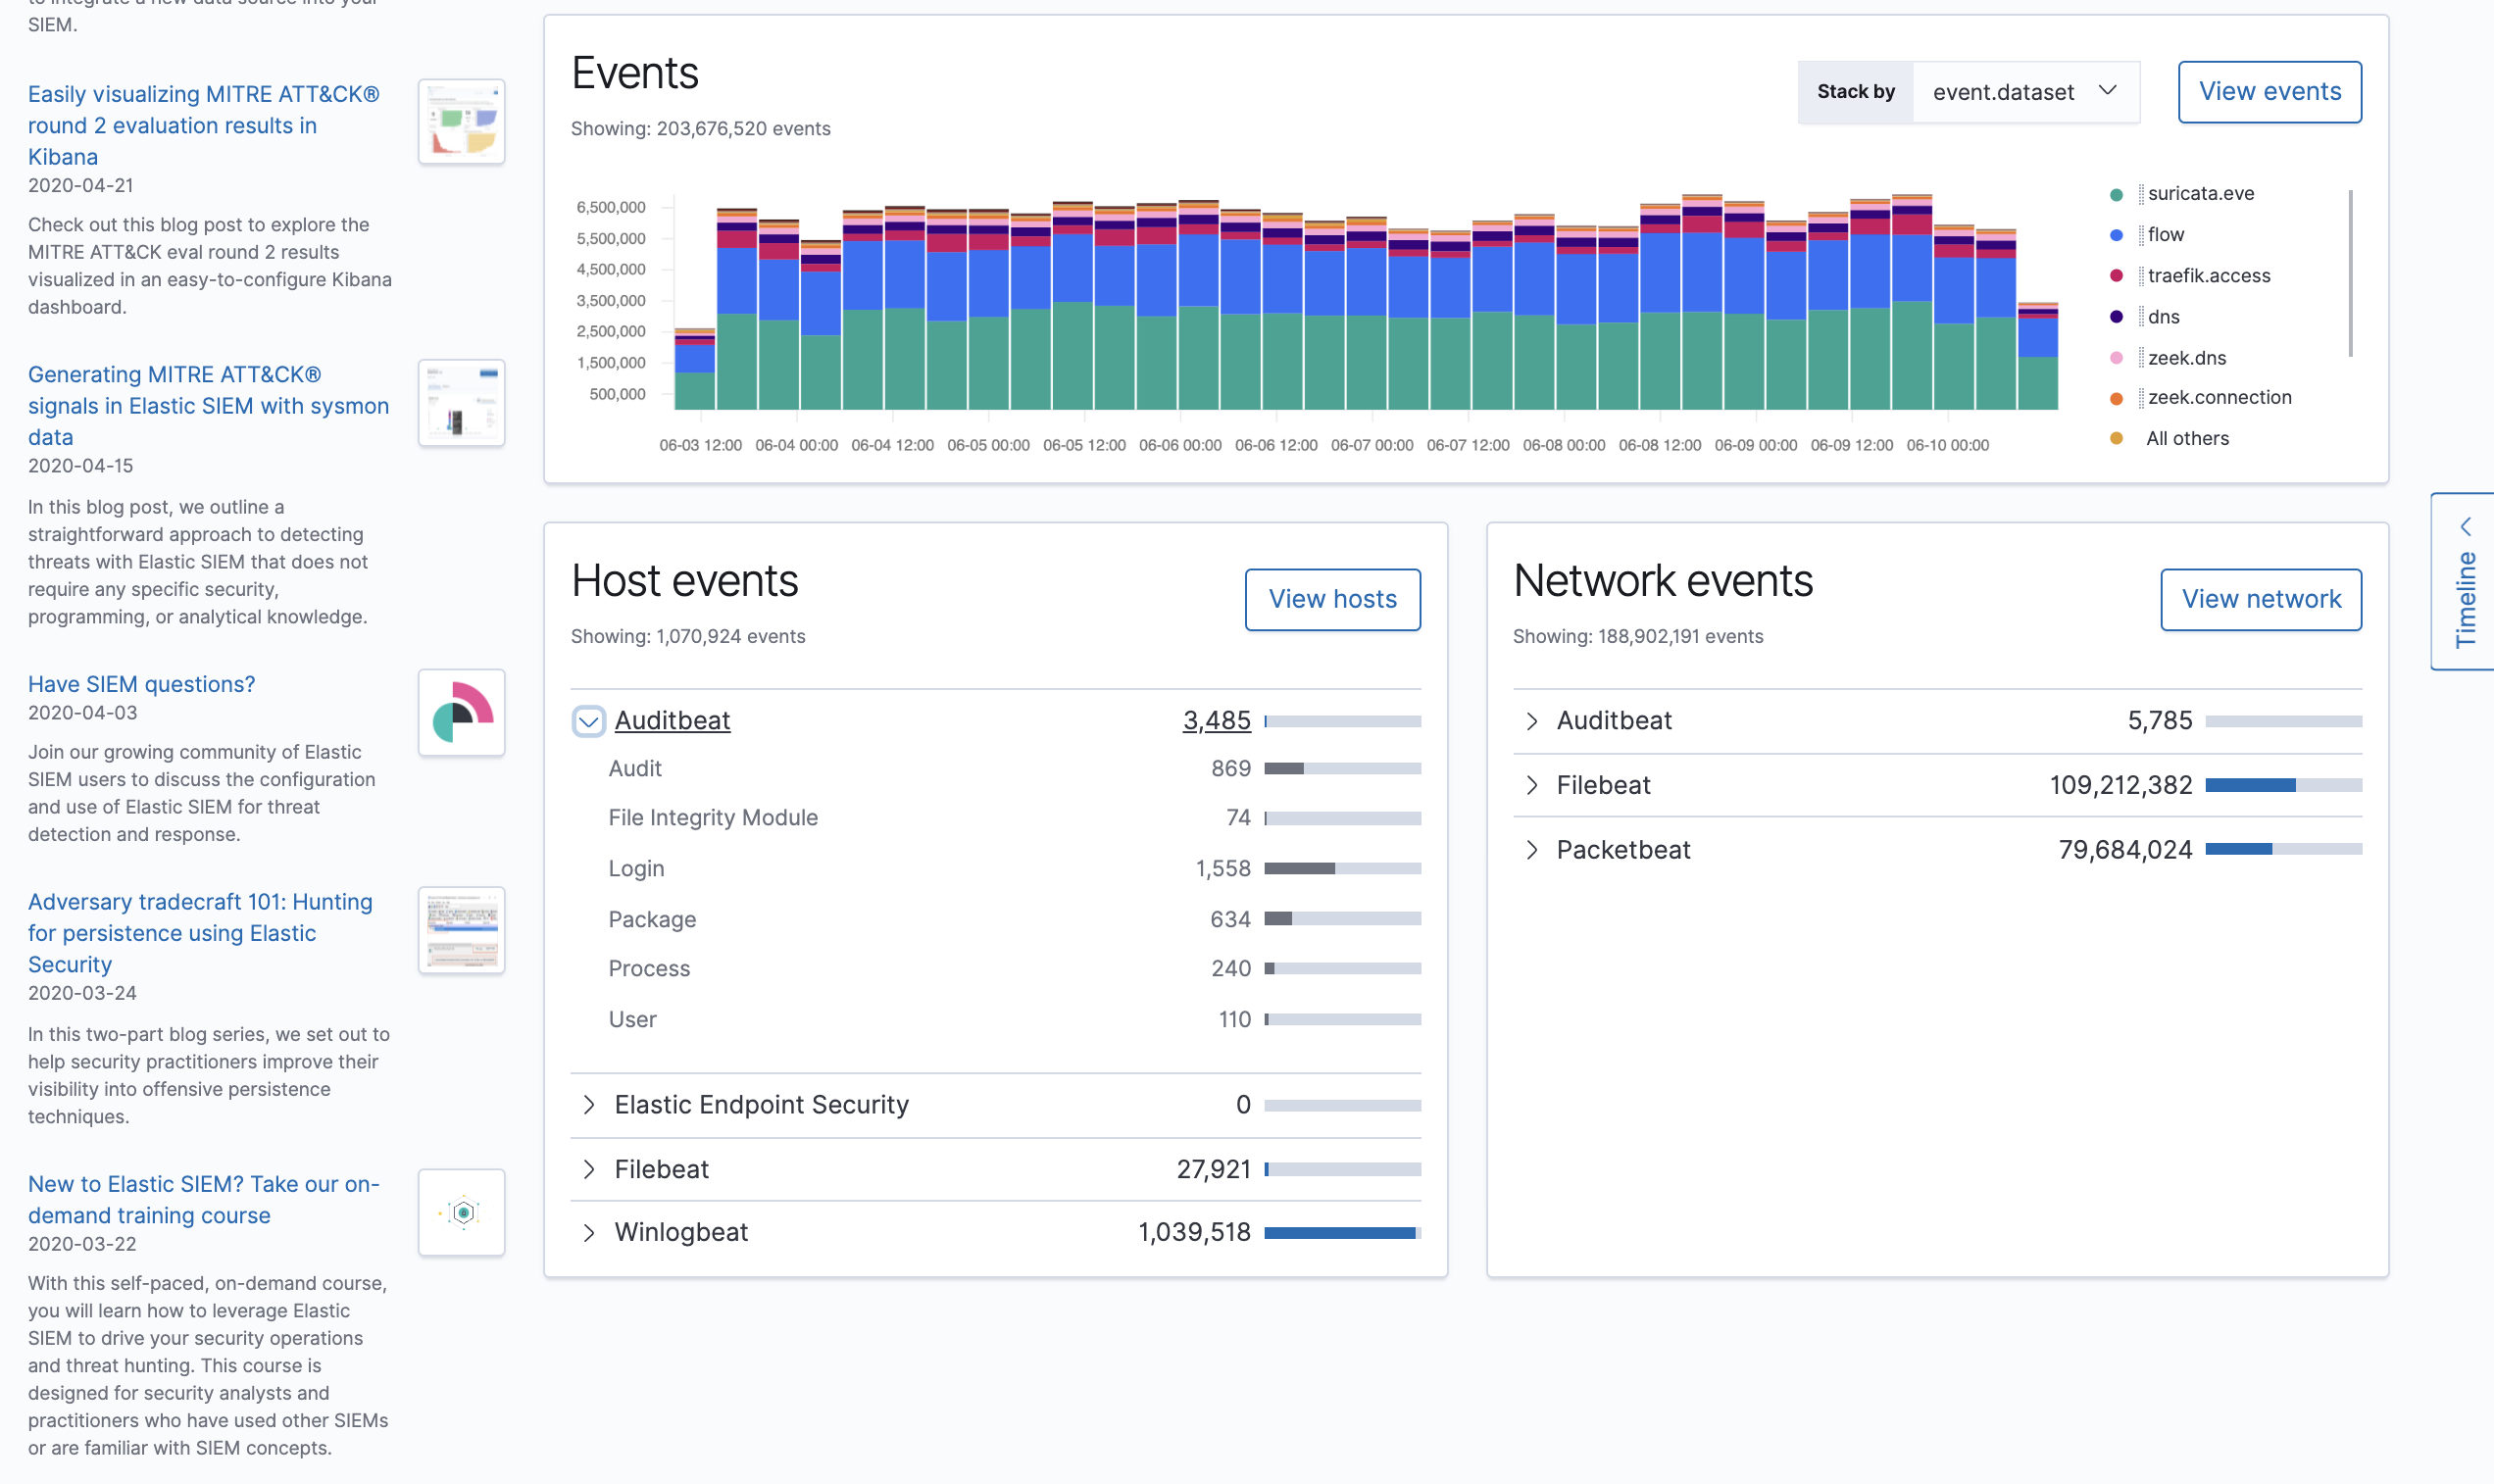
The events count histogram displays a count of all events within a set time frame. You can stack by event.action, event.dataset, or event.module.
Host and network eventsedit
View event and host counts specific to Elastic data shippers and apps, such as Auditbeats or Elastic Endpoint Security. Expand each category for specific counts of hosts or network events related to the category.
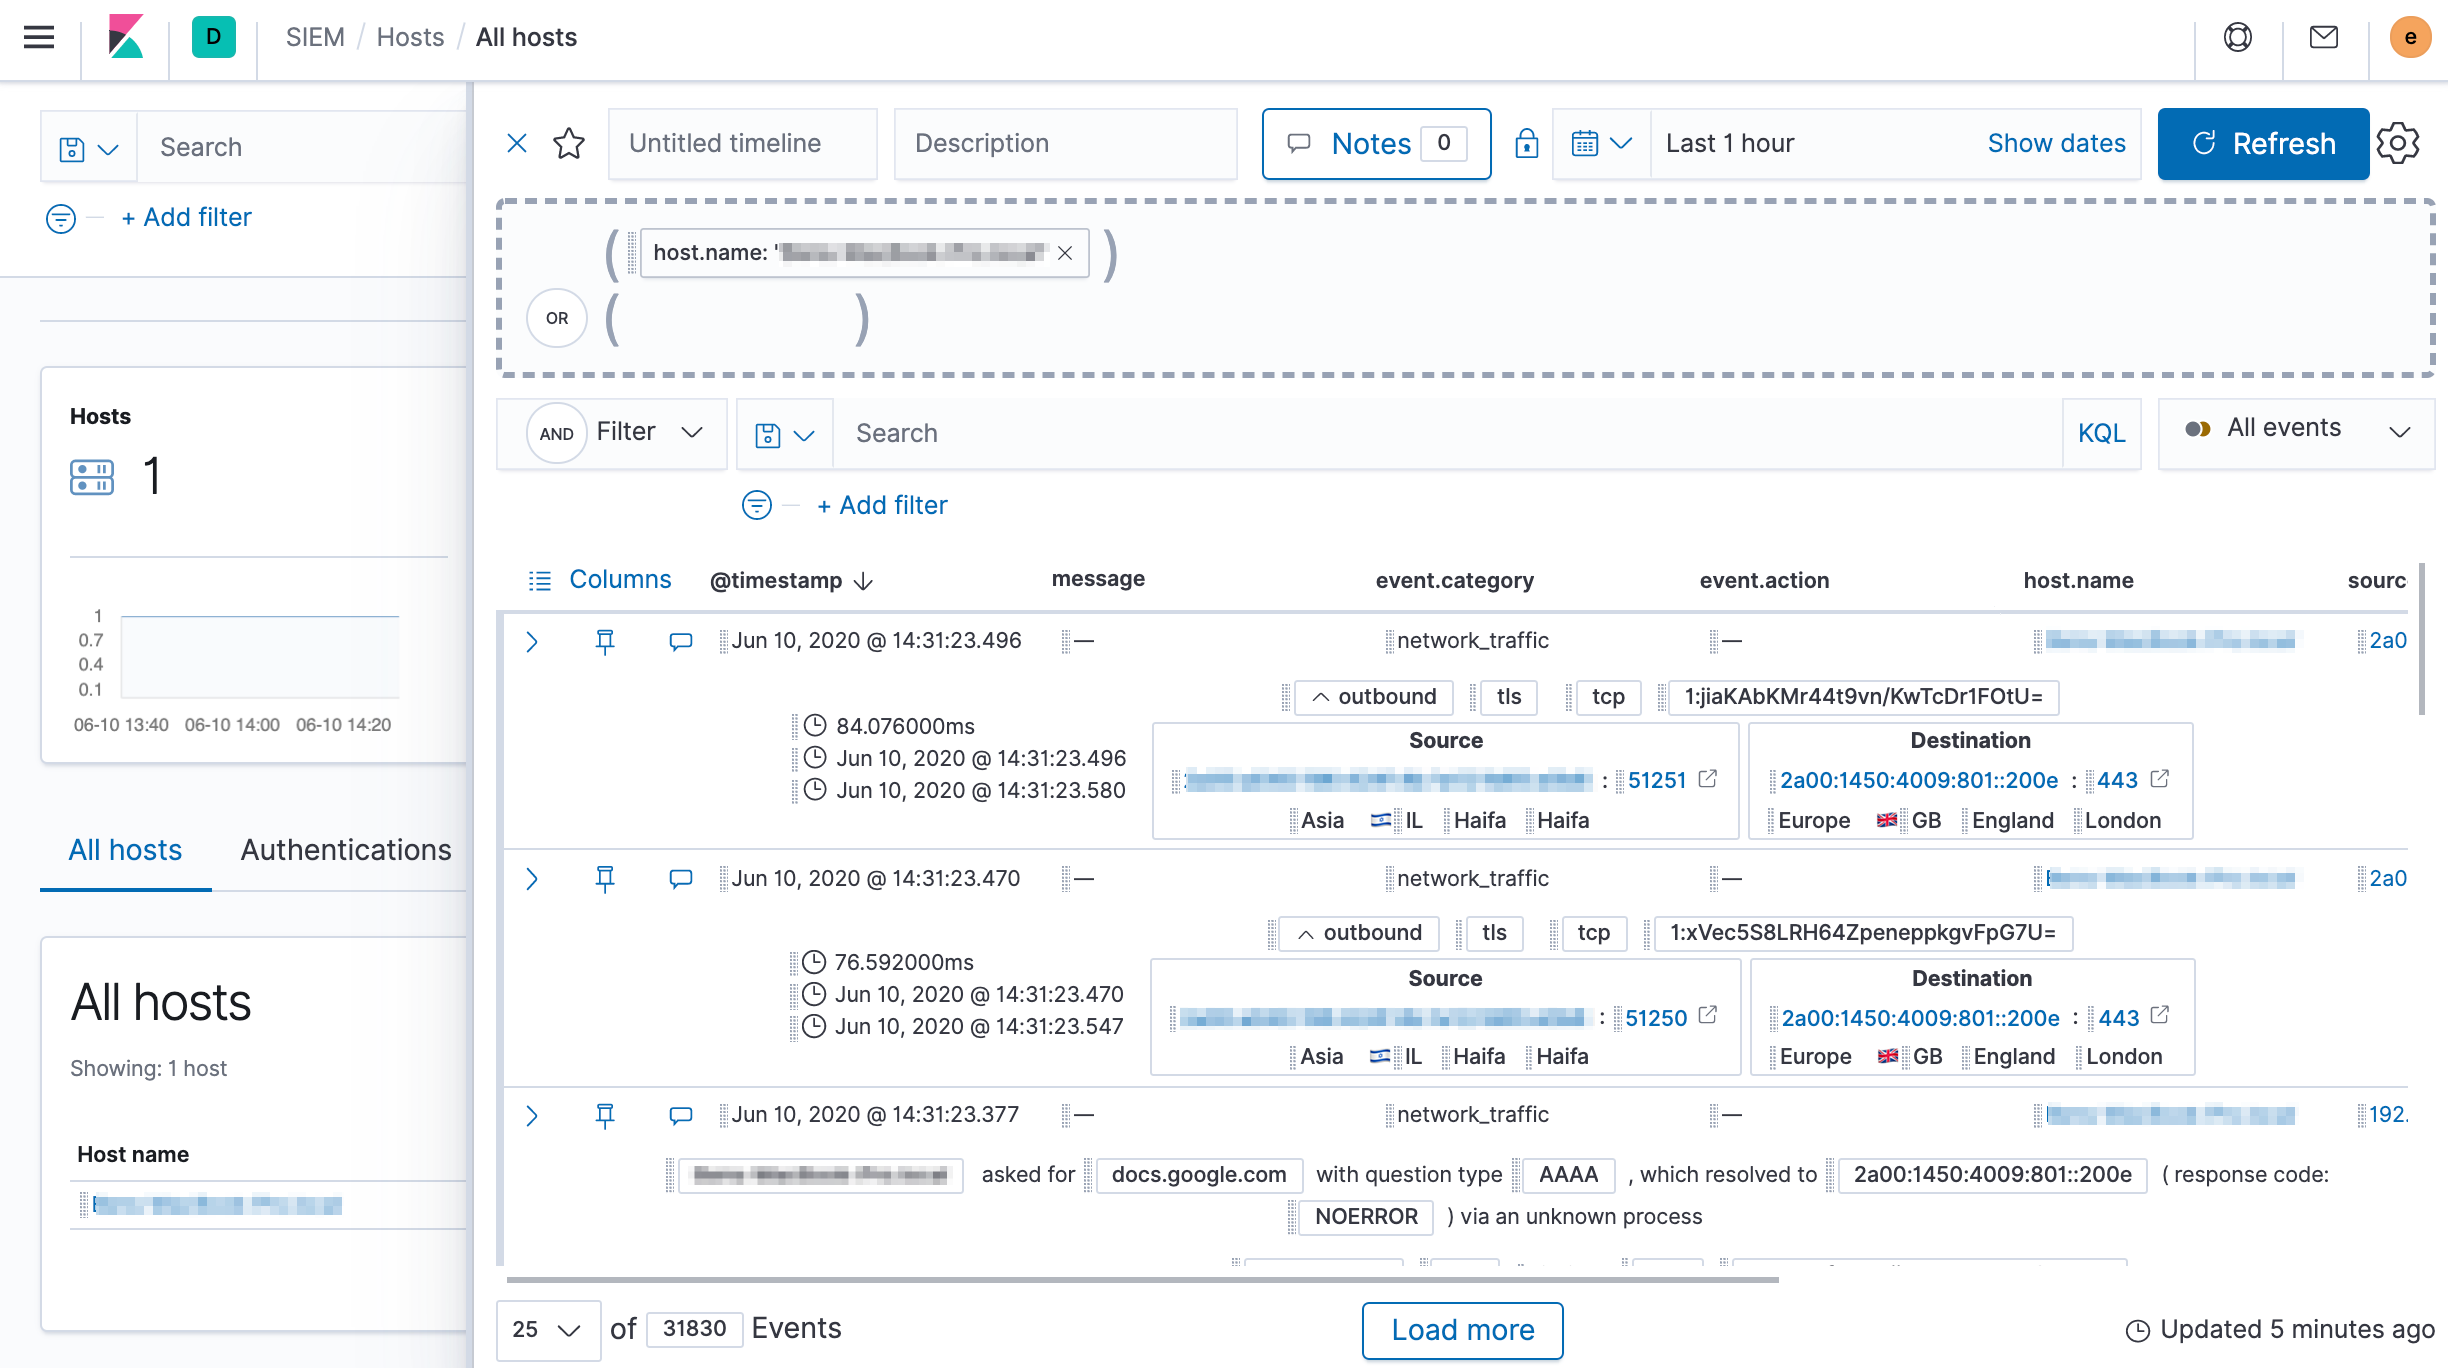
Hosts pageedit
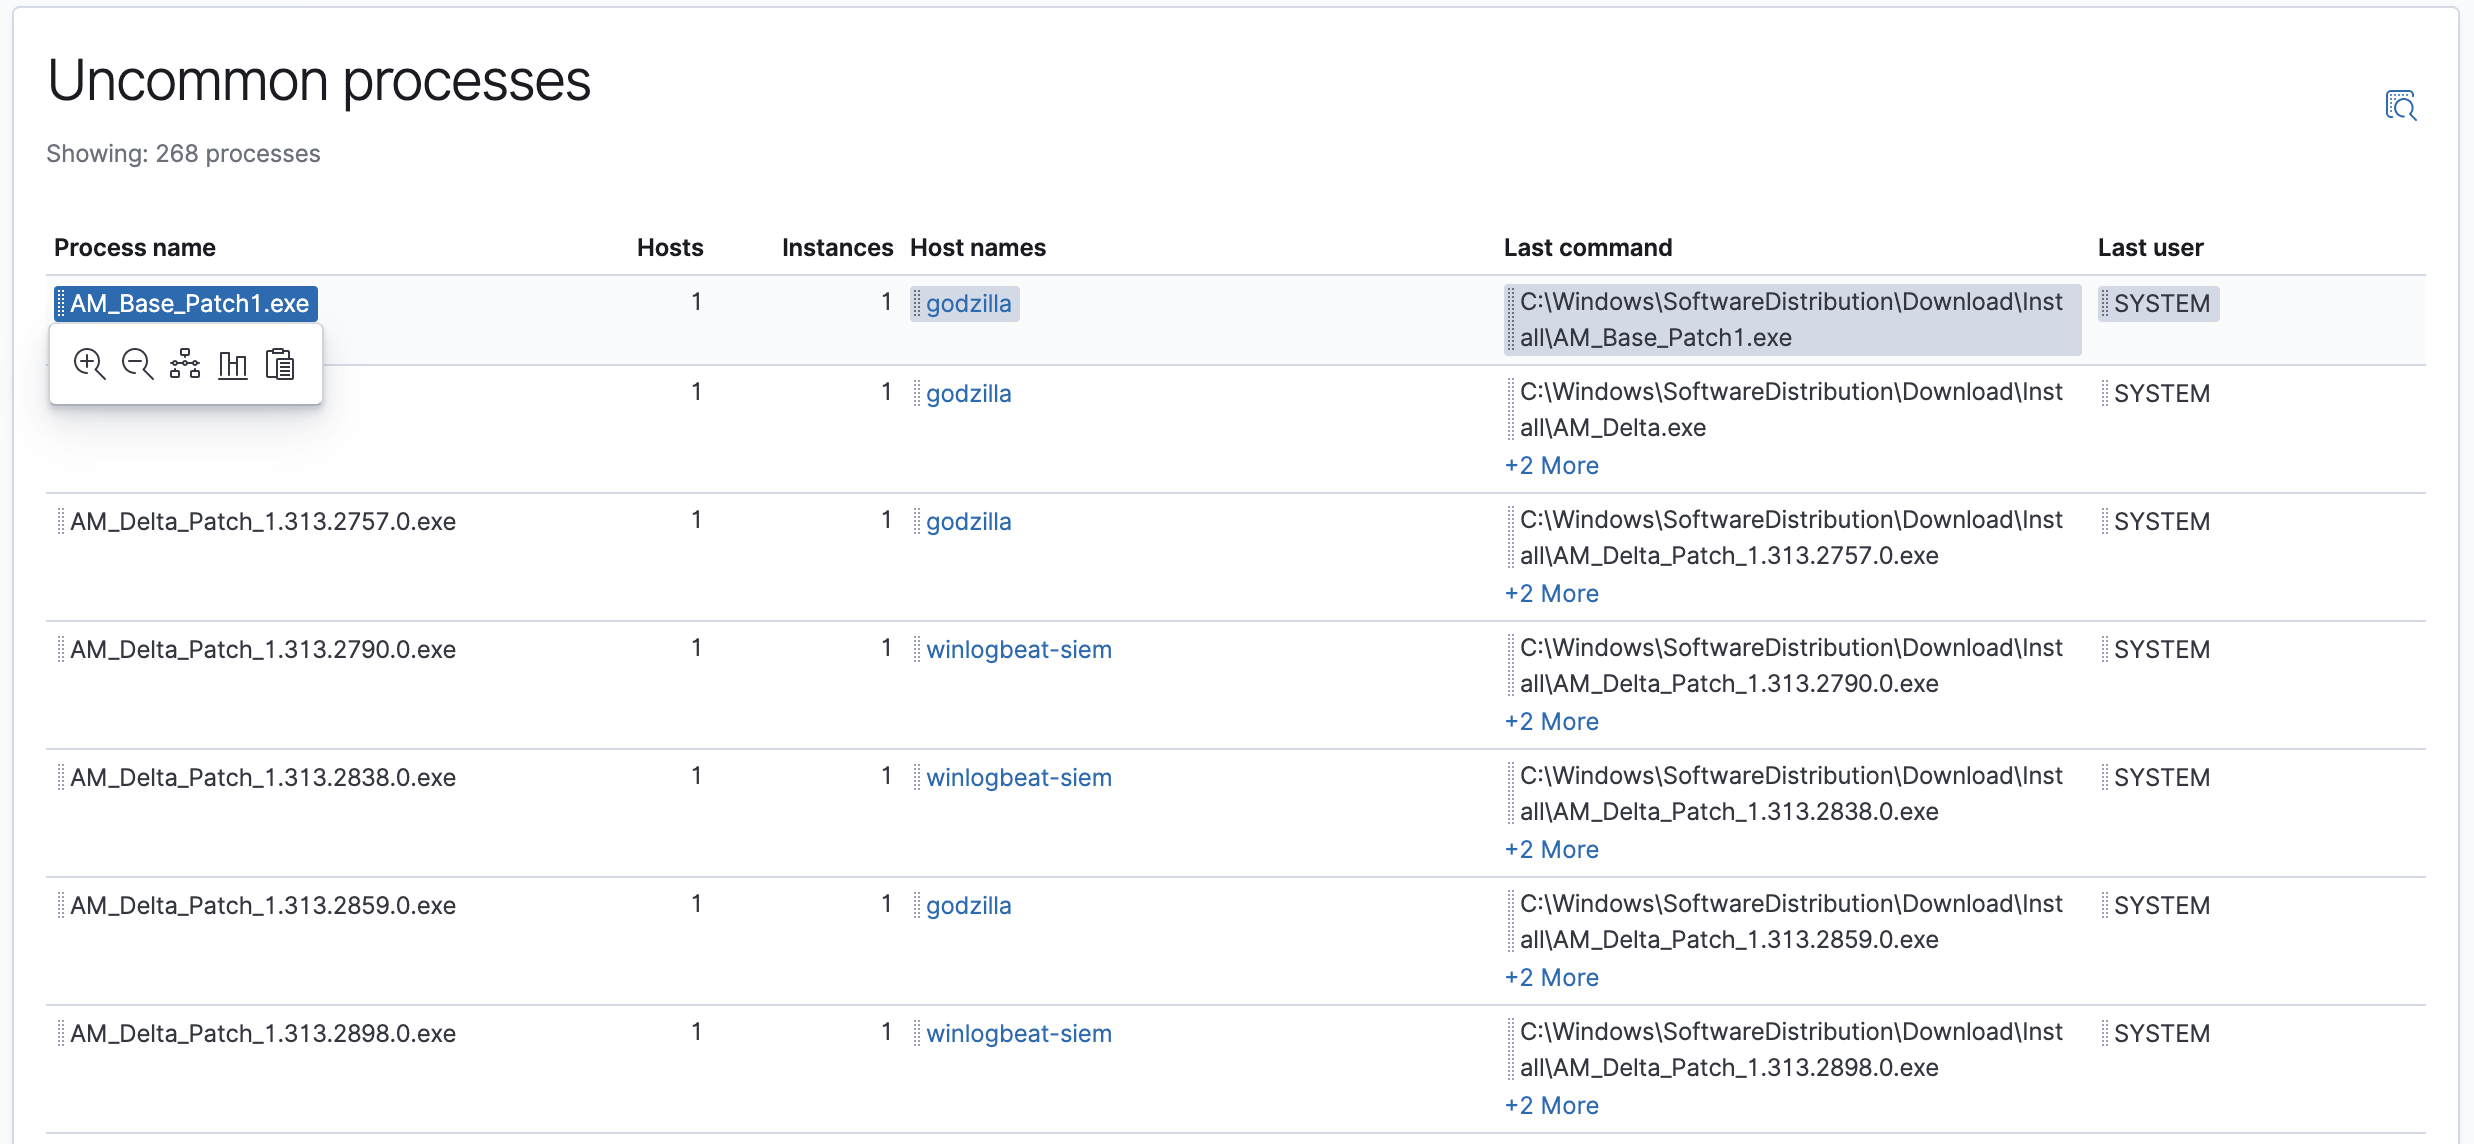
The Hosts view provides key metrics regarding host-related security events, and a set of data tables that let you interact with the Timeline Event Viewer. You can drag and drop items of interest from the Hosts view tables to Timeline for further investigation.
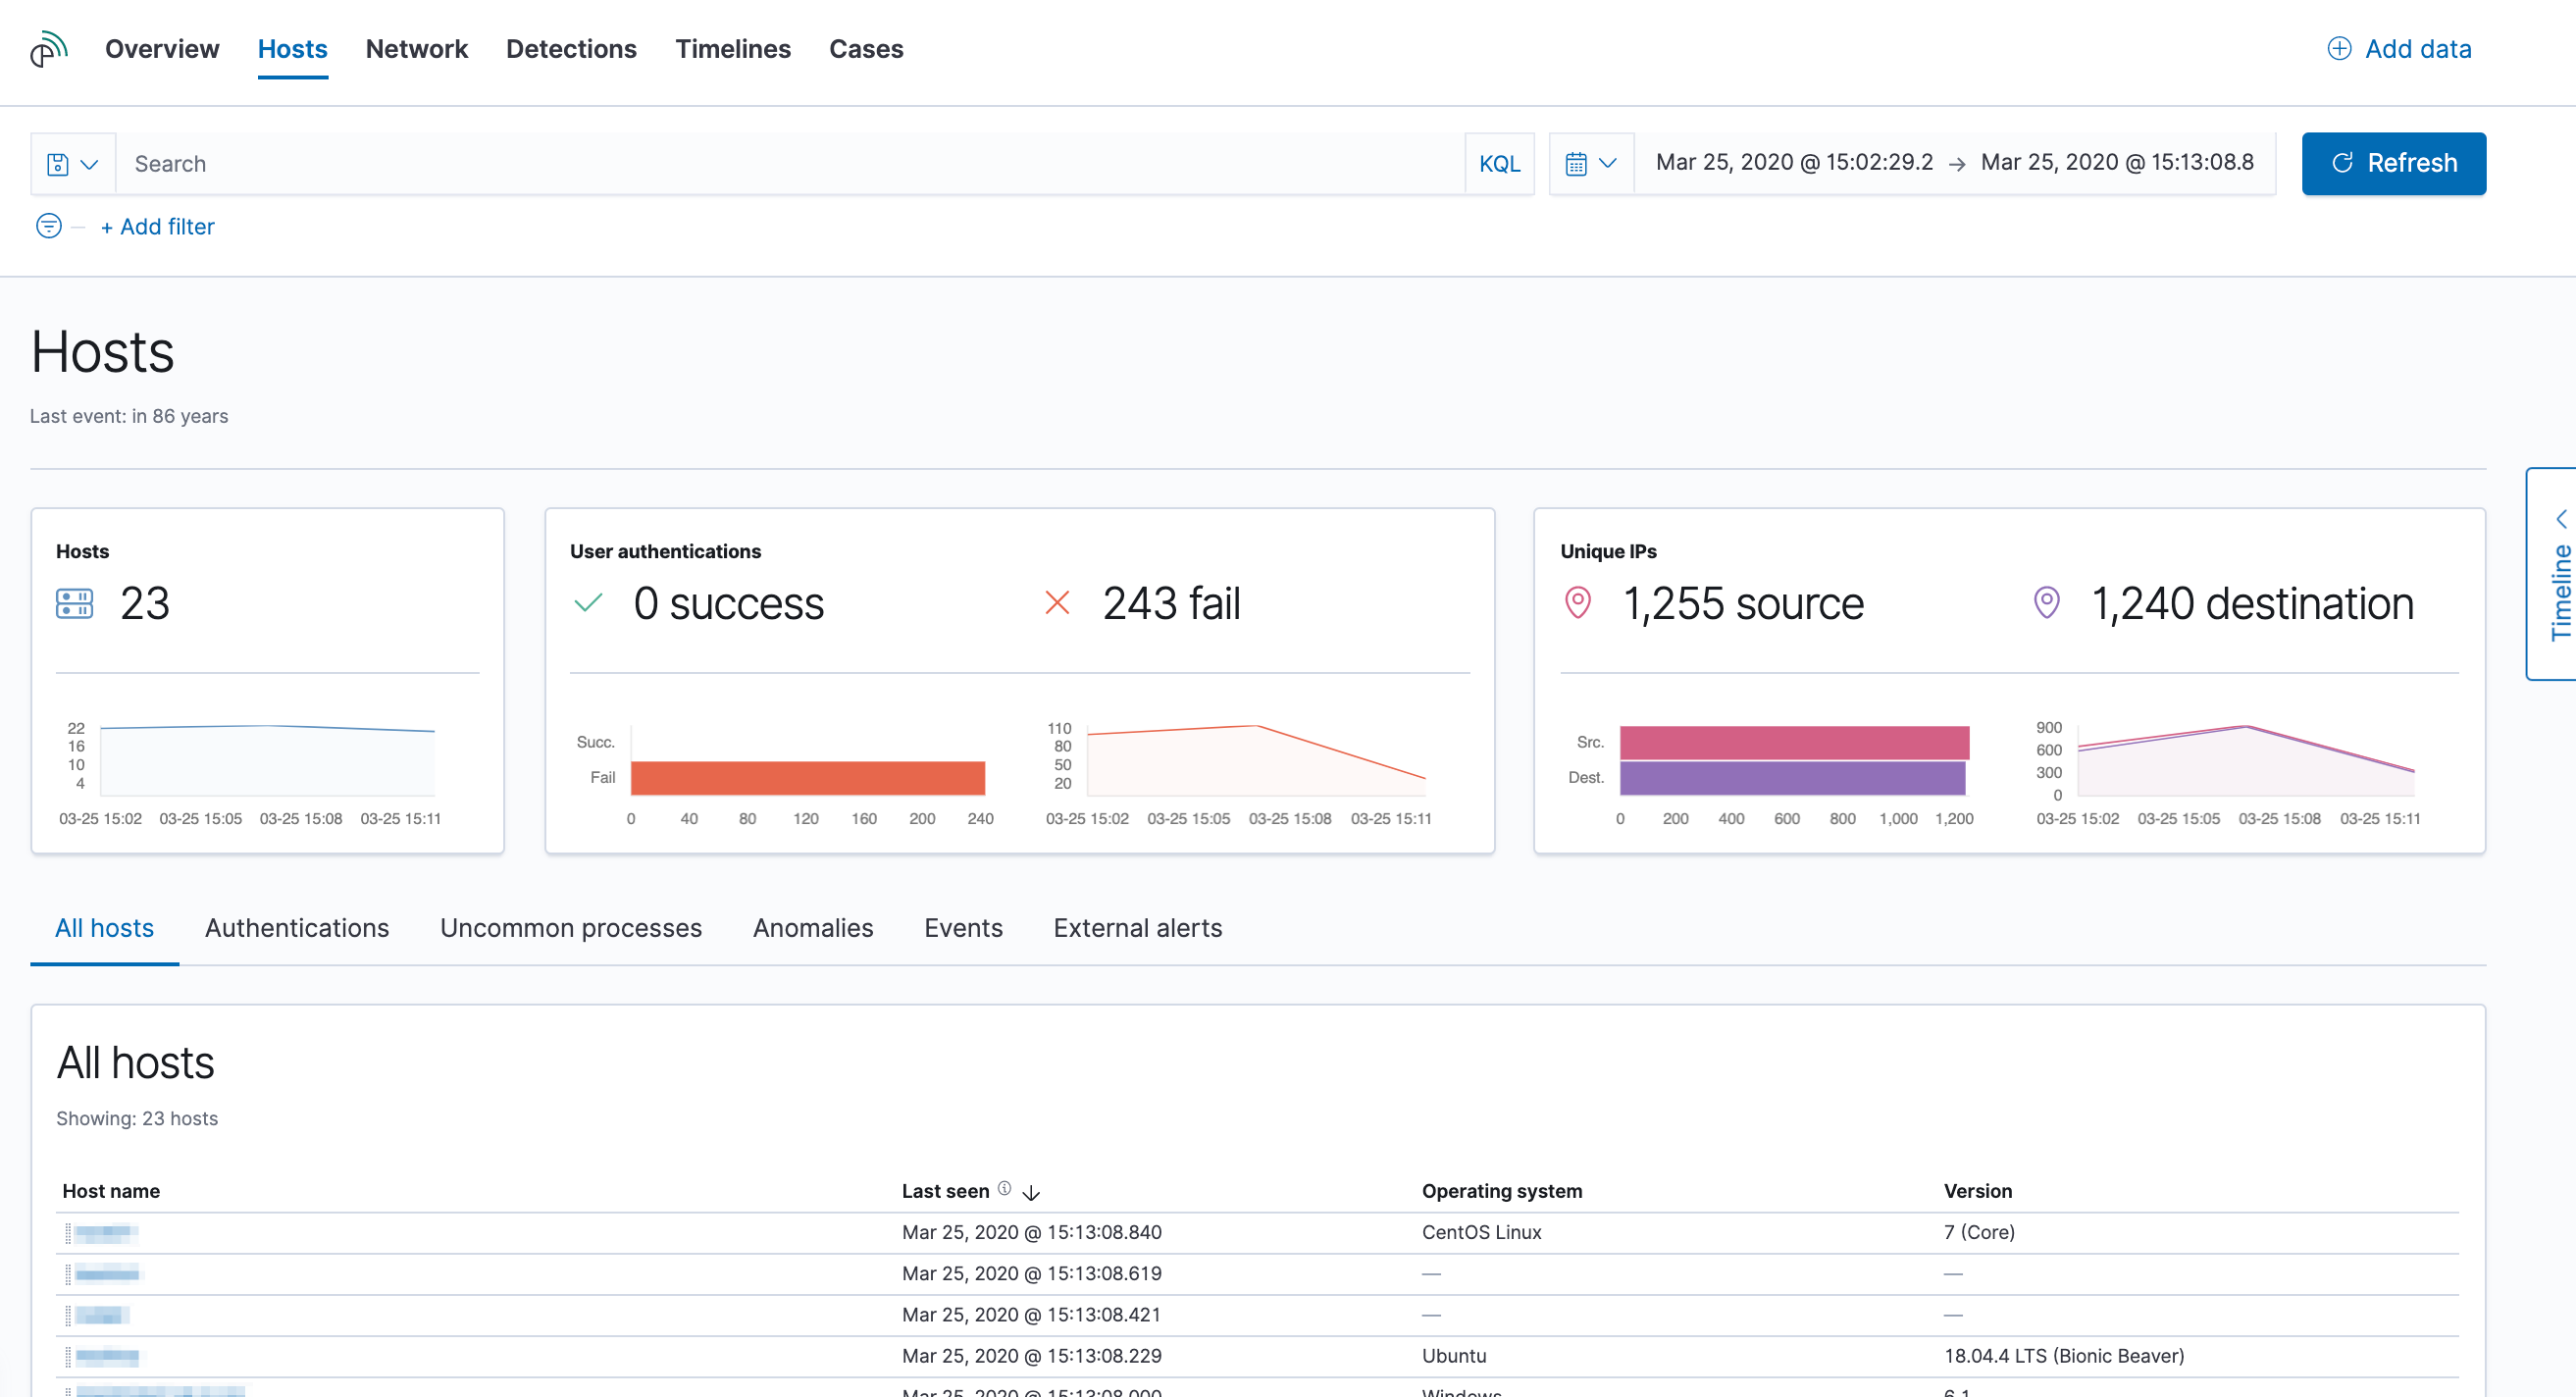
Interactive widgets let you drill down for deeper insights:
- Hosts
- User Authentications (success and failures)
- Unique IPs
There are also tabs for viewing and investigating specific types of data:
- All hosts: high-level host details
- Authentications: authentication events
- Uncommon processes: uncommon processes running on hosts
- Anomalies: anomalies discovered by machine learning jobs
- Events: all host events
- External alerts: alerts received from external monitoring tools, such as Elastic Endpoint Security
Host detail pages show information for a selected host, including Host ID, First Seen timestamp, Last Seen timestamp, IP and MAC addresses, OS, versions, machine type, and so forth. Additionally, it contains all the widgets and tabs relevant for the selected host.
Network pageedit
The Network view provides key network activity metrics and an interactive map, and provides network event tables that enable interaction with the Timeline. You can drag and drop items of interest from the Network view to Timeline for further investigation.
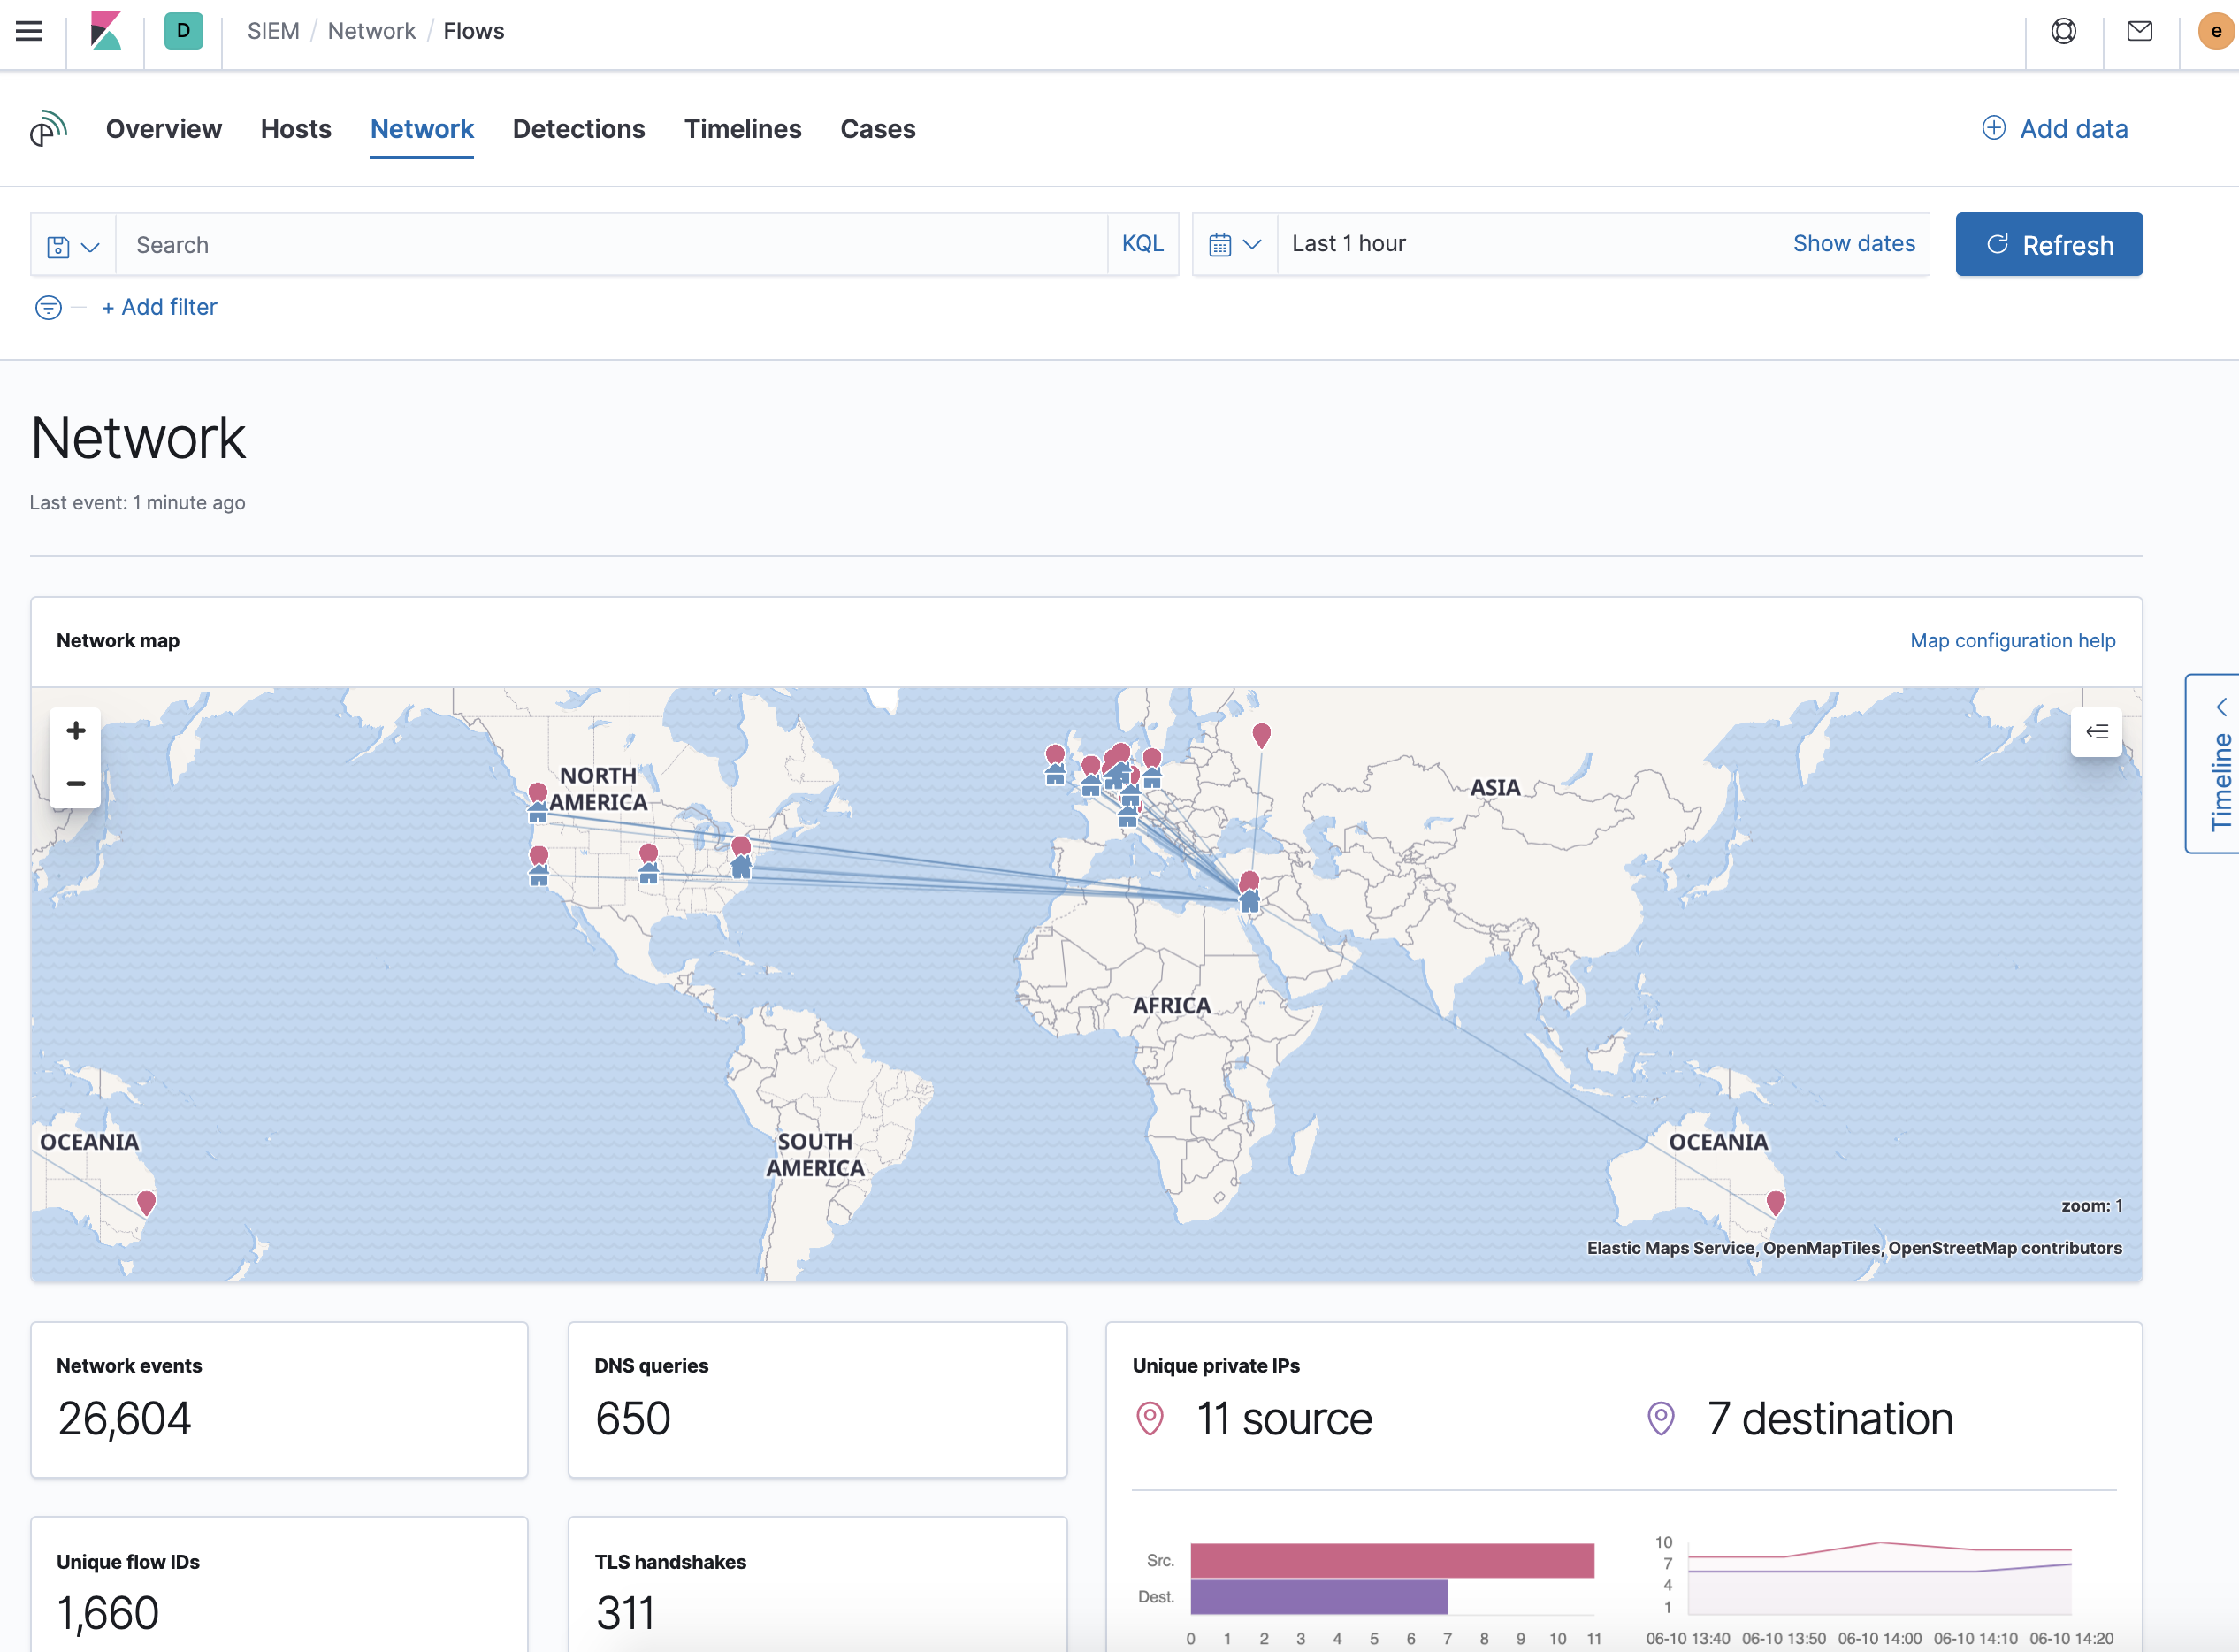
Interactive widgets let you drill down for deeper insights:
- Network events
- DNS queries
- Unique flow IDs
- TLS handshakes
- Unique private IPs
There are also tabs for viewing and investigating specific types of data:
- Flows: source and destination IP addresses and countries
- DNS: DNS network queries
- HTTP: received HTTP requests (HTTP requests for applications using Elastic APM are monitored by default)
- TLS: handshake details
- Anomalies: anomalies discovered by machine learning jobs
- External alerts: alerts received from external monitoring tools, such as Elastic Endpoint Security
IP detail pages show information for the selected IP address, including
links to external sites for verifying the IP address’s reputation. By default,
the external sites are TALOS and
VIRUSTOTAL. You can change the displayed
reputation links in Kibana → Management → Advanced Settings →
siem:ipReputationLinks. The siem:ipReputationLinks setting contains a
JSON array with these fields:
-
name: UI display name. -
url_template: URL of the link. It can include{{ip}}, which is placeholder for the IP address you are viewing on the details page.
For example:
[
  { "name": "virustotal.com", "url_template": "https://www.virustotal.com/gui/search/{{ip}}" },
  { "name": "dnschecker.org", "url_template": "https://www.dnschecker.org/ip-location.php?ip={{ip}}" },
  { "name": "talosIntelligence.com", "url_template": "https://talosintelligence.com/reputation_center/lookup?search={{ip}}" }
]
Mapedit
The map provides a visual overview of your network traffic. It is interactive, so you can start exploring data directly from the map. Hover over source and destination points to see more information, such as hostnames and IP addresses. To drill down, click a point and use the filter icon to add a field to the filter bar or drag a field to the Timeline. You can also click a hostname to jump to the SIEM Host page, or an IP address to open the relevant network details.
Just as you can start an investigation using the map, the map refreshes to show relevant data when you run a query or update the time frame.
To add and remove layers, click on the more options icon in the top right corner of the map.
Configuring map data describes how to add map data and set up interactions.
Detections pageedit
The Detections page provides an overview of all the signals created by signal detection rules. It is also the place where you can enable prebuilt rules and create new rules. Detections (beta) provides a detailed description of Detections and how to use it.
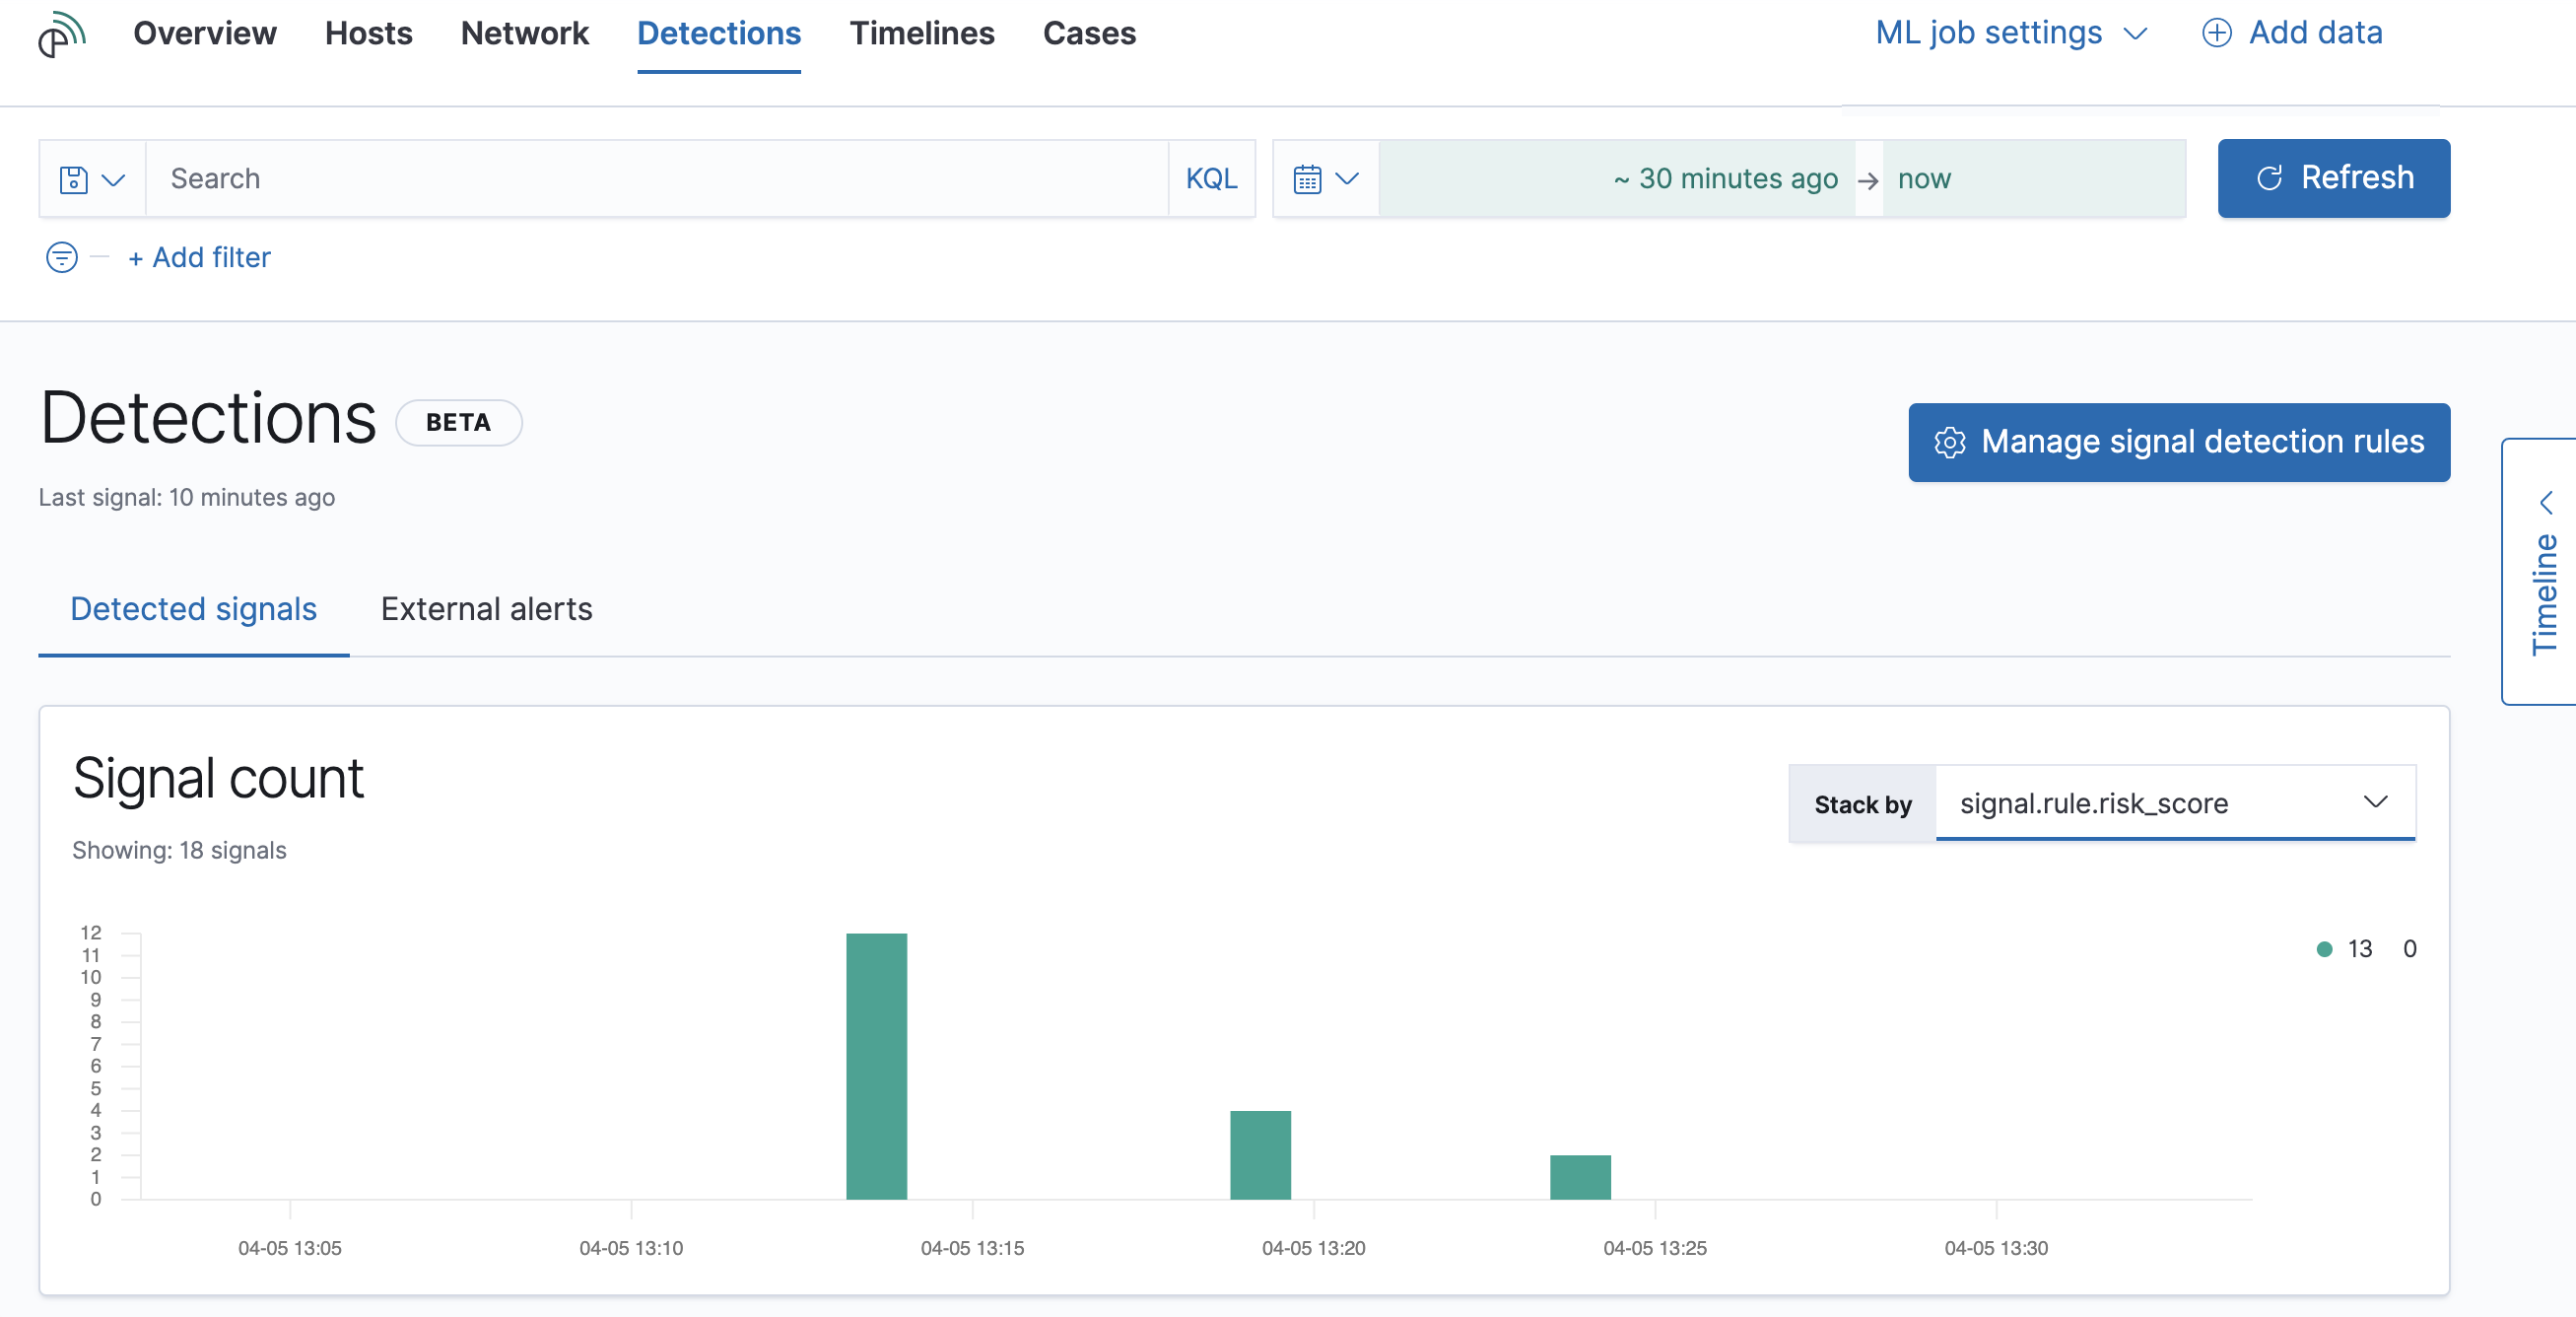
The Signal count histogram shows the detection rate of signals
according to various attributes, including Risk scores, Severities, and
Top event categories. The All signals table helps with investigations,
allowing you to search, filter, and aggregate all SIEM signals.
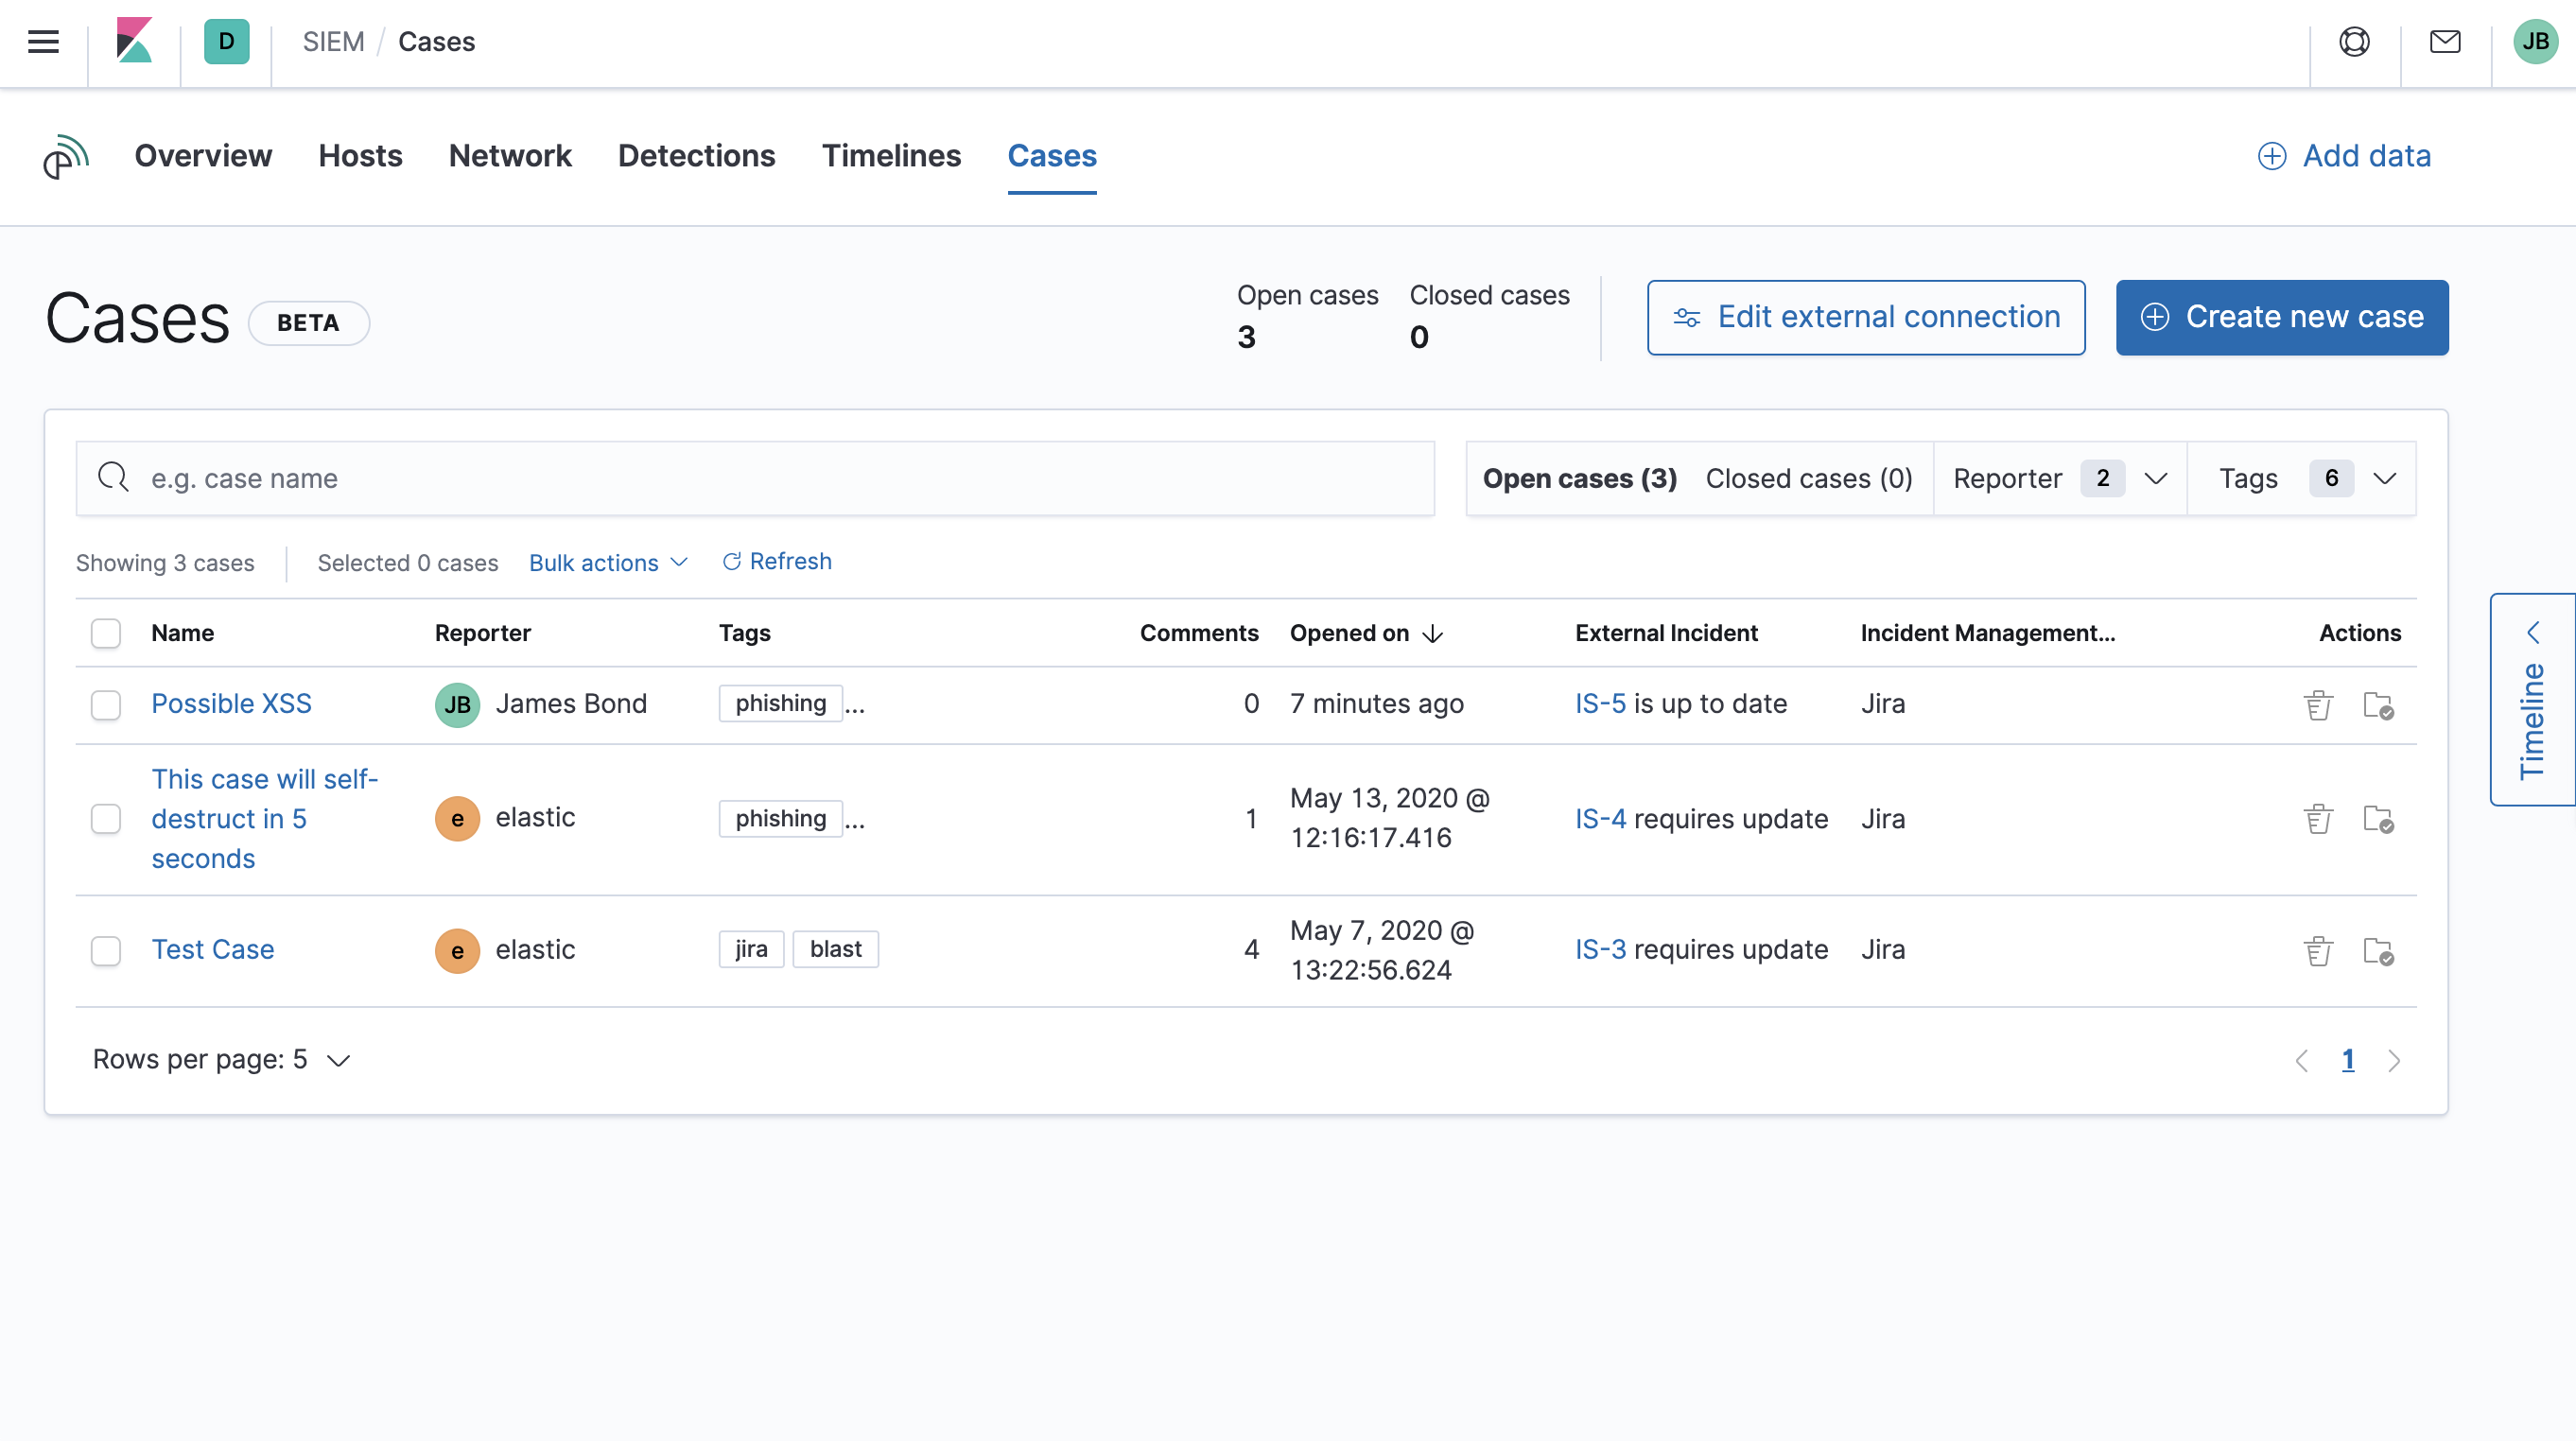
Cases pageedit
The Cases page is used to open and track security issues directly in the SIEM app. For more information, see Cases (beta).
Timelinesedit
Use Timeline as your workspace for alert investigations or threat hunting. Data from multiple indices can be added to a timeline, which enables investigating complex threats, such as lateral movement of malware across hosts in your network.
You can drag objects of interest into Timeline to create exactly the query filter you need to get to the bottom of an alert. You can drag items from table widgets within Hosts and Network pages, or even from within Timeline itself.
A timeline is responsive and persists as you move through the SIEM app collecting data. Auto-saving ensures that the results of your investigation are available for review by other analysts and incident response teams.
Add notes for your own use and to communicate your workflow and findings to others. You can share a timeline, or pass it off to another person or team. You can also link to timelines from Cases and external ticketing systems.
Focus on signals or raw eventsedit
Many security events in Timeline are presented in an easy-to-follow rendered view, which enables quicker analyst understanding. Using the drop-down options by the KQL bar, you can select whether signals, other raw events, or both are displayed in the Timeline.
You can click and expand events from within Timeline to see the underlying event data, either in tabular form, or as Elasticsearch JSON.
Narrow or expand your queryedit
You can specify logical AND and OR operations with an item’s placement in
the drop area. Horizontal filters are AND-ed together. Vertical filters or
sets are OR-ed together. As you hover the item over the drop area, you can see
whether your placement is on target to create an AND or OR filters.
Pivot on a data pointedit
Click a filter to access additional operations such as exclude, temporarily disable, or delete items from the query. For example, you can change an included item so that it is excluded.
Get more context for each eventedit
As you build and modify your queries, you can see the results of your interactions in the details pane below.
As your query takes shape, an easy-to-follow rendered view appears for events. It shows relevant contextual information that helps tell the backstory of the event. If you see a particular item that interests you, you can drag it to the drop area for further introspection.
Export and import timelinesedit
You can import and export timelines, which enables importing timelines from one
Kibana space or instance to another. Exported timelines are saved in an
ndjson file.
- Go to SIEM → Timelines.
-
To export timelines, do one of the following:
- To export one timeline, click the more actions icon in the relevant row and then select Export selected.
- To export multiple timelines, select all the required timelines and then click Bulk actions → Export selected.
-
To import timelines, click Import Timeline and then select or drap-and-drop
the timeline
ndjsonfile.
Other actionsedit
The Timeline is flexible and highly interactive. As you would expect, the SIEM app lets you:
- add, remove, reorder, or resize Timeline columns
- save, open, and list Timelines
- add notes to individual events
- add investigation notes for the whole Timeline
- pin events to the Timeline for persistence
Try clicking to expand or collapse items, or dragging and dropping them to other areas to see what happens. Are there interactions that you would expect to see that aren’t present? Let us know. We welcome your input.